Chapter 11
Quantifying and Accounting for Information Assets
In addition to the tragic loss of life and property on 9/11, there was another type of loss: the loss of corporate information assets.
The terrorist attacks of 2001 happened before off-site backups or cloud-based data storage had become mainstream. In the weeks and months following 9/11, we heard from clients with businesses in the Twin Towers who had lost their data and were struggling to recreate it and somehow remain solvent.1 Also, just as any organization suffering a loss of property, some of these companies had filed claims with their insurers for the value of the information assets they lost. Although commercial general liability (CGL) policies at the time were not explicit, insurers roundly denied these claims, arguing that information was not considered property (just as some courts discussed in the previous chapter have ruled).
The insurance industry realized it was exposed to claims for the loss or damage of information, and potential legal action after such claims were denied. Adding insult to injury, the U.S. insurance industry updated its CGL policy template to explicitly exclude information assets from property coverage, inserting the language: “electronic data is not tangible property.” When did the insurance industry do this? October of 2001, barely a month after 9/11.2
Not to be outdone, the accounting profession followed suit a few years later with an update to a key financial standard (IAS 38) stating explicitly that certain intangibles including customer lists and the like (generally interpreted by accountants as “any electronic data”) cannot be capitalized. In short, the value of information assets cannot be included on auditable financial statements.
So while we revere the 9/11 first responders, there’s reason to consider that there were some worst responders as well.
Regardless, in this chapter we’ll ignore insurance industry and accounting profession dictums, in favor of an understanding of why it is prudent for organizations to measure quality and value of their information assets, and how to do so.
Why Measure Information Assets?
Imagine if some of these companies had detailed, accurate inventories of their information assets. Or if they had formal, audited valuations placed on them. In the absence of a CGL policy exclusion clause for “electronic data,” their claims would have had to be taken more seriously, and likely would have been upheld by the courts. There are plenty of other reasons why organizations should quantify the value or other measurable aspects of their information assets, including both information-related and business-related benefits.
Mark Milone, senior legal counsel to Information and Analytics at Boeing had the answer to this question, but not the answer as to how to do it:
It’s important to know how much your data is worth. What’s the financial risk to the company if data is lost or corrupted? And what are the ways it can add benefits to the business? But the firms we spoke with that specialize in venture capital and IP valuation had no answer how to value information. It made me wonder how are they able to price M&A deals in today’s information economy?
Boeing now is one of several companies relying on the information valuation models I will detail later in this chapter, and benefiting from them in several of the following ways.
Information-Related Measurement Benefits
Improved Information Management and Culture
Outside Chicago from 1905–1983, a large Western Electric factory complex called the Hawthorne Works employed forty-five thousand workers at its peak. In the 1920s, industrial researcher and organizational theorist Elton Mayo ran a series of famous experiments at the plant resulting in the coining of the Hawthorne Effect,3 which he describes as a positive emotional effect due to the perception of an interested or sympathetic observer.4
Just as with other assets, the mere act of measuring and reporting on information’s quantity, quality characteristics, usage patterns, and the various ways it is used sheds a spotlight on it that alone can change the way people capture, produce, manage, and use it.
The Hawthorne Effect may have inspired the quote often misattributed both to the father of quality management, Edward Deming, and the father of modern management, Peter Drucker: “You can’t manage what you don’t measure.” Regardless, this quote holds perpetual sway among management professionals in all disciplines. But since it elicits disdain from others, I might suggest that “It’s easier to manage what you measure” or “It’s best to measure what you intend to manage,” are more reasonable takes on this famous aphorism.
Prioritizing Information-Related Initiatives
As GE Power’s CDO, Christina Clark, told me, “I haven’t yet come up with the right analogy for how big the challenge is. If the CDO did everything the CDO could to help manage the enterprise’s data better, it would require an army or a complete reorganization. Prioritizing is the key to survival and sanity.”
Understanding which information assets are used by the most processes, are the most critical to business outcomes, have the biggest quality challenges, or present the greatest compliance, security, or privacy risks makes a start to prioritizing information asset management (IAM) activities and initiatives.
Creating a Common Language About Information
As highlighted in chapter 6, my colleague Valerie Logan has identified that overcoming issues related to the vernacular surrounding information is one of the keys to improving its management. The ability to describe data quality, security, availability, or value generation needs and challenges in numerical values offers a way for IT, business people, CFOs, information professionals, and even regulators and business partners to communicate more effectively about information.
Justifying and Proving the Benefits of Information-Related Initiatives
Various leading and trailing indicators, forecasting methods, and value determinations of IAM activities can and should be supported by a range of metrics. Whether it’s determining ROI or simply connecting the dots between information characteristics and business outcomes, quantifying information’s quality and valuation are critical.
Improving Information Security
Several years ago, I spoke with Carsten Casper, Gartner’s managing vice president of digital workplace security, about how organizations budget for data security if they don’t know the value of what they’re securing. He suggested that most employ one of two methods, either: 1) the “Keep up with the Joneses” method of spending what other organizations like their own do, or 2) waiting until some kind of catastrophic event like a breach, then spending enough to make sure that this or something like it doesn’t happen again. I refer to this latter method as “blunderfunding.”5
As covered in chapter 9, knowing the value of what you’re securing—along with the risks and expenses of various kinds of data security events—seems to be the only reasonable method for data security budgeting.
Business-Related Measurement Benefits
Improving Information Monetization
Few of the information monetization stories highlighted in the earlier chapters would have gone beyond prototype or pilot stage without the ability to measure their benefits—not just the outcomes, but how those outcomes were linked to particular information assets. These stories beget other stories. In other words, the publicized success of one information monetization initiative can lead to a dozen others within the organization. Moreover, they illustrate to business people throughout the organization the latent value in dormant or underutilized information assets.
Sometimes just the mere act of putting a cost or market value on an information asset leads to the realization that it can and should be monetized in a variety of ways, such as those shown in chapter 4. If acquiring and administering an information asset has a measurable expense, shouldn’t you be recouping it, at least? And if an information asset has an identifiable market value, shouldn’t you be realizing that value somehow? Performing these kinds of calculations can induce information monetization efforts.
Understanding Corporate Value
Senior executives, boards of directors, and investors have an incomplete picture of a company’s value today, with only a summation of the company’s reportable assets and its speculative market value (if the company is public). Regardless of what GAAP and IFRS regulations dictate, why shouldn’t company execs also have a more complete valuation of all assets? How else can a CFO align corporate strategy and budgets without knowing the contribution of information assets to business performance? Perhaps this is why some CDOs even report to their company’s CFO.
Growing Market Valuations
As highlighted in chapter 11, investors seem to reward companies with infosavvy behaviors by a factor of 2:1. Also, a recent study indicated that nearly half of equity analysts consider a company’s information along with its analytics capabilities in valuing the business as a whole.6 If those who are valuing your business are paying attention to the value of information, why isn’t your CFO? And as we saw again and again in part I, organizations that identify and plan alternative ways to leverage existing information assets are inherently growing their own market value.
Making an Impression on Investors
Moreover, what about potential merger and acquisition (M&A) situations? There’s evidence from IP advisory firms to suggest that companies internally valuing their information assets, even though they are non-auditable per accounting regulations, are rewarded by potential suitors.7 Conversely, a failure to internally account for the value of one’s information assets can prove detrimental, as in the case of Caesar’s Entertainment that has been sued by investors for surreptitiously shifting customer loyalty information among its corporate entities.8
Measuring the Value of Information
As we start to express various approaches for measuring information’s quality, impact, relevance, cost, and value, it’s important to keep in mind the sage words of the celebrated statistician Dr. George Box: “All models are wrong; some models are useful.”9 Models are meant to approximate reality using available inputs and accessible formulae; they are not a substitute for reality itself. The models presented here have been proven useful by a number of organizations in driving data governance and data quality initiatives, priori-tizing other information asset management initiatives, justifying analytics initiatives, and spurring information-led innovation.
Assessing Data Quality
As information becomes a more critical asset to organizations in driving both performance and transformation, its quality characteristics must become a paramount concern to business and IT leaders. Poor data quality can have grave consequences, from strategic decisions that can lead to the death of a business to operational decisions that can lead to the death of individuals. Typically, poor data quality characteristics have a detrimental effect on business performance, innovation, and competitiveness.
A business with annual revenue of around $5 billion loses $2.1 million per year as a result of poor decisions made on the back of bad quality data, and 40 percent of all failed business initiatives are a result of poor data quality.10
Data quality consultant Martin Spratt assessed that 23 percent of the workforce at a major Australian bank cannot perform their primary job adequately because of bad data, and that 13 percent of the workforce at an energy retailer and 24 percent at a health insurance provider suffer the same problem. Some business people are taking up to 30 hours per week to deal with data quality issues, in some cases leading to hundreds of millions of dollars of previously unmeasured “commercial damage,” Spratt said. The larger concern is that “IT people don’t want to hear it because it makes them look bad, and besides, they’re not compensated on good data the way others around the company are compensated on the quality of the assets they produce or manage.” Spratt demonstrated he can even predict employee attrition based on a company’s level of data quality, and believes that impaired information assets should be a CFO write-down.11 Particularly in the realm of Big Data and orders of magnitude increases in volume, velocity, and variety of information, these issues and their economic impact are greatly amplified.
Organizations that take seriously the notion of information as a corporate asset should engage in the same quality assessment discipline as with their traditional physical and financial assets. Just as other assets are periodically inventoried or audited, information assets should be appraised periodically for improvements or degradation. To gauge and improve any measure of information’s value, various characteristics should be assessed periodically as part of data governance programs and by data stewards.
Gartner data quality expert Ted Friedman has identified a dozen data quality (DQ) indicators, including both objective and subjective dimensions. Subsequently, Friedman and I devised the following basic means to quantitatively evaluate each dimension. Note that some measures require a degree of manual checking while others may be automated or even extended using a data profiling tool or custom queries. In general, we also recommend statistical sampling for expedience and performance for quantification purposes. Additionally, while these dimensions apply as equally to unstructured data as they do to structured data, DQ measurements against unstructured data tend to require greater subjectivity, advanced profiling techniques, and/or alternative metrics.12
Objective Data Quality Metrics
- Validity: how well non-missing data accurately represents reality, irrespective of precision or format. For most structured data, use a binary (0,1) value, but for unstructured or more subjective content, consider degrees of partial accuracy.
- Completeness: the percentage of instances of data you have recorded versus the total available (that is, within your business ecosystem or market), and/or the percentage of missing fields in a record.
- Integrity: the existence and correctness of linkages to and from a record, and often the legitimacy of relationships among attribute values within a record.
- Consistency: the number of different forms, formats, and/or structures data takes when stored in multiple datasets or records.
- Uniqueness: the percentage of alternate or duplicative forms of the data instance that exist. Identifying alternates forms of a field requires subject-matter expertise to proactively search for them (for example, “CompanyName” versus “CompanyName Inc.” versus “CompanyName Incorporated” versus “CNI”).
- Precision: the degree of exactitude of a value (or the level of detail for unstructured data). While the value may be completely accurate, its applicability for some business processes may be suboptimal because of its lack of precision.
- Timeliness: the probability that a local data record reflects its original source at any given time. Often online transaction processing data is perfectly fresh, whereas data warehouse data is updated periodically (that is, it has “periodicity”). While the tendency may be to gauge timeliness solely in “clock time,” it is more important from a business perspective to gauge the confidence that the existing local data is in sync with its original source.
- Accessibility: the estimated number of business processes or personnel that can benefit from the data and that are able to retrieve it.
Subjective Data Quality Metrics
- Existence: the degree to which business events, objects, and ideas of importance to the business are represented in corporate information assets.
- Scarcity: the probability that other organizations (particularly competitors and partners) also have the same data. Scarcer data is likely to have greater relative business benefit than data that is commonplace among business partners and competitors. Like relevancy, scarcity is not a direct quality dimension, but is representative of intrinsic data value.
- Relevancy: the number of business processes that use, or could benefit from, this type of data. Higher relevancy is a handy indicator of relative business usefulness. Relevancy isn’t necessarily a quality factor per se, but is included because it is reflective of the data’s cost-to-benefit ratio.
- Usability: the degree to which data is helpful in performing a business function and can only be measured via user surveys.*
- Interpretability: the degree to which data has a unique meaning and is easy to understand, which can only be measured via user surveys.*
- Believability: the degree to which the data is trusted, and can only be measured via user surveys.*
- Objectivity: the degree to which the source of the data is believed to be impartial, which can only be measured via user surveys.13
Information Asset Valuation Models
To assist organizations in putting infonomics principles into practice, my collaboration with valuation experts, accountants, economists, and clients over the years has resulted in a variety of methods to compute the value of an information asset. These include both fundamental and fi nancial valuation approaches.
The fundamental models consider the quality-related aspect of information or its impact on alternate performance indicators. The financial models measure value in monetary terms by adapting accepted methods for valuing traditional assets. When adopting financial models, it is wise to solicit the support and involvement of your CFO.
Some of these methods adapt acknowledged approaches for asset valuation, although none has been accepted or endorsed as yet by any accounting standards body. For now, the models are exclusively for the internal use of organizations in gauging and comparing the value of their information assets.
While the discrete, point-in-time valuations generated are certainly useful, they may not be as meaningful as:
- Understanding the gaps between the realized, probable, and potential value of an information asset,
- Tracking the improvement or impairment of the value of an information asset over time, or
- Juxtaposing or combining metrics for more meaningful or implementable insights.
All asset valuation-related methods such as internal rate of return (IRR) or economic value added (EVA), along with all accounting methods for any kind of asset, are based on a set of assumptions. It is important that assumptions are properly described and consistently applied.
The models generally work best when treating a class of information (for example, customer data, product data, maintenance data, call center data, or employee data) as a portfolio of information. While it may be easier to apply these models to specific datasets, you will likely find more benefit in applying them to logical groupings (portfolios) of related information assets.
Finally, we offer multiple models for various needs and circumstances (Figure 11.1). Selecting which to use and when to use them depends on your objectives. Some are leading indicators, while others are trailing indicators and some can be used as either. The fundamental models are oriented toward improving IAM, while the financial models are more for assessing an information asset’s business benefits. You may find that it makes sense to apply several models for the benefit of different IT, information, fi nancial, and business leaders—or for different kinds of information assets. Later, I’ll share how some organizations are using them in combination.

Figure 11.1
Gartner Information Asset Valuation Models
Fundamental Valuation Models
The following fundamental valuation models are for organizations or departments that are not yet ready or have no pressing need to ascribe a monetary value to their information assets. These models are useful for assessing an information asset’s quality and potential-versus-actual utility to help in improving IAM efforts. They may also be useful as leading indicators of an information asset’s potential economic benefit.14
Intrinsic Value of Information (IVI)
Overview
The intrinsic value of information is its presumptive benefit that enables broad comparisons across information classes regardless of how the information may currently be being used. This method gauges how correct and complete the information asset is and how likely other organizations are to have it. The suggestion is that higher quality and available information that is more proprietary or exclusive has greater intrinsic value potential. This method can be useful to prioritize information-related investments among differing information sources or initiatives. For example, the intrinsic value of information (IVI) is particularly useful to guide data quality or security-related efforts and investments.
Formula
The IVI is a function of:
- Validity. Percentage of records deemed to be correct.
- Completeness. Percentage of total records versus the universe of potential or supposed records.
- Scarcity. Percentage of your market or competitors that also likely have this same data.
- Lifecycle. The reasonable usable length of utility for any given unit (record) of the information asset (e.g., in months).
IVI = Validity *Completeness*(1-Scarcity)*Lifecycle
Implementation
This model is ideally suited for use by data stewards to compare the potential utility of multiple types of information, or for tracking the improved (or degraded) potential of particular information assets over time. The optimal IVI is a 1.0 (specifically, perfect data accuracy and completeness with no copies or versions of any part of this data available outside the organization). For information with a high IVI, you may want to increase or ensure its broad availability and use. For information with a low IVI, you may want to redouble information governance and quality efforts (see above for ways to measure these and other data quality attributes).
Benefits and Challenges
The IVI is the simplest of the information valuation models to use. The data quality factors can be determined via automatic profiling and a basic market understanding. It can help quickly compare the potential of different information assets, identify data quality, data privacy, or information governance issues, or identify data that perhaps shouldn’t be retained. However, the IVI does not consider relevancy of data (actual or potential) for any particular business purpose.
Business Value of Information (BVI)
Overview
This method considers the utility of an information asset to actual business usage (unlike the previous IVI method). It addresses how good the information is, how applicable it is to the business, and how up-to-date the information is. This method is handy to get a quick take on information’s potential real-world benefit. For example, when there are competing business priorities, this model can be used to align information-related priorities with them.
Formula
The BVI is a function of:
- Relevance. How useful the information could be (or is) to one or more business processes (0 to 1).
- Validity. Percentage of records deemed to be correct.
- Completeness. Percentage of total records versus the universe of potential or supposed records.
- Timeliness. How quickly new or updated instances of the data are captured and available to be accessed.
Where p = the number of business processes or functions.
Implementation
To implement this method, it is handy to have a general breakdown of business functions throughout the organization. This can be as high level or detailed as you consider practicable. Measuring the gap between information’s actual value versus its potential value (specifically, using actual versus potential relevance estimates) can quickly identify opportunities for better utilizing your dark data.
Benefits and Challenges
The BVI relates data to actual business value. It is relatively simple to implement and can consider actual versus potential scenarios. This model is useful to identify “dark data” and make “defensible disposal” decisions. However, business relevance can be highly subjective and may demand a time-consuming functional analysis to determine.
Performance Value of Information (PVI)
Overview
This approach looks at the realized (or estimated) impact of an information asset on a business objective that is represented as key performance indicators (KPIs). This answers the question: How much does having this information improve business performance? In short, it requires running a controlled experiment (or conjecturing one), but this method results in a definitive, empirical value measure.
As a trailing indicator of information value, this method may be less useful than the IVI or BVI models for prioritizing information-related initiatives or determining potential information value. However, it is a preferred approach for measuring realized business benefits against established business metrics and as a leading indicator of information asset’s financial value.
Formula
The PVI is a simple ratio that calculates KPI improvement by incorporating a given information asset, extrapolated over the usable life span of any given instance of data:
(Or for multiple KPIs, the overall PVI can be expressed as the mean of their individual PVIs.)
- KPIi = Business process instances using the information asset (informed group).
- KPIc = Business process instances not using the information (control group).
- T = The average usable life span of any data instance.
- t = The duration over which the KPI was measured.
Implementation
Using the PVI model ideally requires running a controlled experiment in which certain instances of a business process incorporate a certain information asset that other instances do not. It is a classic A-B test. A positive PVI demonstrates that the data is valuable for this process; a negative PVI indicates that the additional data somehow impedes the process. In determining the PVI, it is important to keep all other aspects of the revenue process constant during the trial.
Benefits and Challenges
The PVI yields hard, empirical measurements that are an excellent predictor or proxy for financial measures. It introduces a real-world scenario without the need for business-function level analysis. However, the PVI requires running one or more experiments, potentially involving system or process changes. The way in which data is integrated into the process affects the outcome, and this model does not take into consideration the expense of incorporating the data into a process.
Financial Valuation Models
A financial information valuation model is useful to organizations that need to determine how information assets perform compared to other assets; what to invest in their collection, management, security, and deployment; and how to express their value when used in business transactions (for example, merger and acquisitions, data syndication, information bartering). These economic models are variants on established asset valuation models that are used by valuation experts and accountants to value traditional assets. However, these models have been adapted to accommodate one of the nuances of information’s unique characteristics including that they are non-depletable, non-rivalrous, and more licensable than salable.
Cost Value of Information (CVI)
Overview
This method simply assesses an information asset as the financial expense required to generate, capture, or collect it. An optional term that considers the impact to the business if this information asset were rendered unavailable (for example, damaged, lost) or stolen (specifically, copied) is also included. This method is preferred when there is no active market for the information asset and its contribution to revenue cannot be determined adequately. Additionally, this model can be used to assess the potential financial risk of an information asset’s damage, loss, or theft.
Formula
Where:
- ProcExp = The annualized cost of the process(es) involved in capturing the data.
- Attrib = The portion (percent) of process expense attributable to capturing the data.
- T = Average life span of any given instance of data.
- t = Time period over which the process expense is measured.
- n = The number of periods of time until the information is reacquired, or until business continuity is no longer affected by the lost or damaged information.
Implementation
The process expense and portion attributable to information capture can be tricky to ascertain, given that it may be collected in the course of business operations, in which case it is normally expensed. If the portion of the process allocated to the acquisition of that information asset were determinate, this amount ostensibly could be claimed as an asset value instead of being expensed (current accounting regulations notwithstanding). The cost of reputational or competitive risks should also be considered, should this information be exposed publicly or stolen by competitors.
Benefits and Challenges
The CVI is the best means of estimating information replacement cost and negative business impact if lost, stolen, or damaged. Accountants prefer this method as a more conservative and less volatile approach for initially valuing most intangible assets. However, some factors require estimation and subjectivity. Remember that these costs most likely are expensed already, so the CVI merely expresses the value of information in terms of shifting it from an expense to an asset.
Market Value of Information (MVI)
Overview
This method looks at the potential or actual financial value of an information asset in an open marketplace. Typically, data monetization is transacted among trading partners in return for cash, goods, or services, or other considerations such as preferential contract terms and conditions. Yet, increasingly, companies are selling their data outright via hosted data marketplaces (for example, ProgrammableWeb, Quandl, Qlik Data Marketplace, Data Republic) or industry-specific information brokers.
This market value method, generally, is not applicable for most types of information unless they are licensed or bartered. However, as organizations become more sophisticated and aggressive at leveraging their information externally, they should consider this approach.
Formula
Our modification of this traditional method recognizes that most information is not actually sold (specifically, ownership transferred); rather, it is licensed. Therefore, we have included a factor for the diminished marketability of information as it becomes more ubiquitous to the marketplace. This is represented as a variable discount factor (represented as an inverse premium) applied to a hypothetical ownership transference (exclusive price) of the information asset:
Implementation
Use the MVI when considering monetizing information via sale or barter. Ideally, use the CVI or EVI model to determine the exclusive price—specifically, how much you might demand to transfer complete ownership of (or exclusive rights to) the information asset to another entity (licensee). Then determine or estimate how many probable parties will license this data over the average life span of any given record. Traditional market analyses methods for determining market sizes can also be used to determine the number of likely information licensors. Additional surveys of potential licensors can determine the premium factor, by asking: “What premium (multiple) over any given licensing fee would you pay for exclusive access to or outright ownership of this data?”
Benefits and Challenges
The MVI is most useful for determining the value of a saleable or barterable information asset. It can also be useful for determining the price point for an information product, or it can also be adapted for ensuring acceptable licensing fees for another’s information product. However, this model is not particularly applicable or useful for nonmarketable information assets. It includes highly subjective factors that may require extensive market analysis, such as determining or estimating the exclusive price for an information asset.
Economic Value of Information (EVI)
Overview
This method generates the net financial value of an information asset by applying the traditional income approach for asset valuation, then subtracting the information’s associated lifecycle expenses. Like the PVI, this method empirically calculates the information asset’s actual value. As such, it is more of a trailing indicator than a leading indicator of information value—unless the first revenue term can be estimated adequately.
Formula
The EVI considers the realized change in revenue when a particular information asset is incorporated into one or more revenue generating processes. Then, the cost to acquire, administer, and apply the data is netted out:
Where:
- Revenuei = The revenue generated using the information asset (informed group).
- Revenuec = The revenue generated without the information asset (control group).
- T = The average expected life span of any given information instance or record.
- t = The period of time during which the EVI experiment or trial was executed.
Implementation
As a financial variant of the PVI method above, the EVI requires running a trial over a period of time. However, in this method, revenue is the only KPI, the value is monetary rather than a ratio, and the life span of the information asset is factored in. First, measure the difference between how much income is generated with versus without using the information. Then subtract the lifecycle costs of the information. (Refer to the previous CVI model for guidance on computing lifecycle expenses.) Finally, multiply this sum by the ratio of the information assets life span (T) to the duration of the trial (t). In determining the EVI, it is important to keep all other aspects of the revenue process constant during the trial.
Benefits and Challenges
The EVI is an empirical analysis of the contribution of information to the top and bottom line. There is no need for a functional analysis, other than in establishing information-related expenses when data is duplicated and/or applied in multiple ways. The EVI, however, requires a live experiment and the ability to estimate information supply chain costs. Many traditional business leaders are still uncomfortable with the contemporary concept of experimenting with revenue-producing processes. Also, the EVI is a trailing indicator, although results can be used to prioritize IT and business initiatives.
Other Information Valuation Approaches
These models are by no means the only methods for valuing information that have been posited. Others worthy of consideration as well include:
- Douglas Hubbard’s “applied information economics” methodology strictly for measuring the decision value of information.15
- Bill Schmarzo’s “data economic valuation” approach also strictly for measuring information’s contribution to decision making.16
- Paul Strassman’s macroeconomic method of comparing the competitive gains of organizations with similar tangible assets, after accounting for all other valuation premium factors.17
- Dilip Krishna’s methods for attributing business outcomes to specific information initiatives (Business Impact Model); an adapted discount cash flow model (a Monte Carlo simulation method); and a comparative analysis approach similar to Strassman’s but using a pure-play information company for comparison.18
- Tonie Leatherberry’s and Rena Mears’s “net business value” method that considers information’s present and discounted future value to each department, various risks, and total cost of ownership.19
- Robert Schmidt’s and Jennifer Fisher’s promising but loosely defined and abandoned patent application for an amalgam of information cost, accuracy, and other quality factors, along with information usage/access.20
- Mark Albala’s conceptual valuation model, similar to that of Schmidt and Fischer, in which information value is based on information requests, usage (royalties), and outcomes.21
- Dave McCrory’s concept and formula for what he calls “data gravity” that defines the proximal relationship among data sources and applications.22
As well, software and services companies such as Schedule1, Pimsoft, Everedge, ThreatModeler, Alex Solutions, Datum, Alation, and Real Social Dynamics (RSD) [in collaboration with the Geneva School of Business Administration] have developed exclusive approaches for measuring information value and/or risk in economic terms specific to their core offerings.
Of course, countless papers and books have been written on the value of information from an engineering, communications, and theoretical standpoint, dating back to Claude Shannon’s seminal work on information theory. Even the term “business intelligence” predates any Gartner or IBM paper, having been first used in the 1865 book, “Cyclopaedia of Commercial and Business Anecdotes” in describing the value of information on military battles.23
Understanding and Closing Information Value Gaps
Enterprises repeatedly fall into the trap of getting diminishing returns from buying and applying more complex and leading-edge IT to the same narrow sets of data, rather than doing simpler things with the data that has the highest value gap. It’s like a farmer who buys new equipment, hires more workers, and drenches a certain crop with fertilizer and water when other crops have greater growth and profitability potential.
Determining the value of any information asset using the cost approach (CVI) can offer a baseline, nominal, and conservative value of the information, regardless of how it is or could be used. Note that the CVI is consistent with the way that accountants prefer for initially valuing most intangibles. Your goal then should be to determine ways to generate a market value (MVI) or income value (EVI) for the information asset that’s greater than its CVI.
Since the late 1980s, accountants have allowed for the value of an asset to be recorded as representing its “probable future economic benefits.” This means that a currently unutilized asset may have a formal measurable value. It also means that any asset has three degrees of value:
- A realized value based on the economic benefits it is currently delivering,
- A probable value based on its intended uses, and
- A mostly theoretical potential value if it were to be optimally applied.
The implication for information assets is that even dark data (that is, unutilized or underutilized data) has both probable and potential value. So people who suggest that information (or any asset) has value only when consumed are somewhat mistaken—although their intentions may be good.
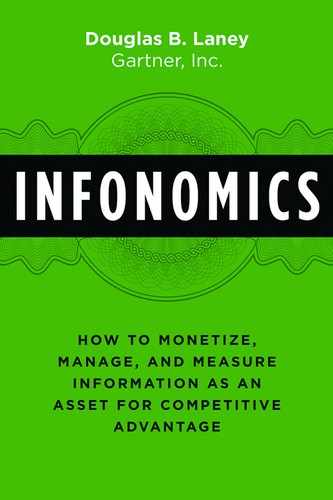
These three degrees of value (Figure 11.2) also give us a way to apply the Gartner Information Value Models to identify value gaps: the information performance gap and the information vision gap:
- Information Performance Gap—The difference between the realized value of an information asset and its probable value.
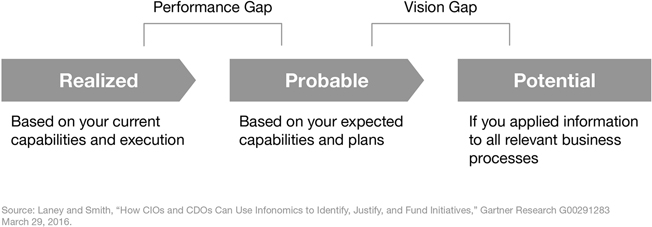
Figure 11.2
Information Value Gaps
This gap shows how information will likely deliver benefits. For example, maintenance data may be used currently to identify failing components and reduce their downtime, but systems being developed are not yet in place to predict failures. Both the MVI and EVI models can be used as actual and projected approaches to estimate the performance gap. After measuring this gap, your objective should be to accelerate its closure and increase the probability that the information actually will be applied in intended ways.
- Information Vision Gap—The difference between the probable and potential information valuations.
This gap appraises how much (or little) vision the organization has concerning how its data is leveraged. For example, even after predictive maintenance systems are put in place, there are identified opportunities to license this data to component suppliers in return for favorable pricing, plus a range of other potential ways to leverage the data. This gap is usually much larger than the performance gap, but also a bit more speculative. So how can you possibly identify all the ways an information asset could possibly be used? One answer is to identify the actual versus potential business relevance (BVI) of information assets and then conduct information innovation exercises (see the following section) that focus on those with the largest gaps. And with previously unidentified potential uses of an information asset now in mind, you may choose to plan to implement them, thereby increasing the information asset’s probable value and, in turn, your own organization’s market value.
Applying the Information Valuation Models in Combination
As I mentioned earlier, these information valuation models may have greater utility in combination than as standalone methods. Some organizations already are leveraging the models in creative ways I had not envisioned. Additionally, most organizations (with my encouragement) modify the parameters of one or more models to suit particular needs. Some of these uses include:
Prioritizing IAM Investments
Several companies including an international retailer and a major manufacturer24 have identified information assets with low data quality metrics but high business relevancy to help them focus their information asset management (IAM) activities and resources. To do this, they used using variations on the intrinsic (IVI) and business (BVI) models (Figure 11.3).
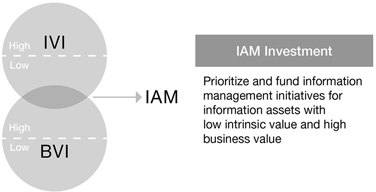
Figure 11.3
Using Information Valuations to Prioritize Information Asset Management Investments
Proving the Benefits of Information Governance
Other organizations including a federal agency are gauging the causal relationship between improvements in data quality and business outcomes. This helps them demonstrate, and thereby fund, the benefits of the information governance initiatives behind improved data quality. A global financial services company is using a similar approach to gauge and improve the utilization of its data lake. With IVI-like data quality metrics available to users alongside the information assets themselves, the trust and usage of the data lake can be determined (Figure 11.4).
Figure 11.4
Using Information Valuations to Justify and Prove Information Governance Efforts
Innovation and Digitalization
One of the most clever ways of leveraging the valuation models has been developed and deployed by the information strategy consultancy, Cicero Group.25 Consulting to a major security systems company, Cicero helped it identify information assets with high business potential that currently were generating little significant economic value (Figure 11.5)—remember that the BVI model can be used to identify the realized or potential business relevancy of an information asset. Then Cicero helped its client devise over twenty IT and business initiatives to better leverage those underutilized information assets. As a result the client claims it has added $300 million in market value (over a 15 percent increase).26
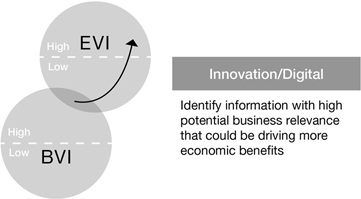
Figure 11.5
Using Information Valuations to Spur Innovation and Digitalization
Monetization and Analytics

Figure 11.6
Using Information Valuations to Identify Monetization and Analytics Opportunities
Working with a few software-as-a-service (SaaS) clients, a prominent online retailer, and other companies looking to determine which information assets are most ripe for external monetization, we have concocted a basic approach to mixing three of the models (Figure 11.6). It involves identifying information assets with a low cost to harvest, generate, or otherwise obtain, along with those that have high data quality and high business relevancy (to potential licensees). A similar approach has been presented to several data brokers as to how they should be thinking about repackaging and introducing new information products and services.
Expanded Revenue
Some companies are just starting to toe the water with monetizing their information assets externally. To help them build a business case for doing so, I have recommended looking at how the external market value of certain information assets of theirs could expand the economic value they’re already delivering internally (Figure 11.7)—and how large that unrealized value gap is. This approach helps these companies look at ways to license their data, barter with it for favorable terms and conditions or discounts, attract partners, or any of the various monetization methods we covered earlier in the book. For example, one country’s national archives has entered into a partnership to monetize its artifacts by digitizing them. Which ones to digitize and how to price them were based on their expected market value.27
Another example of this approach in action is the work the IP consultancy Everedge mentioned earlier did with a business that was looking to get acquired. The client thought its most valuable assets were on the balance sheet. But instead of targeting buyers for the business (for which the client expected a 2x book value valuation), Everedge found buyers for its information assets, yielding a 32x EBITDA (earnings before interest, tax, depreciation, and amortization) deal size.28
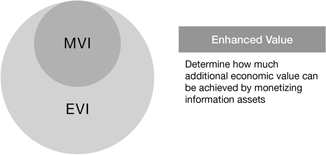
Figure 11.7
Using Information Valuations to Drive Expanded Economic Benefits and Revenue
Reduce Information Lifecycle Expense
Remember in chapter 6 the discussion of the five (or six) “Rs” of sustainability? One company, MISO Energy, has put these models to work to reduce unnecessary information assets. MISO’s Principal Data Architect, Ruchi Rajesekhar, first scoped the analysis to certain information assets with low business relevancy (BVI), then computed the difference between their economic value (actually in this case, the loss to the business without them) and their retention cost (acquisition + human capital + infrastructure). In doing so, MISO was able to defensibly dispose of certain information assets with a negative net value, thereby saving the company $1.1 million annually (Figure 11.8).

Figure 11.8
Using Information Valuations to Reduce Infrastructure-Related Expenses
Architecting for Information Value
Even practicable—if not perfect—models for measuring information’s value in various ways cannot convey enough about information’s behavior as an asset. Quantifying an information asset’s potential or probable or actual value provides us useful indicators to prove or justify ways to improve how we manage and monetize it. But such models fall short of telling us how information behaves or how we can bend its behavior to our benefit. For this we must turn to the field of economics. Although designed for traditional goods and services and human behavior, economic principles and models can be applied to information assets as well—with some tweaking.
In the next chapter, we’ll examine how certain economic concepts can provide guidance to CDOs and other information leaders, along with business, enterprise, and application architects, by substituting the concept of information assets into established economic models.
Notes
1 At the time I was an analyst with META Group, subsequently acquired by Gartner.
2 www.irmi.com/articles/expert-commentary/the-2001-iso-cgl-revision.
3 Sometimes called the Observer Effect, not to be confused with the quantum theory effect of the same name which itself is often confused with the Heisenberg Principle.
4 R. McCarney, J. Warner, S. Iliffe, R. van Haselen, M. Griffin, and P. Fisher, “The Hawthorne Effect: A Randomised, Controlled Trial,” BMC Med Res Methodol, Volume 7, 2007, p. 30. doi:10.1186/1471-2288-7-30.
5 Doug Laney, “Blunderfunding: How Organizations Use Failure as a Basis for Budgeting,” Doug Laney, 18 January 2012, http://blogs.gartner.com/doug-laney/blunderfunding-how-organizations-use-failure-as-a-basis-for-budgeting/.
6 “Data and Analytics: A New Driver of Performance and Valuation,” Institutional Investor Research and KPMG, June 2015, p. 6.
7 Paul Adams, interview with author, 17 December 2016.
8 Kate O’Keeffe, “Real Prize in Caesars Fight: Data on Players,” The Wall Street Journal, 19 March 2015, accessed 09 February 2017, www.wsj.com/articles/in-caesars-fight-data-on-players-is-real-prize-1426800166.
9 George E. P. Box, William Hunter, and Stuart Hunter, Statistics for Experimenters, second edition (2005), p. 440.
10 Ted Friedman, and Michael Smith, “Measuring the Business Value of Data Quality,” Gartner, 07 October 2015, www.gartner.com/document/code/218962.
11 Martin Spratt, interview with author, 08 September 2016.
12 The toolkit Ted Friedman and I published includes the actual formulas and examples for calculating each dimension (ref: “Toolkit: Assessing Key Data Quality Dimensions,” Douglas Laney and Ted Friedman, Gartner, 21 September 2012, www.gartner.com/document/2171520).
13 For user surveys of subjective factors use a 1–5 Likert scale for responses (for example: 1—Strongly disagree, 2—Disagree, 3—Neither agree nor disagree, 4—Agree, 5—Strongly agree).
14 For further guidance on implementing these models, including variants and examples, refer to “Why and How to Measure the Value of Your Information Assets” or this book’s accompanying website.
15 Douglas W. Hubbard, How to Measure Anything: Finding the Value of “Intangibles” in Business (Hoboken, NJ: John Wiley & Sons, 2007).
16 Bill Schmarzo, “Determining the Economic Value of Data—InFocus Blog | Dell EMC Services,” InFocus Blog | Dell EMC Services, 11 July 2016, https://infocus.emc.com/william_schmarzo/determining-economic-value-data/.
17 Paul Strassman, “The Value Of Computers, Information and Knowledge,” 30 January 1996, www.strassmann.com/pubs/cik/cik-value.shtml#RTFToC8.
18 Dilip Krishna, “Inf. Valuation (1)—Valuing an Organizations Information…,” Course Hero, accessed 09 February 2017, www.coursehero.com/file/8383468/inf-valuation-1/.
19 The Fourth MIT Information Quality Industry Symposium, 14–16 July 2010. Data as an Asset: Balancing the Data Ecosystem.
20 Robert Schmidt et al., “Valuation of Data,” U.S. Patent Application No. 13/316055, 09 December 2011.
21 Marc Albala, “Recognition of Information Value,” SlideShare, 15 November 2016, www.slideshare.net/mcalbala/recognition-of-information-value.
22 “Business Intelligence” coined by Frazar Kirland in 1865, p. 210. Published by D. Appleton and Co, New York, NY.
23 Richard Seroter, “Dave McCrory Unveils Initial Formula for Principle of Data Gravity,” InfoQ, 29 June 2012, www.infoq.com/news/2012/06/datagravity-formula.
24 Assisted by Gartner Consulting.
25 Cicero Group is also the first known consultancy to have a formal infonomics practice, although others including Gartner Consulting offer similar services.
26 Client project documentation provided under non-disclosure, 2015.
27 A Gartner Consulting project.
28 Paul Adams, interview with author, 17 December 2016.