Chapter 4: Applying Numeric Parameters
Introduction
In addition to enabling you to create reports quickly and easily, SAS Visual Analytics also provides a great deal of flexibility to the report designer and the report viewer. One example of this flexibility is the ability to create and use parameters. Parameters are a special type of data item that can be created by the designer and modified by the viewer. They are like macro variables in that they are changeable and they are not tied to any specific data set. In fact, the set of acceptable values for the parameter can come from one data set and the selected value can be used in another data set.
Typically, you will add parameters to your report to give your report viewers more control over what they see. For example, you can create parameters that enable the viewer to select a value that updates a chart. This update can be in the form of a display rule that highlights values below the specified value, a filter that displays job descriptions that contain a specified string, or a rank that shows the specified number of top customers. In addition, you can create parameters that enable the viewer to specify how a data item is calculated. This calculation can be a grouping of values based on the value the viewer specifies, a specific region to display in a geo map, or a more complex calculation, like the order of a rank or a month to use for comparing values. In the next three chapters, you learn how to create different types of parameters: numeric, character, and date. You’ll notice in each of these examples that parameters are required to give the report viewer more control over the data displayed in the report.
When working with parameters, it’s best to build the report using hardcoded values and then modify the report to use parameters. To implement parameters, follow four simple steps:
- Create the parameter.
- Add an object so that the viewer can populate (or change the value of) the parameter.
- Apply the parameter to an object.
- Test the parameter.
Before you begin these steps, however, you need to know which type of parameter is needed for your scenario: numeric, character, or date. The easiest way to determine which type to create is to think about what report viewers need to enter for the scenario. For example, if you want them to enter a number (for example, to choose the number of years or to view a specific number of top customers), then you need to create a numeric parameter. If you want them to select or enter a value (for example, select a metric or region or enter a string to search a list of qualifications for job openings), then you need to create a character parameter. If you want them to select or enter a date (for example, highlight a selected month or display data within a range of dates), then you need to create a date parameter. The next three chapters discuss creating each type of parameter.
Step 1: Create
When using parameters in a report, the first step is to create the parameter in the Data pane. For numeric parameters, discussed in this chapter, you need to specify a minimum value, a maximum value, a format, and a current value.
Step 2: Populate
Once the parameter has been created, you need to add a control object to the canvas so that the report viewer can modify the value of the parameter. The type of control object that you add depends on your scenario and the type of parameter you created. For numeric parameters, you can add a slider control or a text input control to modify the value of the parameter. A text input control enables the viewer to enter a number directly, but that number could possibly fall outside the acceptable range., A slider control enables the viewer to see the range and select a value within it.
Step 3: Apply
When the viewer modifies the value of the parameter, you want something in the report to change. Parameters can be used in a calculation, a display rule, a filter (like detail filters, aggregated filters, and data source filters), or a rank to modify the report. Parameters can also be used in URLs (see Chapter 3) and in text objects (see Example: Viewing Data for the Next N Years).
Step 4: Test
Once the parameter has been applied, you need to ensure that it works by testing it in the report.
Example: Highlighting Values below a Threshold
In this example, the report displays the average customer satisfaction for each product style. A hierarchy (created from Product Brand, Product Line, and Product Make) has been added to the page prompt area to create cascading prompts, or prompts that filter values in a specific order. In this case, a user can select a product brand from the button bar to filter the list of product lines and product makes available and select a product line from the drop-down list control to filter the list of product makes available. All page prompts filter the bar chart that shows average customer satisfaction by product style.
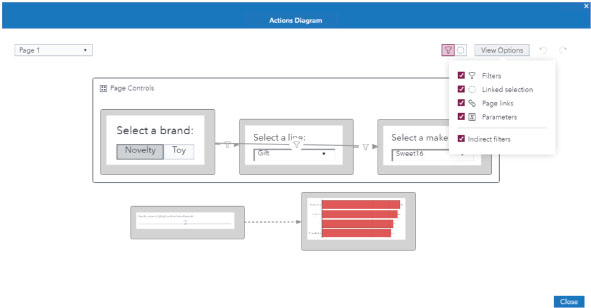
In the Actions pane, you can view the Actions diagram to see the actions defined between the page prompts. (See Figure 4.1.) These actions were added automatically when a hierarchy was added to the page prompt area.
Figure 4.1: Viewing Actions between Cascading Prompts

To start, test the actions by selecting Novelty as the product brand, Gift as the product line, and Sweet 16 as the product make. The bar chart includes a display rule that highlights all product styles with a customer satisfaction less than 45% in dark red. (See Figure 4.2.)
Figure 4.2: Displaying Customer Satisfaction by Product Style

For this scenario, you want to add a parameter so that the viewer can choose the minimum threshold for the display rule (instead of the hardcoded 45%).
Step 1: Create
Because you want the viewer to choose a minimum threshold for customer satisfaction (in percent), you need to create a numeric parameter.
To create the parameter, do the following:
1 In the Data pane, click New data item and select Parameter. (See Figure 4.3.)
2 Specify a name for the parameter. It’s a best practice to give parameters a name that indicates how they will be used.
3 Verify that Numeric is specified for the Type field.
4 Enter a minimum value. In this example, customer satisfaction is displayed as a percentage. The acceptable range of percentages is between 0% and 100%. However, values must be entered in their decimal form (between 0 and 1).
5 Enter a maximum value.
6 Specify a format that will be used to display the values in the control.
7 Enter a current value. If you enter a value that is different from the hardcoded value (in this case, 0.45), you can see exactly when the parameter is applied.
Figure 4.3: Creating a Numeric Parameter

Step 2: Populate
Now that the parameter has been created, you need to add a control object to enable the viewer to populate (or modify the value) of the parameter. Because you want the viewer to see the range of acceptable values and choose an appropriate value in the range, add a slider control to the canvas above the bar chart. In the Roles pane, select Display Rule Parameter for the Parameter role. In the Options pane, add an appropriate name and title. It’s a best practice to add a name that describes how the control will be used (for example, Display Rule Selector) and a title that includes instructions for how to use the control (for example, Specify a value to highlight products below threshold).
Step 3: Apply
Next, you need to apply the parameter to the report in some way. In this example, we want the display rule applied to the bar chart to update based on the value selected in the slider control.
To modify the display rule:
1 Select the bar chart on the canvas. (See Figure 4.4.) This is the object on which the display rule is defined.
2 In the Rules pane, edit the Customer Satisfaction display rule.
3 Select Display Rule Parameter for the Value field.
Figure 4.4: Modifying the Display Rule

After the parameter has been applied, the Actions diagram shows how the parameter is used in the report. By default, the diagram displays filter actions, linked selection actions, page links (added from the Actions pane), parameters, and indirect filters. Parameters and indirect filters are displayed as a dashed line in the diagram. (See Figure 4.5.)
Figure 4.5: Viewing Parameter and Indirect Filter Actions
Step 4: Test
View the report to test the parameter. For example, in the page prompt, select the Toy product brand, the Figurine product line, and the Super Hero product make. Then select 55% (or .55) as the value of the parameter. All super hero products with a customer satisfaction less than 55% are highlighted in red. (See Figure 4.6.)
Figure 4.6: Viewing Products with a Customer Satisfaction Less than 55%

Example: Displaying Countries with Orders above a Minimum
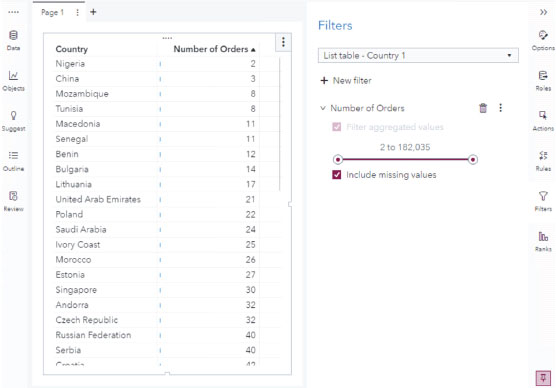
In this example, the report displays details about the number of orders by country. The list table contains a bar cell visualization to make it easy to visually compare the number of orders between countries. A post-aggregate filter has been added to the list table, but no countries are currently being filtered out. (See Figure 4.7.)
Figure 4.7: Viewing Number of Orders by Country
You want to add a parameter so that the viewer can specify a minimum number of orders and see only countries with orders greater than or equal to that value.
Step 1: Create
Because you want the viewer to specify a minimum number of orders, you need to create a numeric parameter. Before you can do this, you need to know the range of Number of Orders, an aggregated measure. Remember, aggregated measures are evaluated after they are paired with other data items (in this case, Country). When you filter on an aggregated measure, a post-aggregate filter is automatically created. The slider for the post-aggregate filter displays the range of values for this object: 2 to 182,035.
Now that you know the range, you can create the parameter, Post-Aggregate Filter Parameter. The parameter should be a numeric parameter with a minimum value of 0, a maximum value of 182,000, a format of COMMA12., and a current value of 10,000.
Step 2: Populate
Next add a control object to the canvas to populate the parameter. A text input control can be used so that the viewer can directly enter a value. In this case, the viewer can enter any number, even numbers that fall outside the minimum and maximum values specified for the parameter. If the viewer enters a number outside the range, an error is displayed. When you use text input controls to populate numeric parameters, it’s a best practice to add the range of possible values, along with instructions, as the title. (See Figure 4.8.)
Figure 4.8: Using a Text Input Control to Populate a Numeric Parameter
![]()
Step 3: Apply
Then the parameter needs to be applied to the post-aggregate filter. To modify the filter, do the following:
1 Select the list table on the canvas. (See Figure 4.9.) This is the object that contains the post-aggregate filter.
2 In the Filters pane, view the options menu next to the filter and select Advanced edit.
3 Modify the expression to use the parameter. (See Figure 4.10.)
Figure 4.9: Modifying the Post-Aggregate Filter

Figure 4.10: Filtering Using the Value of a Numeric Parameter

Step 4: Test
Finally, view the report and test the parameter with a value of 75,000. The list table displays only countries with more than 75,000 orders. (See Figure 4.11.)
Figure 4.11: Viewing Countries with More than 75,000 Orders

Example: Showing Top Customers
For this example, a list table displays details (like Customer Country and Customer Type Name) for the top three customers by profit. A heat map cell visualization, totals, and a rank have been added to the list table. (See Figure 4.12.)
Figure 4.12: Viewing Top Three Customers by Profit

The rank shows the top three visible categories by profit. This means that it shows the top three values across the intersection of all categories visible in the list table. For example, a list table that shows customer orders by date is likely to have multiple orders per customer. A rank across all visible categories would show three rows, the top three total orders by date (See Figure 4.13.), whereas a rank for the top three customers would show multiple rows, all orders from the top three customers. (See Figure 4.14.)
Figure 4.13: Ranking Across All Visible Categories

Figure 4.14: Ranking for the Top Three Customers

Another option, Detail rank, is available for objects that show detail data (like list tables, ungrouped bubble plots, and scatter plots). This option displays the top three rows in the entire table when looking at detail data. In this example, two of the top customers (E.J. Muskens and P.J. Van Son) placed multiple orders on the same date. (See Figure 4.15.)
Figure 4.15: Viewing Detail Data for Top Customers

Notice that all orders for E.J. Muskens on 29Dec2014 total $2,151.20 ($14.20 + $7.60 + $2,121.60 + $7.80) and all orders for P.J. Van Son on 06Dec2012 total $2,161.20 ($39.60 + $2,121.60). The Detail rank option displays the maximum order placed on each date. (See Figure 4.16.)
Figure 4.16: Viewing Detail Rank Option

For the list table, a rank for the top three by profit across all visible categories and a rank for the top three customers by profit are identical.
For the report, you want to use parameters so that the viewer can choose how many top customers to display.
Step 1: Create
Because you want the viewer to choose the number of top customers to display, you need to create a numeric parameter (Rank Parameter). For this example, you want the viewer to choose a number somewhere between 1 and 100, and you’ll specify a current value of 6 so that you can tell exactly when the parameter is applied.
Step 2: Populate
Next you add a control object so that the viewer can modify the value of the parameter. A slider control enables the viewer to see the range of acceptable values and choose a value within that range.
Step 3: Apply
Then you need to apply the parameter. In this case, the parameter is used in a rank on the list table. To modify the rank, do the following:
1 Select the list table on the canvas. (See Figure 4.17.) This is the object that contains the rank.
2 In the Ranks pane, select Rank Parameter for the Count field.
Figure 4.17: Modifying the Rank

Step 4: Test
Finally, view the report and test the parameter with a value of 12. The list table displays only the top 12 customers by profit. (See Figure 4.18.)
Figure 4.18: Viewing Top 12 Customers by Profit

Example: Grouping Values Based on a Threshold
In this example, the report displays average honey prices by year for all states within the United States. The data source contains one row for each state and each year, along with a row that represents the average price for the entire US. To plot the state averages on a map by year, a data filter is applied to filter out ‘OTHER STATES’ and ‘US TOTAL’. In addition, the Location field has been converted to a geography data item using US State Names. The report consists of a geo map showing honey price ranges (using a display rule) animated by year. (See Figure 4.19.)
Figure 4.19: Viewing Average Honey Prices by Year

For the display rule, a new character data item (Honey Price Ranges) has been created to group average honey prices into Low or High based on a threshold, currently set to 100 cents/lb. (See Figure 4.20.)
Figure 4.20: Viewing Honey Price Ranges

A display rule based on the data item shows low honey price ranges (below the threshold) as a red bee and high honey price ranges (above the threshold) as a green bee. (See Figure 4.21.) These custom icons were uploaded from local images. It is possible to use a custom icon and select a color for the display rule, but the color is not applied to the custom icon. The icons need to be imported with the appropriate colors already applied.
Figure 4.21: Using Custom Icons for Display Rules

Note: Replacing markers in a geo map with icons is available only in SAS Visual Analytics 8.2 and later.
For the display rule to work, Honey Price Ranges needs to be added to one of the roles for the geo map. Because Honey Price Ranges is a character column, it can be added to either the Data tip values role, the Data labels role, or the Hidden role.
For the report, you want the viewer to specify the threshold for Honey Price Ranges; you can do this with parameters.
Step 1: Create
Because you want the viewer to set the threshold (in cents/lb), you need to create a numeric parameter. Before you can do this, you need to know the range of honey prices. The data set has a data item that contains this information, Price (cents/lb). You can create a parameter from an existing data item by right-clicking the data item and selecting New parameter. The Type, Minimum value, Maximum value, and Format fields are auto-populated using information about the data item. You simply need to modify the Name field (Threshold Parameter) and the Current value field (50).
Step 2: Populate
To populate the parameter, you can use a text input control. Remember that, for text input controls, it is possible for the viewer to enter a value outside the acceptable range. To prevent this from happening, it’s a best practice to add the range, along with instructions, as the title for the object.
Step 3: Apply
Next you apply the parameter to the calculated item, Honey Price Ranges. To modify the calculated item, do the following:
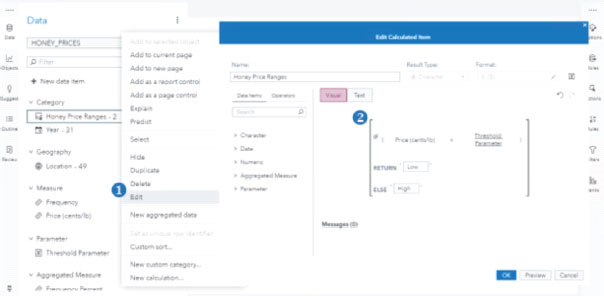
1 In the Data pane, right-click Honey Price Ranges and select Edit. (See Figure 4.22.)
2 Modify the expression to use the parameter, Threshold Parameter.
Figure 4.22: Modifying the Calculated Item
Step 4: Test
After the parameter has been applied, view the report and test the parameter with a value of 300. (See Figure 4.23.) As you play the animation, notice that some states drop out in the 1990s when they stopped producing honey and that, starting in the late 2000s, some states exceed the threshold of 300 cents/lb.
Figure 4.23: Viewing States with Honey Prices over 300 cents/lb in 2005

Example: Viewing Data for the Next N Years
For this example, the report shows the location and type of eclipses for the next five years. A geography data item has been created for Catalog Number (the identification number for each eclipse) using Latitude and Longitude values. A geo map that uses the geography data item has been created to show the location of eclipses. In the map, each eclipse is colored by Type (Annular, Hybrid, Partial, or Total) and data tip values display Date and TD Time (Terrestrial Dynamical) for each eclipse. A text object has also been added as a title for the geo map. Currently, it’s using static text. (See Figure 4.24.)
Figure 4.24: Viewing Eclipses in the Next Five Years

In addition, a data source filter has been added to show only eclipses occurring in the next five years from today’s date, where today is updated each time that the report is viewed. Data source filters restrict data before it is brought into SAS Visual Analytics and the filter is applied to every object that uses the data source. To create a data source filter, do the following:
1 In the Data pane, view the Data source menu and select Apply data filter. (See Figure 4.25.)
2 Using the Visual view, build the expression using data items and operators. As an alternative, you can use the Text view to enter the expression.
Figure 4.25: Creating a Data Source Filter

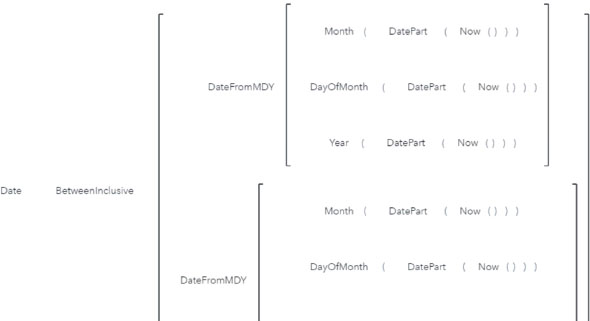
The data source filter uses the Now operator to determine the date and time in which the report is opened (for example, 27Dec2020 1:08 PM). The DatePart operator returns the date portion of that value (for example, 27Dec2020). The Month operator returns the month of the date as a number between 1 and 12, where 1 is January (for example, 12). The DayOfMonth operator returns the day of the month as a number between 1 and 31 (for example, 27). The Year operator returns the year of the date as a four-digit number (for example, 2020). The DateFromMDY operator creates a date value from a month, a day, and a year. For this example, the filter returns only dates that occur between today’s date and five years from today’s date (for example, between 27Dec2020 and 27Dec2025). (See Figure 4.26.)
Figure 4.26: Filtering for the Next Five Years
You want to use parameters so that the viewer can choose how many years to display in the geo map.
Note: This example can also be modified to look at data in the past, like orders from the past five years.
Step 1: Create
Because you want the viewer to enter the number of years, you need to create a numeric parameter (Data Filter Parameter). This data source contains details about solar eclipses from 2020 to the year 3000, so the range of the parameter can be from 1 to 980. However, it’s unlikely that most viewers will want to view more than 100 years into the future, so you can limit the maximum value to 100. To verify the moment when the parameter is applied, enter a current value different from 5 (for example, 50).
Step 2: Populate
For this example, a slider control can be used to display the range of acceptable values and enable the viewer to choose a value within that range.
Step 3: Apply
Next you can modify the data source filter to use the parameter value instead of the hardcoded value. (See Figure 4.27.) Modify the data source filter by viewing the Data source menu and selecting Edit data filter.
Figure 4.27: Using the Parameter in the Data Source Filter

In addition, you can modify the static text to use the value of the parameter. To display the parameter value in the text object, do the following:
1 Double-click the text object on the canvas to edit the text. (See Figure 4.28.)
2 Delete the hardcoded value, 5.
3 In the Roles pane, add Data Filter Parameter to the Parameters role.
Figure 4.28: Displaying the Parameter Value in the Text Object

When the value of the parameter is modified, the text object automatically updates to show the new value. In addition to displaying the value of parameters, the text object can also display the value of a measure, the timestamp of the most recent update to the data source, and a description of current interactive filters. Dynamic text is available in SAS Visual Analytics 7.5 and SAS Visual Analytics 8.2 and later.
Step 4: Test
Finally, view the report and test the parameter with a value of 10. The data source filter updates to show eclipses that occur in the 10 years after today’s date, the geo map is updated to show those eclipses, and the dynamic text object updates to display 10 in the title. (See Figure 4.29.)
Figure 4.29: Viewing Eclipses in the Next 10 Years
