
C H A P T E R 2
![]()
IDE Improvements
The last release of Visual Studio 2010 saw a radical overhaul of the internals of the IDE with much of the interface rewritten in WPF and a new MEF-based extension model introduced. With this release, the IDE has a fresh new look and the team has concentrated on making it easier than ever for developers to navigate around their code.
Compatibility with VS2010 SP1 Projects
Visual Studio 2012 allows the opening and modification of existing Visual Studio 2010 SP1 solutions without having to upgrade them to a new project format. This is fantastic news as it allows you to benefit from VS2012’s many features without having to modify your projects in any way.
![]() Warning This doesn’t mean that you can use .NET 4.5 features in a .NET 4 project!
Warning This doesn’t mean that you can use .NET 4.5 features in a .NET 4 project!
There are, however, some scenarios where VS2012 will need to update components if you open a Visual Studio 2010 project. For example, VS2012 only supports Silverlight 5. As a result, opening a Silverlight v3 or v4 project will not work without upgrade. For more information, please consult http://blogs.msdn.com/b/visualstudio/archive/2012/03/28/round-tripping-with-visual-studio-11.aspx. For a list of compatible projects, see http://msdn.microsoft.com/enus/library/hh266747(v=VS.110).aspx.
Toolbar Changes
One of the first changes you will notice when you run up VS2012 is that the toolbar is much less cluttered as shown in Figure 2-1. A number of buttons you probably never used have been removed. (Note: You can of course bring these back with the customization options.)

Figure 2-1. New, almost zenlike, VS2012 toolbar free from clutter
Quick Launch Box
New to VS2012 is a textbox in the top right-hand corner of the IDE that allows you to enter commands in order to quickly access various items of IDE functionality. By completing the following steps, you will be able to enjoy this new capability:
- Press Ctrl+q to set the focus to the Quick Launch box.
- Start typing the word open. A list of possible commands will appear containing the word open (see Figure 2-2).
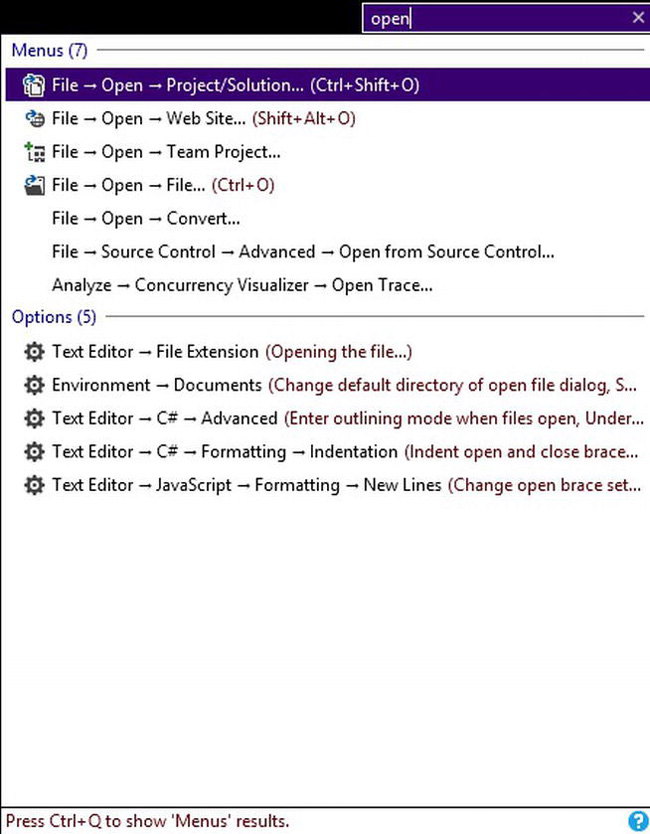
Figure 2-2. Quick Launch box
Note how the Quick Launch box has grouped commands into two groups in the example above: Menus and Options.
There are actually four different types of groups. You can filter commands by group as well; for example, I could restrict the search for the Open command in the menu group with the syntax @menu open.
The other types of groups and their corresponding shortcuts include the following:
- Most recently used (
@mru) - Menus (
@menu) - Options (
@opt) - Documents (
@doc)
It is possible to page through results by category by using the keys Ctrl+q and Ctrl+Shift+q, which is useful if your results are spread across many pages.
Quick Launch Options
You can tell Visual Studio to restrict the type of results returned from Quick Launch (Tools ![]() Options
Options ![]() Environment
Environment ![]() Quick Launch). There is also an option to show previous search results when Quick Launch is first activated as shown in Figure 2-3.
Quick Launch). There is also an option to show previous search results when Quick Launch is first activated as shown in Figure 2-3.
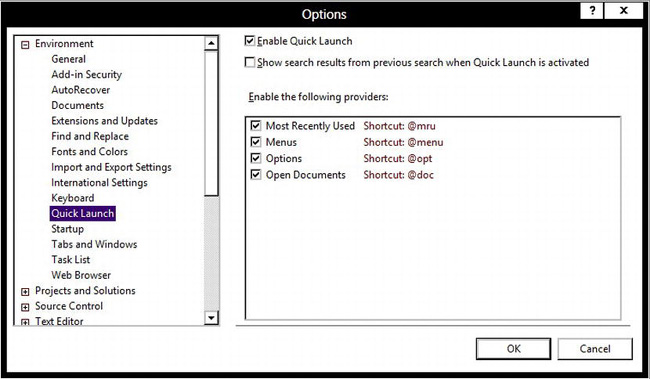
Figure 2-3. Quick Launch options
Search Improvements
Visual Studio 2012’s search capabilities have been upgraded with new advanced search options. Let’s take a look at these with the find/replace dialog box.
- Open a code file in Visual Studio and press Ctrl+h to bring up the new find/replace screen (Figure 2-4).
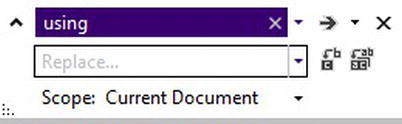
Figure 2-4. New find/replace screen
- In order to look at the advanced search option dialog box, click the down arrow at the end of either the find or replace box, and you should see something similar to Figure 2-5.
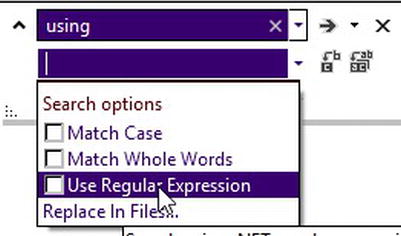
Figure 2-5. Enabling regular Expression Search option
Notice that we can now use regular expressions in the search options (by checking the Use Regular Expression option)—very nice!
Search Everywhere!
Search has been integrated into many VS2012 windows and controls making it easy to quickly locate items you are searching for. All the search boxes support camel case searches (“TS” would return files such as TestStub) and fuzzy searching (e.g., “Stub” would return TestStub class).
Let’s take a quick tour of these now. Figure 2-6 shows the search options for the error view. (Hopefully, you won’t have that many errors that this will be necessary!)
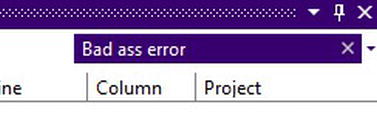
Figure 2-6. Error list search integration
Even the toolbox has its own search now (see Figure 2-7).

Figure 2-7. Toolbox search option
Solution Explorer also contains integrated search as shown in Figure 2-8.
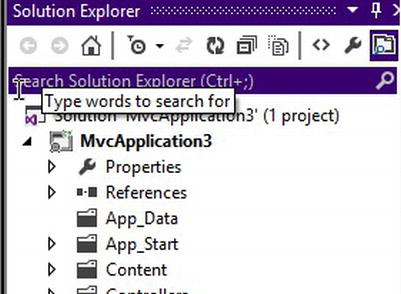
Figure 2-8. Solution Explorer search
Even the Threads window has search capabilities (see Figure 2-9).

Figure 2-9. Thread search window
Parallel Watch Supports Boolean Expressions
The parallel watch window (to see this, run your application in debug mode, right-click on a variable, and click Add parallel watch) has a new search option that allows you to enter a boolean filter expression. Figure 2-10 shows this in action where the thread will only be shown if the test value is greater than one.
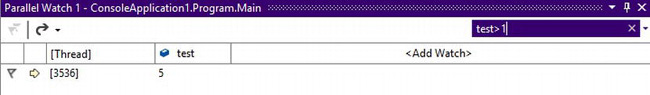
Figure 2-10. Parallel watch window
Solution Explorer Enhancements
The Solution Explorer has undergone a number of enhancements previously only available via Visual Studio extensions.
Collapse All
The Solution Explorer receives (a very overdue) Collapse All project option that is useful when navigating around very large projects. You will find this option toward the right-hand side of the Solution Explorer options pane (see Figure 2-11).
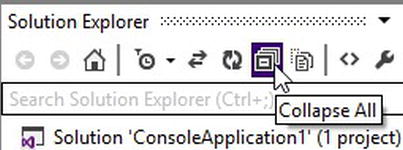
Figure 2-11. Collapse All button
Pending Changes and Open Files Filter
Often in large projects, you want to filter Solution Explorer to just show files that have pending changes or which are open. Visual Studio 2012 gives you this facility—to use, simply click the button to the right of the home icon. The drop-down next to it gives you the facility to switch the filter between open files and pending changes as shown in Figure 2-12.
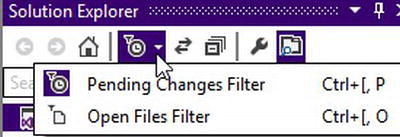
Figure 2-12. Open files and pending changes filter
Preview Selected Items
In a large project, you might want to quickly jump back to a file selected in Solution Explorer. By clicking the Preview Selected Items button (shown in Figure 2-13) the selected items will be opened in a special new preview tab mode (more about this shortly!)
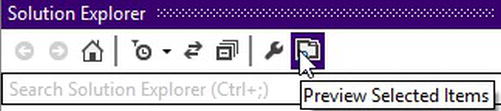
Figure 2-13. Preview selected files
Sync with Active Document
Sync with Active Document allows you to force Solution Explorer to show where a file is in the project structure when you are working on it (see Figure 2-14).
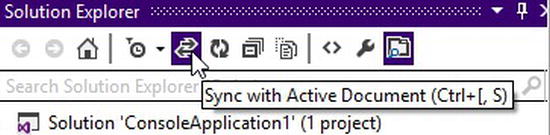
Figure 2-14. Sync with Active Document
Masked Renaming files
If you select an individual file to rename (either right-click/rename or F2), then only the file name will be selected to save you from accidently overwriting the file extension (see Figure 2-15).

Figure 2-15. Rename file now only selects file name.
Image Preview
The Solution Explorer now contains the ability to preview images in your solution by hovering over them as shown in Figure 2-16.
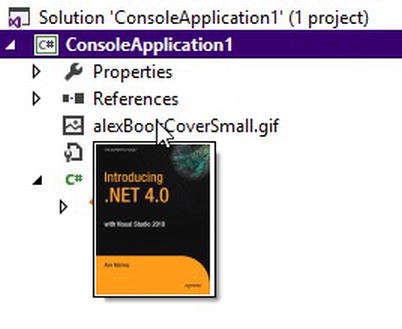
Figure 2-16. Solution Explorer allows you to preview images by hovering over them.
Scope to This
The Solution Explorer has a new option to filter the view relative to the selected item. To activate this feature, simply right-click on a file and select the Scope to This option on the context menu that appears as Figure 2-17 shows.
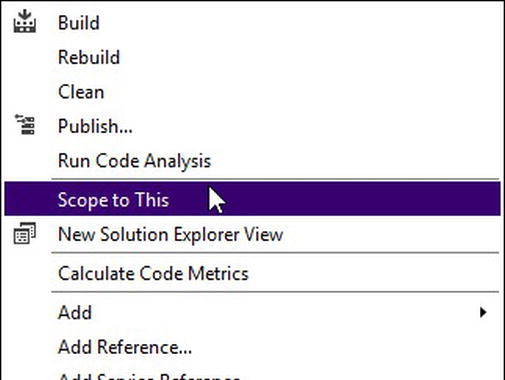
Figure 2-17. Scope to this context menu option
The Solution Explorer will then filter the files displayed. In Figure 2-18, I selected the HomeController class to set the scope to.
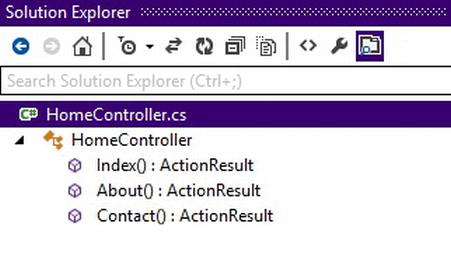
Figure 2-18. Results of scope to this context menu selection
When you want to get back to the normal solution view, you can revert back by selecting the home or back button in Solution Explorer.
Hubs and Pivots
One of the issues the IDE team was keen to solve was to make sure that developers could navigate around their solutions as easily as possible, avoiding the need to switch to different windows to perform a task:
In order to accomplish this, the team have added additional navigation and view options. Let’s take a look at some of these.
If you explore various files, you will notice you can now expand them to view the classes and methods they contain. Right-clicking on a file will also bring up a new context menu showing the call hierarchy feature that was introduced in Visual Studio 2010. Figure 2-19 demonstrates this.
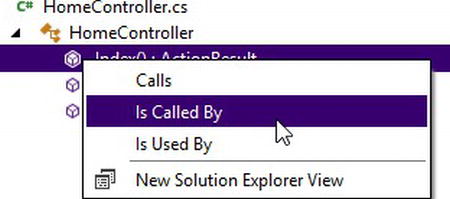
Figure 2-19. New context menu in Solution Explorer
A new context menu has also been added to the Class Explorer window that allows you to easily view a class or method’s call hierarchy and usage. To see this, switch to the class view tab, search for a class or method, and then right-click on one of the results to see a context menu with further actions you can perform as shown in Figure 2-20.
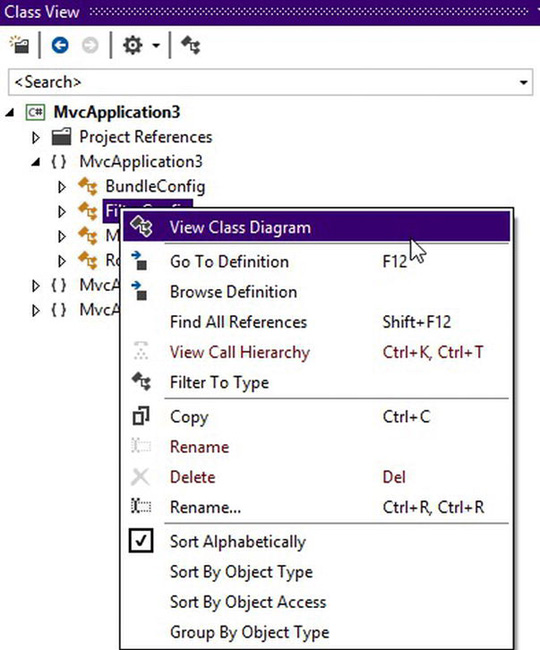
Figure 2-20. New context menu on Class Explorer
Note how in the Class Explorer that when selecting a class, the methods it contains are displayed in Figure 2-21, allowing you to quickly navigate around code.
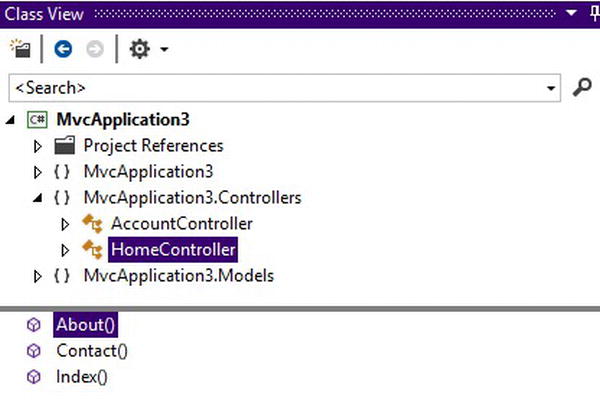
Figure 2-21. Solution Explorer showing methods in class
Improved Multi Monitor Support
Visual Studio 2010 introduced the ability to move windows outside of the IDE to a different monitor, but they were restricted to being of the same type of document or tool window. VS2012 removes this restriction and also allows each window group to have its very own Solution Explorer window.
To create a separate instance of Solution Explorer, right-click on an item within Solution Explorer window and then select the New Solution Explorer View context menu option to create a copy of the Solution Explorer window (see Figure 2-22).
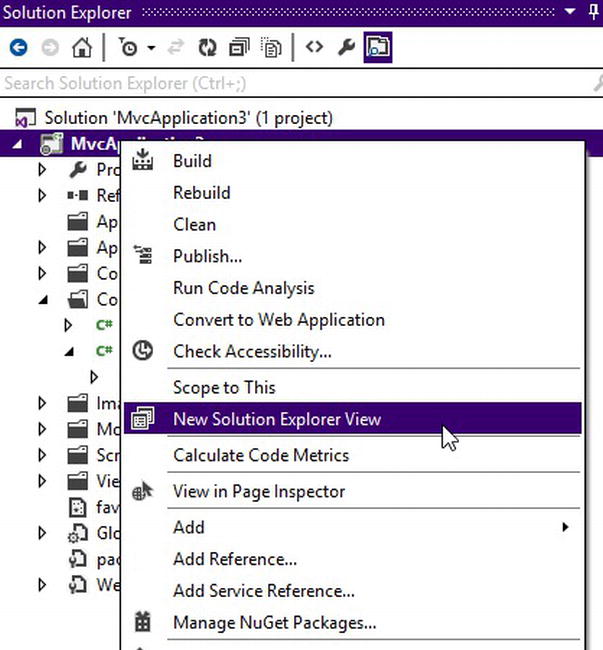
Figure 2-22. Creating a new Solution Explorer window
Now that you have a new Solution Explorer, you can drag it into another set of windows as demonstrated in Figure 2-23.
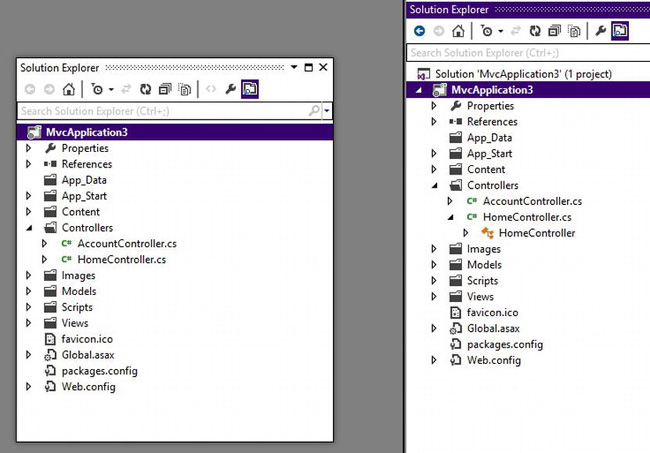
Figure 2-23. New solution window
Tabs and Preview Mode
Often when you are tracing a method through code, you can end up with many tabs open and leave you trapped in MDI hell (or, at the very least, with lots of tabs to close!). VS2012 resolves this issue by the introduction of a new preview tab mode. Files in preview mode can be modified the standard way, but if you then open up another file from within the preview window, it will replace the existing previewed file instead of opening up another tab.
So, how do you open a file in preview mode? Good question—glad you asked! To preview a file, simply click on a file once from Solution Explorer and it will appear separately to the right of the other files with a different icon to illustrate that it is in preview mode (see Figure 2-24).
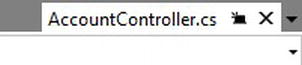
Figure 2-24. File opened in preview mode
You can promote a previewed tab to a normal tab by dragging it or clicking the small starred tab icon next to the file name. Preview mode also works when debugging, through the go-to definition option, and when viewing the results of a search.
If you find the preview files option kicking in accidently, you can temporarily disable it by holding down the alt button when you open a file. Alternatively, you can disable it in the Tools ![]() Options
Options ![]() Environment
Environment ![]() Tabs and Windows screen by checking the Select allow new files to be opened in the preview tab checkbox.
Tabs and Windows screen by checking the Select allow new files to be opened in the preview tab checkbox.
Navigating Back and Forward Now Opens Closed Files
Previous versions of Visual Studio allowed you to navigate back and forward between files with the shortcut Ctrl– (back) or Ctrl+Shift+ (forward). VS2012 will now open any previously closed files in preview mode while doing this, saving you from having to open them again. I think this has to be Alex’s number 1 VS2012 IDE improvement, and it will save you heaps of time!
Tabs Stay Put
In VS2012, tabs will not change their position as other files are opened.
Pinned Tabs Changes
VS2012 contains a new option to keep all pinned tabs in a separate row. To enable this, type Tabs in the Quick Launch window, select Environment ![]() Tabs and Windows, and then check the Show pinned tabs in a separate row option.
Tabs and Windows, and then check the Show pinned tabs in a separate row option.
Add References
Previously, it was quite difficult to locate references in Visual Studio due to the way they were grouped and filtered. VS2012 simplifies this with one unified view of references with references that don’t belong in the targeted framework version grayed out. If you should accidently select a previous framework’s version, then VS2012 being up is an option to re-target the project. The screenshot in Figure 2-25 shows the new reference window.
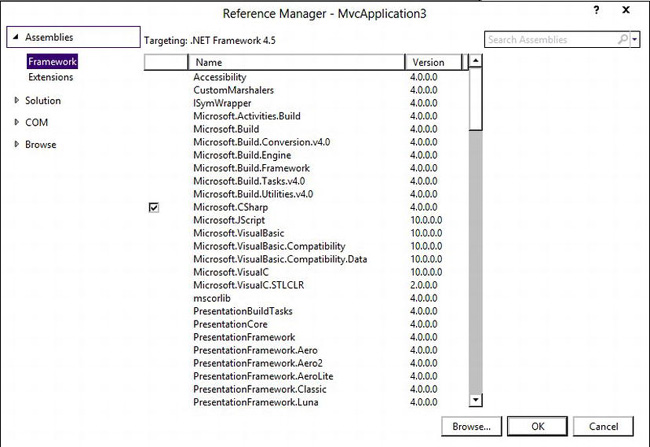
Figure 2-25. New add references window
Web IDE Improvements
The IDE experience for web developers within VS2012 has drastically improved over the last few versions (although design view still sucks!). VS2012 has some really good productivity enhancements for web developers and improved support for emerging standards and technologies such as HTML5, CSS3, and WS-ARIA.
New Debug in Different Browser Option
VS2012 has a new option to allow you to start debugging in different browsers that is activated by clicking the down arrow next to the browser name (see Figure 2-26).
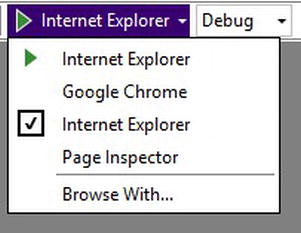
Figure 2-26. New toolbar option to run in browser
Scott Hansleman has a nice post about customizing this to support different browser launch options (e.g., some browser support command line switches to avoid saving to the browsers history): www.hanselman.com/blog/CommentView.aspx?guid=ee1c533f-25f7-4c47-b85e-55097e29bebe
Page Inspector
Page Inspector is a marvelous new feature in VS2012 that allows you to easily identify the individual components that make up a page. At the time of writing, Page Inspector is limited to Web Pages 2 or ASP.NET 4.5 applications and pages displayed in IE standards mode, and it also requires Internet Explorer version 9 or above.
To view a page in Page Inspector, either right-click on it in Solution Explorer and select View in page inspector or select it from the main IDE menu and run the application (see Figure 2-27).
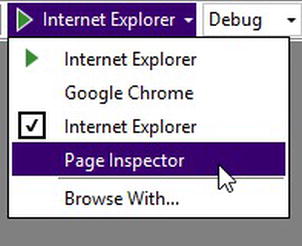
Figure 2-27. Running Page Inspector from browser menu
So, what we can we do with Page Inspector? I think one of the most useful aspects of Page Inspector is that by clicking on the Files tab, you can see the components that make up a page as shown in Figure 2-28.
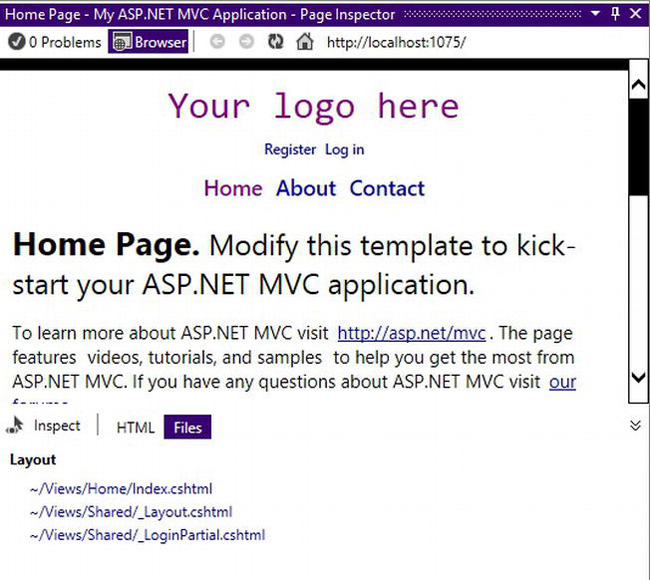
Figure 2-28. Page inspector allows you to see the files that make up a page
You can drill down into even more detail by activating the inspection feature (arrow with inspect located down at the bottom left-hand corner) and then hovering over an element as Figure 2-29 demonstrates.
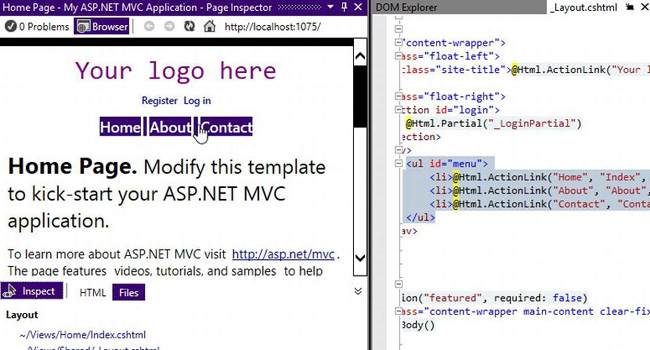
Figure 2-29. Page Inspector element inspection features
There is also an HTML tab, as shown in Figure 2-30, that allows you to navigate and modify styling with an interface that looks very similar to IE’s development tools (and given Internet Explorer is a requirement for the page inspector they could be the same tools).
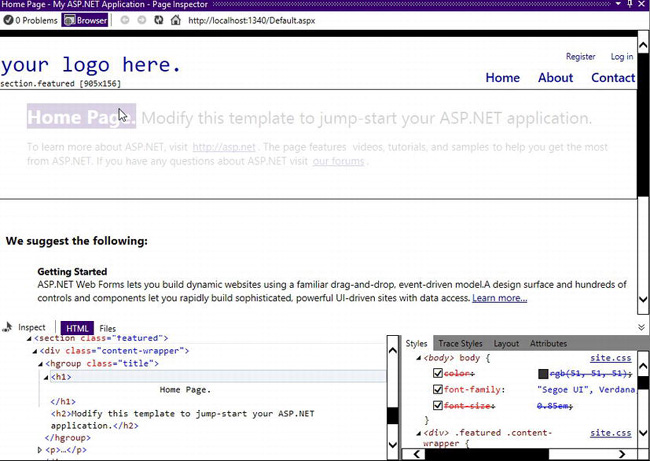
Figure 2-30. Page inspector, HTML tab
If you modify any files, then Page Inspector will alert you that you need to save and reload them with the message shown in Figure 2-31.
Figure 2-31. Page inspector alert message due to unsaved changes
Rename Matched Tag
In VS2012, altering an opening tag element will also automatically update a closing tag. For example, if you had the following markup:
<div></div>
And modified it to something else such as
<myNewDiv>
Then the closing tag would also be updated at the same time as Figure 2-32 shows.
Figure 2-32. Match tag being renamed
IntelliSense Improvements
IntelliSense options can now be filtered by matching the start of a string and camel case searches. IntelliSense is now also provided when entering code inside attributes (see Figure 2-33).
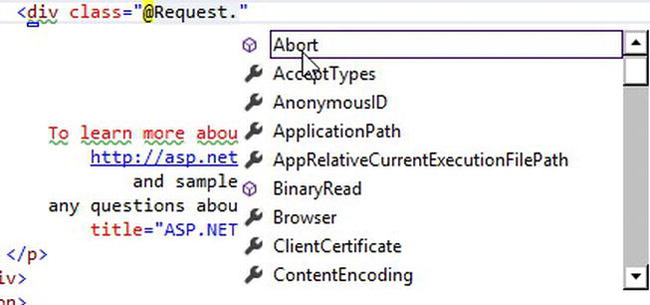
Figure 2-33. IntelliSense inside attributes
Quotation Tweak
One Visual Studio quirk I found very irritating was that when entering properties such as runat="server", it was necessary to also enter the quotation marks. This is no longer necessary and VS2012 will automatically insert the quotation marks for you and move the cursor outside the quote block.
SQL Server Object Window
VS2012 contains an improved interface to SQL Server that is now very similar to SQL Management Studio interface and provides additional functionality over the integrated tools in previous versions. To access this window open, it from the main menu View ![]() SQL Server object window option as shown in Figure 2-34.
SQL Server object window option as shown in Figure 2-34.
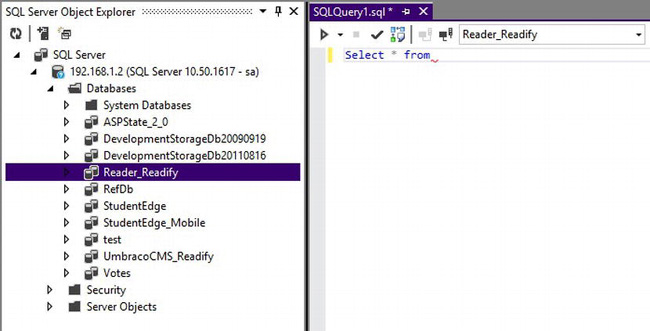
Figure 2-34. New SQL Server Object window
Additionally if you are accessing a SQL 2012 database, you will benefit from an enhanced table designer showing the SQL used to create the table alongside a graphical view.
Support for Different Test Frameworks
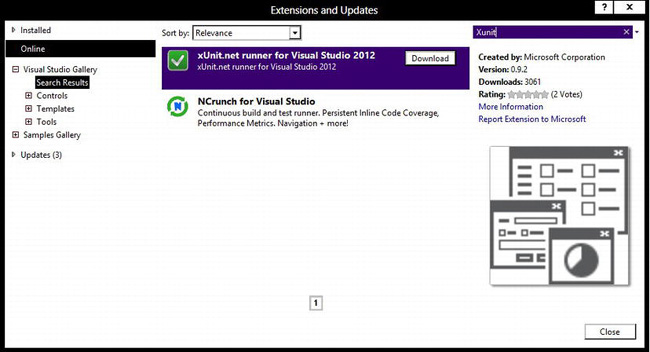
VS2012 supports the use of different testing frameworks through new adapters. The test adapters can be installed via Visual Studio’s Extension Manager (Tools ![]() Extensions and Updates). Let’s give this a try and run an xUnit test from within VS2012!
Extensions and Updates). Let’s give this a try and run an xUnit test from within VS2012!
- First of all, you need to install the xUnit runner extension. Go to Tools
 Extensions and Updates and search online extensions for xUnit. You should find xUnit.net runner. Now download and install this (note this will restart Visual Studio). See Figure 2-35.
- Now create a class project to contain our tests.
- You now need to install xUnit from NuGet. Right-click on the project and select Manage NuGet Packages, search for xUnit (in the online section), and then hit the install button.
- Create a new class file to contain the tests and add the following code:
using Xunit;


public class Class1

    {


        [Fact]

        public void The_Sky_Should_Be_Blue()

        {

            const string expected="Blue";

            string actual = "Blue";

            Assert.Equal(expected, actual);

        }


        [Fact]

        public void One_Plus_One_Should_Equal_Two_Or_Does_It()

        {

            Assert.Equal(1+1, 3);

        }

} - Compile your project and you should be good to go. You can either run your xUnit tests in the standard manner by right- clicking on them in the code editor or from the much improved Test Explorer window (Main menu Test Windows Test Explorer), shown in Figure 2-36.
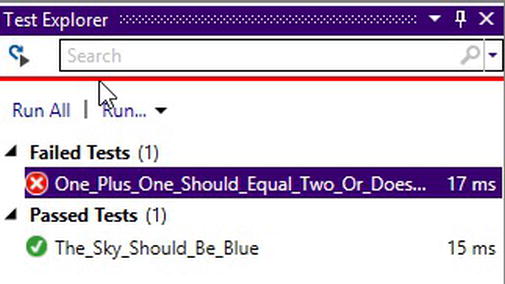
Figure 2-36. Unit test explorer
ASP.NET Web Forms
VS2012 contains a number of IDE improvements for ASP.NET users, which we will look at now.
Extract to User Control
Often when developing an ASP.NET application, developers will prototype a screen by adding a number of elements directly to an ASPX page. At some point, portions of the page are then extracted into a separate user control for readability or reuse. VS2012 has a new Extract to user control option to extract and register your new control with just a couple of clicks.
To use this with an ASP.NET web forms project, simply highlight a section of code you want to be extracted, right-click, and then from the context menu select the Extract to user control option. The extract to user control screen will then display allowing you to configure the file to extract (see Figure 2-37).
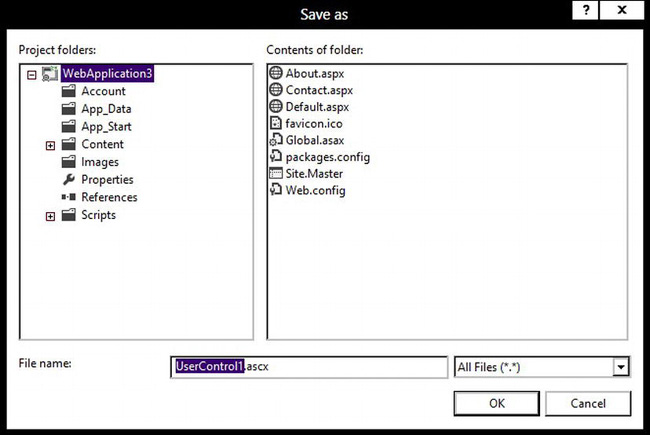
Figure 2-37. Extract to user control
Event Handler Creation
VS2012 makes it very easy to create and wire up event handlers. To see this, simply create a new button on an ASPX page:
<asp:button runat=”Server”>
Now type OnClick and from the smart task dialog box that appears, select the <Create New Event> option that pops up (see Figure 2-38).
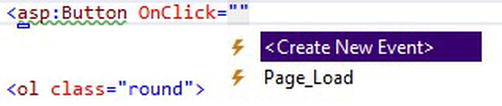
Figure 2-38. Event handler creation
Behind the scenes, VS2012 will now create and wire up a click handler for the button.
Smart Tasks Support in Code Editor
Previous versions of Visual Studio introduced smart tasks (kind of a wizard for certain tasks). VS2012 expands on these and allows you to use some of them directly from code view. Let’s see this in action with the GridView smart task options.
Enter the following code on an ASPX page:
Now either click the small smart task arrow to the left of the element or position the cursor inside the element and click Ctrl+. to bring up the smart dialog box. You should see some new options as shown in Figure 2-39.
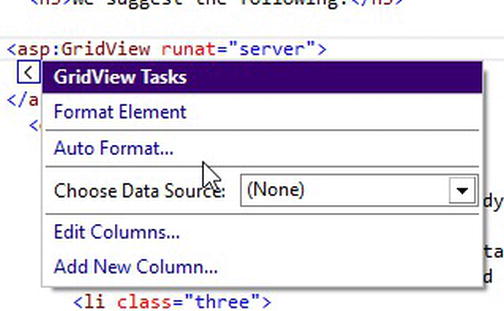
Figure 2-39. Smart tasks for GridView
Better Support for Emerging Technologies
The last few years have seen the development and increase in an astonishing number of technologies for web developers. VS2012 now contains IntelliSense support and snippets for the following technologies and standards:
- HTML5
- CSS3
- WS-ARIA (disability support)
HTML5
The IDE now supports new HTML5 input types such as e-mail, number, and so forth (see Figure 2-40).
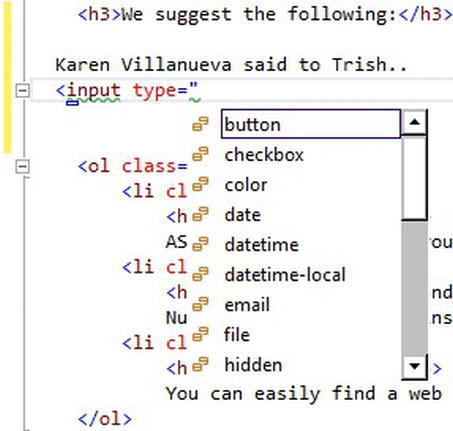
Figure 2-40. Input type snippet
In addition, the VS2012 IDE can now validate HTML 5 doctypes and HTML elements support ~/ syntax for referencing files.
![]() Note HTML5 support has also been added in ASP.NET and ASP.NET MVC with enhanced versions of controls such as
Note HTML5 support has also been added in ASP.NET and ASP.NET MVC with enhanced versions of controls such as FileUpload, updating of existing controls such as UpdatePanel, and new HTML extension methods. Consult the ASP.NET and ASP.NET MVC chapters for more details.
Many HTML5 elements such as video and audio also have their own code snippets. Let’s try the video snippet now.
Open up an ASPX page and type video. Press Tab. VS2012 will insert the video snippet and focus the cursor on the first element as shown in Figure 2-41.
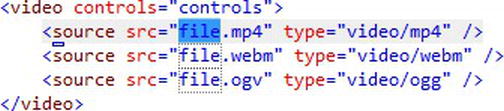
Figure 2-41. Video snippet
![]() Note VS2010 users can download a free IDE extension at
Note VS2010 users can download a free IDE extension at http://visualstudiogallery.msdn.microsoft.com/d771cbc8-d60a-40b0-a1d8-f19fc393127d to benefit from some of these updates.
CSS Changes
VS2012 has improved IntelliSense and snippet support for many CSS3 properties such as rounded borders, animation, and media queries.
Smart indenting
Style sheets can quickly become unreadable and confusing. (I would recommend a pre-processor such as Less or SASS to minimize this.) VS2012 automatically indents rules based on their specificity that can alleviate this issue somewhat.
The below screenshot in Figure 2-42 demonstrates this indenting in action.
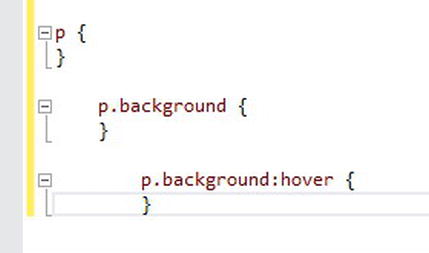
Figure 2-42. Style sheet indenting
If you would prefer not to use this automatic indenting feature, you can disable it by going to Tools ![]() Options
Options ![]() Text Editor
Text Editor ![]() CSS
CSS ![]() Formatting and unchecking the Hierarchical Indentation checkbox.
Formatting and unchecking the Hierarchical Indentation checkbox.
CSS Hack Support
Sometimes it is necessary to use CSS hacks to target a specific browser. VS2012 now understands some of these hacks and will not mark them as invalid.
Comment/Uncomment CSS
VS2012 now allows you to comment out style sheet rules in a similar fashion to commenting out code (Ctrl+K+C and Ctrl+K+U).
CSS Color Picker
VS2012’s new CSS editor contains a new color picker that is visible when setting color-based CSS properties such as background color. When you hover over a color property, the color picker will show colors already used within the style sheet allowing you to quickly select them as in Figure 2-43.
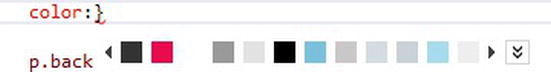
Figure 2-43. New CSS editor allows you to pick colors already used
It is also possible to select any color by clicking the + button to bring up a full pallet and eye dropper screen. Note that if you modify the opacity of a color, VS2012 shifts automatically between RGB and RGBA modes (see Figure 2-44).
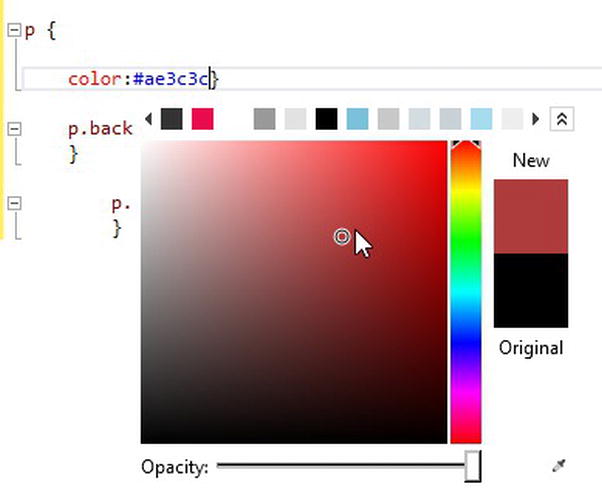
Figure 2-44. New color picker
WAI-ARIA (Accessible Rich Internet Applications)
VS2012 contains support for something called WAI-ARIA. Many developers probably haven’t heard of WAI-ARIA, which “defines a way to make web content and web applications more accessible to people with disabilities,” www.w3.org/WAI/intro/aria. This definition probably doesn’t help clear up what exactly it is, so an example is in order.
Let’s say that we have a fancy month slider control that allows users to search flights across different months. This slider control is probably made up of a number of div elements and transformed through the magic of curly braces and semicolons (yes, that’s CSS & JavaScript) into something that resembles a slider control to users.
In HTML terms, our slider might look something like the following:
<div class=”slider-container”>

        <div class=”slider”>

        </div>

</div>
This is all well and good for our standard desktop browser users, but what if a user accessed a site on a screen reader device? It’s very unlikely the screen reader will know how to interpret this and, thus, our site could be unusable for such users.
WAI-ARIA attempts to resolve this issue by adding metadata to elements to give devices a better chance of interpreting an element correctly. The markup below shows the above example but with some additional ARIA properties:
<div class=”slider-container”>


        <div

        class=”slider”


        role="slider"

        aria-valuenow="1"

        aria-valuemin="1"

        aria-valuemax="12"

        aria-valuetext="January">


        </div>


</div>
As sites become more complex, WS-ARIA is going to become more important— especially if you are working on a government site where there is often legislation regarding this. It’s probably not too farfetched either to think that search engines could begin (if they are not already) utilizing this metadata.
Anyway, back to how VS2012. VS2012 contains extensive ARIA IntelliSense support so if you add a div element to a page and start typing ARIA, you will find a list of all the available properties and roles (see Figure 2-45).
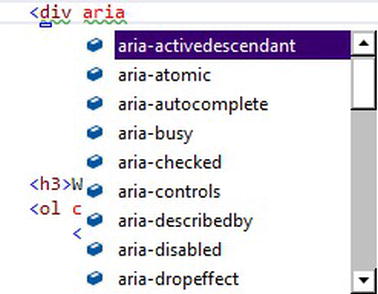
Figure 2-45. VS2012 ARIA IntelliSense support
Devices and applications that don’t support WS-ARIA will just ignore these additional properties. So, with VS2012 IntelliSense now supporting WS-ARIA, it’s a bit of a no-brainer as to whether to use it or not—do it!
JavaScript Improvements
The JavaScript editor has a number of great improvements:
- Automatic creation of collapsible regions for ease of navigation
- Automatically highlighted matching braces
- New go-to definition support for variables and functions to facilitate code transversal
- IntelliSense support for EcmaScript v5 and many new HTML 5 APIs such as DOM storage, query selector, canvas, and cross document messaging
- Ability to put a breakpoint on a single JavaScript statement, e.g.
var x=”hello”; alert(x); - Function signatures with auto completion
- Ability to delay the loaded of scripts for debugging purposes
JavaScript Console and DOM Explorer
VS2012 contains a new integrated JavaScript debug console and DOM explorer. These tools are similar to the integrated ones in Internet Explorer. At the time of writing this, only works with Internet Explorer version 10 (which also currently means Windows 8 only!) and only in debug mode.
As the tools can only be used when debugging, we will need to create a test application to play with these features.
- Create an empty ASP.NET web application and add a new JavaScript file to the project called test.js and enter the following code:
var a = "test a";

var b = "test b";

var c = "test c"; - Add an HTML file to the project called
default.htm. - Drag the JavaScript file onto
default.htmto create a reference to it in the HTML file:<script type="text/javascript" src="test.js"></script> - Put a breakpoint on the second line of the JavaScript file (not strictly necessary but helpful for playing with this feature).
- Check the selected debug browser is Internet Explorer and press F5 to run up the application.
- Now bring up the JavaScript console from the Debug Windows JavaScript console (Ctrl+AltVC).
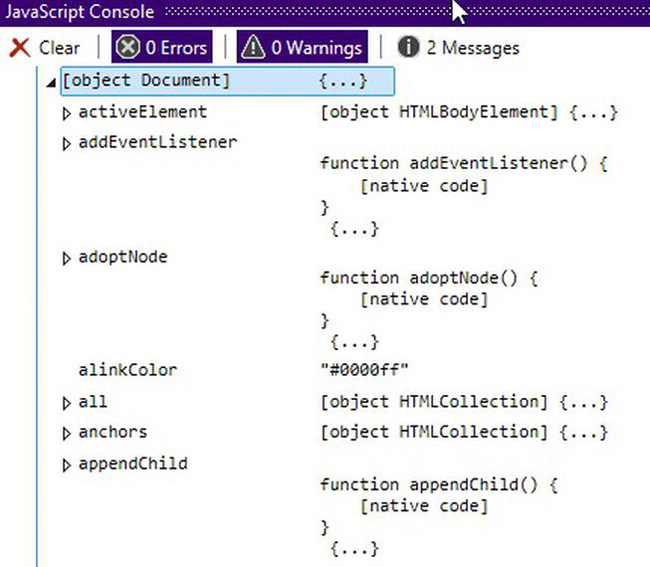
- You should now see a screen similar to one in Figure 2-46 that can be used to run JavaScript and query object properties. In the example that follows, I have performed some simple math and used it to query an object’s properties.
- Now bring up the DOM explorer (again similar to IE’s development tools) to examine the structure and styling of a page. This is again accessed from the Debug Windows DOM Explorer, shown in Figure 2-47.

Figure 2-47. DOM explorer window
It’s a bit of shame these features are only available with IE10 and other browsers arguably have better tools, but the integration into Visual Studio can only be a good thing.
Implicit References and Reference Groups
To obtain Visual Studio IntelliSense support when working inside a JavaScript file, previously you would add a special reference to it with the following syntax:
/// <reference path="common.js" />
In VS2010 if you dragged a file you wanted to reference into the file you were working on, the reference comment would be created. It would, however, be created where you dropped it. In VS2012, references will always be placed at the top of the page.
VS2012 allows you to create groups of JavaScript files that will always be in scope (and referenced for IntelliSense purposes) with the new reference group feature. Let’s open this up now.
Go to Tools ![]() Options
Options ![]() Text Editor
Text Editor ![]() JavaScript
JavaScript ![]() IntelliSense
IntelliSense ![]() References, and you will see a dialog box that allows you to add files to be referenced as shown in Figure 2-48.
References, and you will see a dialog box that allows you to add files to be referenced as shown in Figure 2-48.
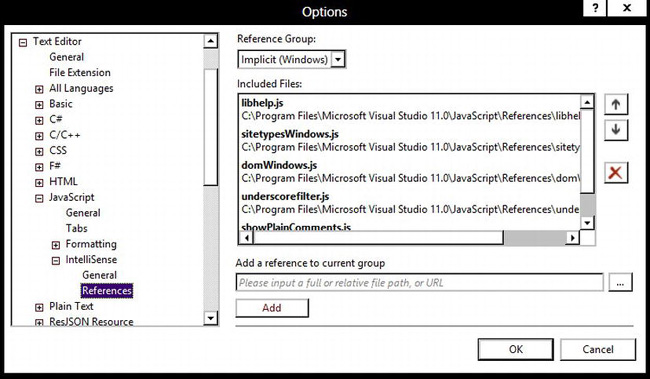
Figure 2-48. IntelliSense for “overloaded JavaScript functions”
VS2012 has three types of reference groups:
- Implicit: files that are in scope for all JS files
- Dedicated: in scope with an explicit reference to a worker reference group
- Worker: allows you to define groups of files to be referenced
Note how you can also configure the order of files and change the type of reference group.
IntelliSense for Overloaded JS Functions
JavaScript doesn’t support function overloading in quite the same way as C#, but it is possible to create a function that accepts a different number of parameters. In JavaScript, if you only pass one value into a function (that accepts several), the function will be called but the other parameters set to null. You can then test for this to determine which version of the function is called and assign values accordingly.
VS2012 allows you to add IntelliSense support for “overloaded functions” by marking up functions with a special comment-based syntax. The following example shows how to use this to display two different overload options:
function doSomething(x, y, z) {


    /// <signature>

    ///     <summary>Gets the value</summary>

    ///     <param name="x" type="String">Something</param>

    /// </signature>


    /// <signature>

    ///     <summary>Gets the value</summary>

///     <param name="x" type="String">Something</param>

///     <param name="y" type="String">Something</param>

    /// </signature>

}
Now when we come to use the function, Visual Studio knows it’s intended to be used with a different number of parameters and displays an option (see Figure 2-49).
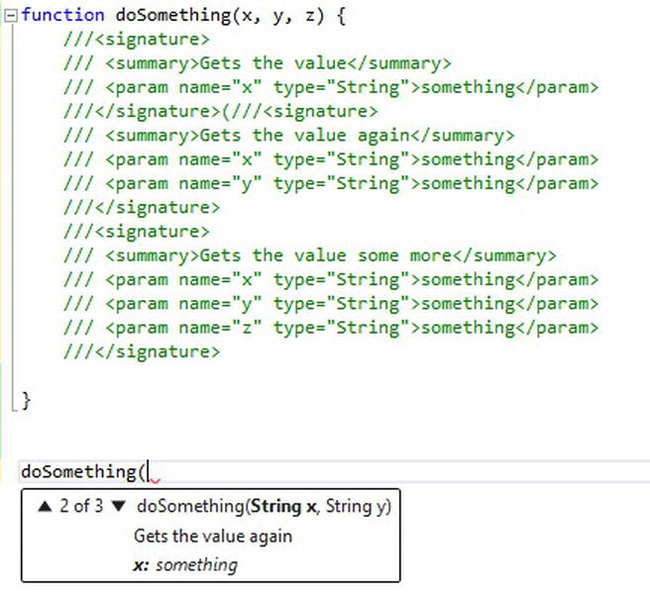
Figure 2-49. IntelliSense for overloaded JavaScript functions
Miscellaneous Changes
There have also been a number of other important, miscellaneous improvements you should be aware of.
VSUpdate
VS2012 has a new automatic update option to alert you when new updates are available (different to the extension update notification in VS2010).
Performance Improvements
One of the biggest complaints of Visual Studio users was how long projects took to load (“#4 in our first performance survey to early VS2010 adopters” http://blogs.msdn.com/b/visualstudio/archive/2012/03/12/visual-studio-11-beta-performance-part-2.aspx).
Projects are now loaded in two phases:
- Modal loading (this contains stuff you will need immediately and blocks the main UI thread)
- Background loading (stuff you might need later on and occurs once modal loading has finished in the background)
If a user requests a project that hasn’t been fully loaded yet, Visual Studio will immediately attempt to load it. So the final result of all this optimization is that you should be able to work on your projects right away instead of having to go and buy a cup of coffee while waiting for a large solution to load.
Other optimizations include the following:
- Building a project no longer occurs on UI thread, which means the IDE remains responsive.
- Toolbox components are loaded asynchronously.
- Massive reduction in memory requirements due to 300 less assemblies being loaded and a saving of 400mb of virtual memory due to optimizations made (
http://blogs.msdn.com/b/visualstudio/archive/2012/03/05/visual-studio-11-beta-performance-part-1.aspx).
Simplified Remote Debugger Options
The remote debugger has been greatly simplified and avoids the need for any Windows firewall configuration on either debugger or “debugee”. It also contains discovery options to enable you to easily connect to machines you may want to debug. For more information, please refer to http://msdn.microsoft.com/en-us/library/y7f5zaaa(v=vs.110).aspx.
Stand-Alone IntelliTrace Collector Utilities
VS2012 introduces new stand-alone utilities that allow you to collect IntelliTrace data from machines that don’t have Visual Studio installed. These applications don’t actually install anything and can be uninstalled by simply deleting a folder. For more information, please refer to http://msdn.microsoft.com/en-us/library/hh398365(v=vs.110).aspx.
Publish Profile Changes
Previous versions of Visual Studio introduced one-click publishing to easily enable the transfer of files to a remote server. Unfortunately, this feature didn’t integrate so well with source control systems/multi users. In VS2012, publish profiles are now stored at the following locations as an MSBuild file:
- C#: PropertiesPublishProfiles
- Visual Basic: My ProjectPublishProfiles
The new publish profiles can be used from MSBuild with the following syntax:
msbuild.exe project.csproj /t:WebPublish /p:PublishProfile=ProfileName
Fakes Framework
VS2012 contains a new mocking framework (in more expensive versions that I believe to be Premium and Ultimate at the time of writing) based on work done by Microsoft Research (PEX and Moles) to assist with testing your applications. Many developers will probably wonder why Microsoft felt the need to introduce their own solution when so many good existing open source alternatives exist. According to Microsoft, this was done as the company received continual feedback that customers wanted an out-of-box solution, and some customers didn’t want to use open source alternatives due to licensing issues.
The Fakes framework is divided into two main areas:
- Stubs: allow you to supply delegates or lambdas expressions to replace methods—similar in functionality and implementation to existing mocking frameworks such as Moq and NSubstitue (although currently lacking call verification abilities)
- Shims: allow the interception of method calls and even override core framework functionality
Let’s take a look at stubs first.
Stubs
Stubs allow you to supply an alternative implementation of a method call via a delegate. They are often used when writing unit tests where methods don’t yet exist or depend on a service call. You can even stub out private methods (only if all the types on the method signature are visible).
Let’s look at an example now of how we can use a stub to replace an existing method call.
- First, create a new Visual Studio Console project called
TestFakeFramework. - Create a new interface called
ICustomerRepositoryand add the following code to it:public interface ICustomerRepository
{
Customer GetById(int id);
bool Exists(string email);
void Delete();
} - Now create a new class called
Customer: - Create a new class called
CustomerService:public class CustomerService
{
private readonly ICustomerRepository _repository;
public CustomerService(ICustomerRepository repository)
{
_repository = repository;
}
public bool DoesCustomerExist(string email)
{
return _repository.Exists(email);
}
}
}
Listing x-x. Test classes - Now add a new unit test project to the solution called
TestFakeFramework.Tests. - In the unit test project, add a project reference to
TestFakeFramework. - Right-click on the project reference and select the Add Fakes Assembly option on the context menu as shown in Figure 2-50.
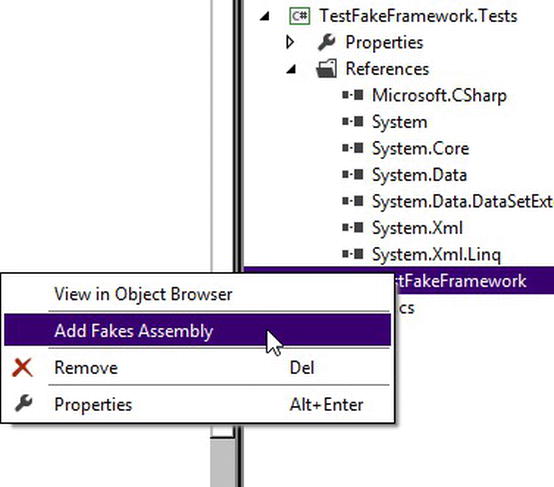
Figure 2-50.Adding Fakes assembly to project
When you select the Add Fakes Assembly option, Visual Studio does a number of things behind the scenes:
- A folder called fakes is created.
- The project’s build file is modified.
- Visual Studio scans the target reference creating stubs and shims for all the methods.
- The fakes are added in an assembly created in a sub folder called fakeassemblies.
The Fakes framework will create alternative methods in the format stubxxx and shimxxx. If you want to regenerate the stub or fakes file, you just need to rebuild the solution.
As the generation of these classes can be computationally intensive on a large solution, Microsoft recommends creating a separate project containing the fakes. It is also possible to hide certain types from the fake build process by modifying the .fakes file. Please refer to the following link for more information:
http://msdn.microsoft.com/en-us/library/hh708916(v=vs.110).aspx
OK, back to the example … let’s use a stub for our Customer repository method:
using System;

using Microsoft.VisualStudio.TestTools.UnitTesting;

using TestFakeFramework.Fakes;


namespace TestFakeFramework.Tests

{

    [TestClass]
    public class UnitTest1

    {

        [TestMethod]

        public void Customer_Should_Not_Exist()

        {


            var stub = new StubICustomerRepository

            {

                ExistsString = (email) => { return true; }

            };


            var service = new CustomerService(stub);


            Assert.IsTrue(service.DoesCustomerExist("[email protected]"));


        }

    }

}
Note how in our test above we were easily able to supply an alternative implementation of the exists method on the customer repository to always return true—nice!
If you want to test behavior within a stub, then you must use a closure as in the below example:
[TestMethod]

      public void Closure_Should_Set_Value_To_Expected()

      {

          //this will get set inside our stub

         string closureToTest="";


             var stub = new StubICustomerRepository

             {


             ExistsString = (email) => {

                 closureToTest = "test"; //in reality set to some variable you want to test


                 return true;

             }

             };


             var doesntMatter=stub.ExistsString("[email protected]");


             const string expected="test";

             Assert.IsTrue(closureToTest==expected);


    }
It’s probably fair to say that this simple example could be arguably more easily developed using existing mocking frameworks such as Moq & NSubstitute that also contain additional functionality. It is nice however to have a mocking implementation out of the box and not to have to reference third party assemblies that may be forbidden in certain environments.
We are not done with the fakes framework, however; it also has an interesting feature called shims.
But what are Shims? Well it’s important to note that you cannot stub sealed classes or static methods, as stubs rely on something called virtual method dispatch—in these scenarios, Shims to the rescue!
Shims
Stubs are great, but they can’t be used in every scenario. What if, for example, you were working with third-party libraries where you couldn’t modify the code to make it easily testable or with static methods? (Note that, generally, with static methods you can create a wrapper.) This type of situation is exactly what shims are for.
Shims can also be used with static methods and also internal methods that are decorated with the InternalsVisibleTo attribute. Under the hood, the framework injects callbacks at runtime into the method’s MSIL, which is pretty awesome:
Let’s see how shims can enable us to override .NET’s DateTime.Now method call.
- First, right-click on the System Reference and select the Add Fakes Framework option (yes, you can do this on System although it won’t work on every type apparently).
- Create a new test method with the following code:
[TestMethod]

public void Should_Override_DateTime_Now()

{

        using (ShimsContext.Create())

        {


        ShimDateTime.NowGet = () => new DateTime(2012, 1, 1, 12, 00, 00);

        Assert.IsTrue(DateTime.Now==new DateTime(2012, 1, 1, 12, 00, 00));

        }


}
Wow! We were able to override a system static method—how awesome is that!
Note the using statement around the ShimsContext create call. It’s recommended you always use this pattern to ensure any shims you create are disposed. Otherwise, things could get a bit confusing!
Shims also have additional methods to allow you to specify how overridden behavior should be applied, saving some tedious typing. For example, to set all instances the same, use the following syntax:
ShimMyClass.AllInstances.MyMethod = () => 5;
Before you go ahead and create a shim, you might want to consider whether you would be better off creating a wrapper/anti-corruption layer around the item you want to test rather than creating a shim as this would have additional maintainability benefits.
Dotfuscator PreEmptive Analytics
Visual Studio has always included a cut-down version of an obfuscation tool produced by PreEmptive called Dotfuscator. VS2012 is no different. It contains an updated version that introduces the ability to automatically send exception information to TFS and create work items out of it (see Figure 2-51).
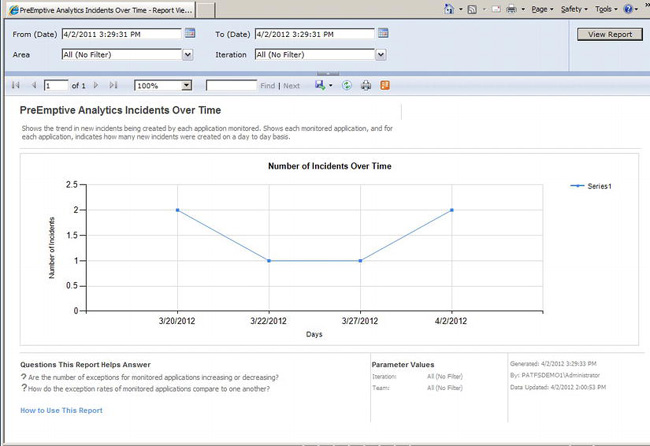
Figure 2-51. Pre-emptive analytics report showing incidents over time
Other Changes
The following changes have also been made that may interest some developers:
- New list designer for SharePoint devs
- Better support for building shaders and a new set of graphics debugging tools for C++ devs (Debug Graphics)
Conclusion
Visual Studio 2012 contains some fantastic IDE improvements that continue to facilitate development. Highlights include backwards compatibility, the new preview file functionality, re-opening of files when navigating back and forth, and the new Quick Launch box.