
Chapter 8
Network Forensics
“Hope is the last thing a person does before they are defeated.”
—Henry Rollins
Now that you have a good idea about investigating endpoints, it’s time to look at the communication between endpoints. In this chapter, we focus on investigating local networks and how they interact with the Internet. This includes network protocols, security tools that monitor networks, various types of network-based attacks, and the footprint they leave behind. We do not investigate external threats beyond what data threat feeds provide and some basic DNS querying because that is out of scope for many forensic investigations. In most real-world situations, administrators just want to know which external sources are malicious so that they can blacklist them and spend all their time targeting threats that impact their internal network. The exception is law enforcement attempting to prosecute a remote threat actor, which quickly could become extremely tricky depending on where the actor is attacking from.
Networking by itself is a massive topic and something you should spend time mastering on its own. The more you understand about how things communicate on the network, the more likely you are to identify the data you are seeking. Security solutions can help automate and consolidate information into an easy-to-understand format, but network forensics requires going beyond the output from security solutions. The most seasoned investigators and incident responders leverage tools without a doubt, but their expertise is understanding how to use tools, what data is captured by those tools, and how to map out the entire event so that they can explain the entire attack life cycle and recommend methods to reduce risk of future incidents.
We start this chapter with a basic overview of critical network concepts that you should be familiar with as a network forensics investigator. The first topic of discussion is understanding the basics of network protocols.
Network Protocols
The first thing to know is the limits of the network. There are 0 to 65,535 ports that could be used. It is not important to memorize the services associated with this many ports, but you should have a general understanding of the most commonly seen ports so that you can assume which services run over them. As a forensics investigator, you are expected to be able to recognize that specific ports represent certain types of traffic. This is common knowledge for anybody responsible for the security of a network, so make sure to master this. To help you reduce scope for which ports to memorize, know that 1,024 of the 65,535 are well-known port numbers, and typically they are reserved for commonly used applications. Within that 1,024, you should probably know the top 25 to 50 ports and associated applications. It is important to also know that those applications don’t have to run over common associated ports, but it’s standard practice and saves you time when investigating networks to assume known services are associated with specific ports.
The protocols that use ports are transport layer protocols such as the Transmission Control Protocol (TCP) or User Datagram Protocol (UDP). TCP guarantees reliability through direct communication, while UDP sends data in packages and doesn’t directly connect with the intended party. This means that UDP depends on the devices between the sender and receiver to pass on the traffic, which doesn’t provide a guarantee of delivery. UDP operates like the post office mailing packages, whereas TCP is like you walking a package over to a friend and hand-delivering it. When it comes to ports, know that there are 65,535 TCP and 65,535 UDP ports. When TCP or UDP is used, the sender and receiver bind themselves to a TCP or UDP port. Once an application binds itself to a port, that port can’t be used by any other application until the connection is complete. For example, when an FTP server binds itself to ports 20 and 21, standard user traffic over port 80 is not impacted. Looking at this example, you should understand ports 20 and 21 are likely FTP and TCP because you need reliable communication and nothing else will be running on those ports while they are bound to the FTP server.
Here is a general reference list of well-known TCP ports and associated protocols. As a forensics investigator, you are expected to recognize ports and associated applications. For example, if you see traffic from port 25, you can make a guess that it is mail related. To see a full list, check out the IANA registry found at www.iana.org/assignments/service-names-port-numbers/service-names-port-numbers.xhtml.
21: File Transfer Protocol (FTP)
22: Secure Shell (SSH)
23: Telnet remote login service
25: Simple Mail Transfer Protocol (SMTP)
53: Domain Name System (DNS) service
80: Hypertext Transfer Protocol (HTTP) used in the World Wide Web
110: Post Office Protocol (POP3)
119: Network News Transfer Protocol (NNTP)
123: Network Time Protocol (NTP)
143: Internet Message Access Protocol (IMAP)
161: Simple Network Management Protocol (SNMP)
194: Internet Relay Chat (IRC)
443: HTTP Secure (HTTPS)
The next basic concept you should understand is what security tools you are likely to encounter. The reason is that they are likely configured to generate logs, which is where you will first want to look when investigating a network event. Let’s run through some common network security tools and the visibility into events they could provide.
Security Tools
Every network is different, but most have a common suite of security solutions from leading vendors or home-grown open source options. You are expected to be familiar with how the following technologies work at an operational level, the types of threats they are designed to catch, the type of reporting they could provide, and where they sit in regard to cyberattacks.
Before reviewing technologies, you should know that technologies can be physical, meaning they are a physical appliance; virtual, meaning they are software or a virtualized appliance; or cloud, meaning they are a service enabled from the Internet. There are many reasons why one of these options would be used. For example, typically physical appliances offer the ability to pack in high performance and can be placed inline, which means traffic can run directly through the appliance so that it can make real-time decisions about what can and cannot pass. That doesn’t mean physical appliances are always inline, meaning that appliances can be passive, which is when they are viewing a copy of traffic. The advantage of looking at passive traffic, or not passing traffic directly through the appliance, is that it reduces interruption of network communication during deployment due to the necessity of breaking communication as the traffic path is moved inline with the new security tool. Deploying security tools in a passive fashion means traffic is seen off a SPAN or network TAP, and the appliance just captures copies of traffic from those outlets. Inline deployments are also limited to the performance of the appliance, so you could slow down a network by creating a bottleneck through the inline security appliance.
The diagrams in Figure 8-1 compare inline and passive deployments of security solutions. If somebody asks for a tool to act directly on traffic, which means dropping traffic, it will likely have to be deployed inline to that traffic. The reason is that passive systems can’t act on live data without triggering another tool because they are a copy of the real traffic. This language is common when determining an intrusion detection system (IDS), which is passive, versus an intrusion prevention system (IPS), which is deployed inline. There are exceptions to this, such as having an IDS invoke a TCP reset to remove a connection, but typically inline is used for active security measures.

Virtual environments can introduce some challenges regarding implementing security. Typically, networks have around 80 percent of their traffic coming into and leaving the network. Data centers tend to be different. They usually have the reverse traffic flow, meaning 80 percent of the traffic remains inside the data center between servers while the remaining 20 percent represents what enters and leaves the data center. We find a large majority of administrators overlook this and only deploy security on the edge of the data center, making them blind to threats that impact systems within the data center. The industry language for this traffic movement is north-south, representing what comes and goes from a network, while the term east-west represents traffic within.
To gain visibility within a virtual environment, you need a method to tap into that traffic. First, you should think of virtual servers hosting various services such as SQL, mail, and so on, as containers within one physical server. Containers provide a way to virtualize an operating system in order for multiple workloads to run on a single operating system instance. This approach is growing in popularity to reduce the need for building multiple full VMs for each required program. For example, if you were to run five virtual systems, you would need five full virtual environments, which requires more storage and processing power from the physical server. An alternative approach would be running five docker containers that would not increase the required space because they are on the same system.
To see traffic between these the various systems found in a virtual environment, you can use a virtual security technology that sits between the physical and virtual world. The physical aspect of this concept is tying the virtual connections from the security devices to a physical network card on the server containing all the virtual servers. The virtual aspect of this concept is tying virtual connections on the virtual security appliance to the virtual servers and routing traffic through the security solution, similar to how things are done in the physical world. Figure 8-2 shows a server hosting three virtual servers. Traffic runs through a virtual firewall, which has connections into the physical and virtual world. Traffic that moves between the internal virtual servers, or east-west traffic, is routed through the firewall so that the firewall can monitor internal traffic.

Figure 8-2 Gaining Visibility into Virtual Networks
The last security solution deployment option to understand is cloud technology, which essentially is outsourcing some or all capabilities to a remote party. We do not focus on investigating cloud environments in this book, but there are a few concepts to know. First, you can consider challenges with virtual networks similar to cloud, which means you need a method to tap into a cloud in order to view traffic. Many technologies are expanding capabilities into cloud environments through the use of virtual servers or endpoint clients that are installed within the cloud and exporting findings back to a dashboard. Another approach is leveraging available APIs that permit specific traffic to be exported and monitored. Amazon and Microsoft have both expanded their API offerings to help aid security solution providers. This is how cloud access security broker (CASB) offerings like Cisco Cloudlock can access data within Amazon and Microsoft cloud offerings.
Lately, variations of software-defined technology that have been showing upto replace or complement existing physical, virtual, or cloud technology. One example growing in popularity is software-defined networking (SDN). Think of SDN as having switches and routers that are not bound to proprietary firmware, which means things like load balancing, scalability, and support for protocols could be simplified because the hardware doesn’t matter in regard to vendor proprietary functions. The same type of concept is starting to be seen in data centers, meaning the software in virtual environments can run on any hardware to increase flexibility. This is sometimes called software-defined computing (SDC). Understanding the details of these newer networking objects is out of scope for this book, but it is important to be aware that you may encounter this technology and, from a conceptual level, the flow of traffic can likely be investigated using standard tactics for physical, virtual, or cloud technologies.
The final introductory concept to understand about networks is how they are segmented. Typically, segmentation is based on levels of trust, which means you would trust things inside your network and not trust things outside your network. If things outside need continuous access to things inside, you would use a DMZ, which provides a level of trust between the inside and outside. It is common to use scoring for this trust; for example, you could have zero trust for anything outside the network, 50 percent trust for anything on the DMZ, and 100 percent trust for things inside the network. As segmentation matures, that value of trust could range based on the sensitivity and value of what sits within that network segment. An example of this could be having the data center network be a 100 percent trust, whereas other internal networks could have a 90 percent trust, making them less secure than the data center yet more secure than the DMZ.
Segmentation typically is accomplished through physically or logically dividing networks though virtual LANs (VLANs), access control lists (ACLs), or secure group tags (SGTs). It is highly recommended to understand the environment you are investigating so that you can identify when devices that don’t belong within a network segment are identified, such as an outside IP address having access to something within a network. It is also important to understand how systems are granted access to identify when such policies are violated. Spend some time trying to understand segmentation if these concepts are new to you. You are likely to find areas containing sensitive data, such as a data center implementing lots of segmentation, as well as untrusted areas of the network, such as the guest network being completely isolated from the rest of the network. Figure 8-3 shows the different levels of segmentation you should be familiar with as you investigate networks.

Figure 8-3 Different Layers of Segmentation
Now that we have touched on the basics of networking and security, let’s look at some common security tools and the types of forensic data you could pull from them. Remember, you don’t have to be an expert in configuring and managing these tools to properly obtain what you need for an investigation. The more you know, the easier things will be for you.
Firewall
Let’s start with a security tool that pretty much every organization you investigate will have. Firewalls come in many flavors, from host to network and physical to virtual. The key forensic data you hope to find as you investigate a firewall is details about systems crossing a firewall security zone or checkpoint. For example, a firewall on the inside network edge would likely be able to provide useful information about events such as where the remote parties are coming from that have breached the network, what ports and services were leveraged, and so on. We look at this issue in more detail later in this chapter.
You will likely be told that a firewall can detect attacks. This is kind of true. Newer firewalls can provide additional validation of traffic, such as ensuring the state is correct to catch attackers attempting to sneak across a security zone, but usually detection is done by pairing other security capabilities with what a traditional firewall offers. The most common capabilities grouped with a firewall in today’s next-generation firewalls are an IDS or IPS and application visibility and controls. Let’s look at these two concepts next.
Intrusion Detection and Prevention Systems
Another common security tool you are likely to encounter that is built in to another product or as a standalone security tool is an intrusion detection system (IDS) or intrusion prevention system (IPS). Boiling down this technology to its core, an IDS/IPS is designed to detect malicious behavior. This is typically done by looking for known malicious behavior characteristics and signatures of known attacks. A behavior check would be looking for traffic representing an unwanted action, such as launching a port scan within a trusted environment. An attack signature could be identifying a specific exploitation attempt against a known vulnerability. Most IDS/IPS systems weigh heavily on attack signatures and must be continuously updated with the latest signatures to be effective against modern threats.
The forensic value of an IDS/IPS should be pretty clear: these solutions can identify potential malicious activity and log information that will likely record details around the event. We show details later in this chapter.
Content Filter
Another security tool that most organizations have as a dedicated solution or feature within an edge security package is a content filter. At a basic level, these tools filter content, which means what type of data people are permitted to access. For example, it is likely that the organization you are investigating will not want employees accessing adult, gambling, or other nonbusiness material at work. More advanced content filters include a second category of features that are security focused versus policy based. Security categories tend to leverage reputation security, which means looking to identify malicious remote sources versus how websites are categorized.
Content filtering is typically deployed within a proxy or application layer firewall. It is important to know the difference between these two solutions. In general, a proxy only targets Internet-bound traffic, whereas an application layer firewall addresses all ports and protocols. Proxies tend to offer traffic caching, such as storing websites and images that have been visited locally so that future access to those sources is sped up through not having to re-download the associated content. Application layer firewalls do not cache traffic. Proxies typically have traffic directed through them using the Web Cache Communication Protocol (WCCP), or host systems are configured to send web traffic to the proxy. Application layer firewalls are deployed inline or passively, as previously covered. Know that these differences can change from vender to vender, so it is best to research the appliance you are accessing to better understand how it functions.
The logs from content filters can range in value depending on their capabilities. For legal matters concerning how employees use their time, a content filter would be very valuable. Like a firewall, content filter logs can provide details on what systems and ports have been used by systems inside and outside the network. Some content filters also include data loss prevention capabilities, which means they are triggered when specific content is seen over the wire.
Network Access Control
Earlier we defined network segmentation. In the past, segmentation was deployed and enforced manually using architecture strategies with tools like firewalls and leveraging simple features within switches such as port security or sticky MAC. Today, many organizations are automating the access control process with network access control (NAC) technology. We cover NAC technology in more detail in Chapter 11, “Cisco Forensic Capabilities,” but you should know that automated NAC technologies will likely use some form of 802.1x or SNMP communication between the NAC technology and network environment.
The forensic value of access control can come directly from the NAC solution or from other technologies that integrate with NAC technology. Key data that comes from an access control solution could be what devices and people are connected to the network, to what part of the network and at what time they connected, what their posture state was, and so on. For example, in Figure 8-4 Cisco ISE provides a quick view when devices were connected, the types of devices connected, their MAC and IP addresses, and assigned profiles representing the type of access that has been provisioned. This type of information is extremely valuable when you’re attempting to understand all associated devices that could be part of a network investigation.

Figure 8-4 Cisco ISE Showing Devices on the Network
Most NAC technologies include details showing how each system accessed the network. This information is very helpful for understanding what resources are being utilized by each device of interest. Figure 8-5 shows some of the details that could be pulled from investigating a NAC technology. Most NAC technologies pull these details from the device provisioning access, which means what is captured is similar to what you could pull using various command-line options on the access device being utilized by the endpoint.
A lot of value could also be pulled from integrating NAC technology with other security solutions. The first value comes in the form of context; other security tools that identify malicious users showcase them as an IP address. NAC technologies could update those IP addresses with details about the device, such as the associated user and type of device. Figure 8-6 shows Cisco Stealthwatch (a NetFlow tool) pulling in user context from Cisco ISE (a NAC tool), so a host IP address in Stealthwatch is seen as a Windows 7 workstation owned by user Vicki. If this organization used something like Active Directory, you would likely see all the details about the user as well, such as her email, phone number, and other business-related details associated with her directory account. This sharing of data can help the investigator quickly gather a ton of data on any IP address found in any technology that is integrated with the NAC technology.


NAC technologies could also be used as an enforcer. This means that when other technologies identify a threat, they could be configured to have the NAC technology remove that device from the network until administrators assess the threat. This could aid an investigator by placing systems of interest into a quarantined network, reducing the risk of an outbreak as well as helping focus on those particular systems that are segmented from the rest of the network. Leveraging this integration within a SIEM technology is very popular, so anything identified as a risk, regardless of the manufacturer, can be auto remediated.
Packet Capturing
As an investigator, you will spend most of your time looking for events that already occurred versus identifying attacks happening as you investigate an incident. Forensics tends to be a reactive art, so part of your job is putting together the events to explain what happened. One powerful tool that can help you do this is capturing the event from the past and replaying it so that you can see a simulation of what happened live. One way to do this is to capture the network traffic associated with the event and replay it based on the time of the alarm. Capturing network packets can give you details on what happened that many security logs and other event-based technologies don’t include. For example, an IPS will likely tell you when an attack happened and the parties involved, but you will likely not be able to see every detail associated with the event. Seeing the event can be useful for your investigation and ensuring that the IPS event triggered was a real event versus a false positive (false alarm). You need a place to tap into a network to start a capture, so you deploy capture tools on different parts of the network or leverage existing tools that have capturing capabilities.
Note NetFlow and packet captures are methods to record network traffic for playback. Maintaining packet captures typically has a higher cost, but provides more details. Some organizations require packet level details due to compliance and regulations. This includes storing that data for a minimum period of time. Compliance and cost are just some of the factors to consider when choosing which approach is best for your organization.
Many forensic investigators ask if there is a detailed record of the event, meaning a packet capture. It is the most absolute method to view what took place during the event. This level of detail can help an investigator understand each step of an incident, identify what type of data was transferred, identify login credentials, and perform many other actions. We look at examples of packet captures using the Wireshark tool later in this chapter. Having a packet capture means you are likely able to see all details of an event outside of anything that is encrypted. Encrypted traffic must be decrypted, or you will not be able to read it.
NetFlow
One technology that is gaining popularity for monitoring internal networks for threats is network flow (NetFlow)–based monitoring. Many tools support NetFlow, but many network collectors only focus on network trends. This technology is useful to identify network peaks and outages as well as other network-related concerns. This, however, does not help much for enhancing security awareness. Solutions such as Cisco Stealthwatch and Plixer’s Scrutinizer include security analytics to leverage network flow to baseline networks and identify malicious activity. A vast range of flow type tools is available on the market with different types of data being monitored. Also, be aware that the flow being analyzed can also vary in detail based on the type of flow being collected. For example, sFlow uses a random sampling of packets or application layer operations and time-based sampling counters, while NetFlow is a true flow technology using cached flow entries from the hardware producing it. You should be able to recognize the differences in the types of solutions collecting flow as well as the variations of flow types that can be collected when viewing flow-based technology. Another flow option to be familiar with is the IP Flow Information Export (IPFIX) protocol, which is an IETF proposed standard based on NetFlow version 9.
The forensic value from NetFlow tools is to be able to quickly investigate the entire network that has flow enabled. This means that any routers, switches, wireless access points, virtual servers, and so on, that have flow enabled are essentially security checkpoints. NetFlow is essentially network records, so the actual events are not reported, but details about the events are. This information can help investigators identify and understand an incident from the time it touched the network or any associated devices. The details found vary with the type of flow being collected, as we previously discussed. The latest and most detailed version of NetFlow is version 9, which contains tons of details about an event, including network information about systems involved, protocols, time, and so on. Check out the details on NetFlow version 9 data at www.cisco.com/en/US/technologies/tk648/tk362/technologies_white_paper09186a00800a3db9.html.
There are some problems you should be aware of with flow-based technology. Some investigations may require specific details beyond data records, even if those records are very detailed. For those situations, a packet capture is necessary because NetFlow doesn’t contain all the details about an event. Also, many flow solutions include data modification features such as deduplication and record stitching. These features are designed to help an analyst view tons of records by removing duplicate data and automatically piecing together individual flow records into a single record. The downside of this type of behavior is the possibility to corrupt records, which is why we recommend you seek out a version of data records that has these types of features disabled if possible. Without these types of features, each event will likely include hundreds of individual flow records because each network path has its own record. For example, if you want to view Joey’s laptop accessing a website, it could have many individual records representing the traffic going to and later back from the remote resource, whereas a stitched event would show that Joey accessed a particular remote resource. This is why it is highly recommended to leverage a centralized resource that offers correlation without data modification when investigating a large amount of flow data.
Sandbox
A sandbox is a safe place to separate and run untrusted programs. For example, if a security solution identifies a program as suspicious, it could quarantine that program to a sandbox and monitor it within the controlled environment to ensure it is safe before returning it to the network. This approach can be effective, but some malicious software is designed with sandbox detection and bypass capabilities. Examples include identifying virtual network processes or delaying the launching of an attack, assuming that a sandbox would monitor an application only for a specific time before letting it back into the real environment. Figure 8-7 shows a video recording of ransomware running in Cisco’s ThreatGrid sandbox.
The results from a sandbox could help a forensics investigator better understand and identify a threat’s behavior to help track it in other parts of the network. For example, a sandbox could show specific ports or protocols used as well as destinations that are accessed by a malicious piece of software. The investigator could use that data to identify other versions of the threat that act in a similar manner. Figure 8-8 shows the level of details that can be pulled by analyzing malware within a sandbox. Details shown are hashes of the file, processes it used, registry activity, and so on. The amount of details that are populated for you in a sandbox’s report varies by vendor.

We covered how to build an open source sandbox using the Cuckoo software in Chapter 3, “Building a Digital Forensics Lab.” We suggest learning more by testing software within a Cuckoo lab. You won’t get the same level of detail as an enterprise technology such as Cisco ThreatGrid, but you should be able to determine if a file is malicious and how its core functions work within most sandbox technologies available on the market.
Honeypot
A honeypot is a system or environment designed to attract attackers or malicious software. The concept works based on the idea that a threat targets the most vulnerable system it finds while searching a compromised network. The defender can place a few extremely vulnerable systems within the network and monitor those for interaction from other systems. If another system attempts to attack it, the attack will work, but alarms will trigger without the attacker knowing and inform the defender that a breach has occurred. Think of honeypots as decoy systems; they don’t replace the need for internal security but complement existing security.

Sometimes a forensics investigation is launched due to a honeypot being compromised and informing administration of a breach. As with a sandbox, an investigator could use a honeypot to learn how the attacker exploited the system or what ports and applications were used by identified malicious software. Many honeypots are designed to move threats into a sandbox once they are attacked, allowing the investigator to learn about the malicious software or remote attacker from a controlled environment. Consider the details of what you can pull from a honeypot similar to what was shown with sandbox technology.
Security Information and Event Manager (SIEM)
Most modern networks leverage multiple security tools to reduce the risk of being breached. Many of these tools have a management interface, so some organizations could potentially have many different management interfaces they need to monitor in order to keep up with the current state of security. Also, many security tools see only part of any attack, limiting their understanding of how that event impacts the overall organization. To address this challenge, organizations may acquire a centralized repository for security events. The goal is to have all events sent to this device to be correlated and analyzed so that the administrator has one place to view events and decide which to take action on. Also, many smaller events from different systems could be linked together to indicate a larger attack, helping administrators make better decisions about their incident response tactics.
Many forensic investigations for network-related events start by analyzing a security information and event manager (SIEM) because it has a centralized view of the network-wide security events. This permits the analyst to map an attack across different solutions so that he can further investigate details about the attack on each system that sent alerts to the SIEM. SIEMs can also provide some correlation to help the analyst put together what is seen by different tools. For example, each different tool may have a piece of the traffic seen from a larger infection, which only a centralized tool could put together and identify. This is critical, because sometimes the fact that you’re seeing only the smaller pieces could go unnoticed if the security tools are not tuned properly.
Note Not all SIEMs are created equally. Typically, a SIEM is good at being a security information manager (SIM) or security event manager (SEM). SIM-focused solutions can quickly mine large amounts of data to help an analyst get specific desired details about events. SEM-focused solutions are great at taking in a ton of security logs, which helps an analyst prioritize which events are the most critical to address. Our recommendation is to decide which of these needs is most important and try testing a few SIEM options to see how they provide value for your desired security needs.
Threat Analytics and Feeds
Many security solutions leverage some form of threat intelligence, analytics, or feed. The concept is that security solutions, by default, can only see what is in the environment they are monitoring. To increase effectiveness, threat data from other networks can be pushed into a device so it is better prepared for threats that could impact the network it is protecting. An example is having a tool that monitors a bank’s network gain intelligence about a threat that has attacked other similar banks. Security tools could add attack signatures to the bank in preparation for an expected future attack based on what the other banks saw.
When it comes to forensics value, an investigator will likely not gain much value directly from threat intelligence sources. The value is based on how threat intelligence enhances other security technologies so that they can provide better event logs and be better tuned to identify potential threats. You should be aware of threat intelligence as an option to recommend to a customer who has security technologies that are not catching threats due to weak signatures and tuning.
Security Tool Summary
You might run across many other tools as well as various flavors of the technology we covered in this section. It is likely you will not know them all, but we recommend taking the time to be familiar with some of the market leaders because it is likely you will run into those solutions as you investigate networks.
Next, we look at security logs, which are commonly found within security products.
Security Logs
When you want to investigate details about what a security tool has identified as a security event, you likely start with the logs it produces. A log is designed to record details when an event is triggered. So, it should make sense to use this as your starting point for a cyber investigation. This doesn’t mean that evidence doesn’t exist outside the places where security solutions are monitoring and triggering logs, but it is likely that some logs within the existing security solutions contain evidence about an event being investigated. That evidence could be used as a pivot point to launch a deeper investigation. For example, you may find various IPS logs highlighting exploitation against a system, which you could use to further investigate the associated IP addresses and other systems to better understand the attack.
One key point to understand is how a security solution may or may not trigger a log as well as the types of details that are output to a log when an event is triggered. This depends on how the logging within the security solution is tuned. We can break log tuning down to the following four general practices:
![]() High severity/Low verbiage level
High severity/Low verbiage level
![]() Fewer log messages with little details about the event
Fewer log messages with little details about the event
![]() Result: Little storage needed, limited coverage; and lacks details about the event
Result: Little storage needed, limited coverage; and lacks details about the event
![]() Low severity/Low verbiage level
Low severity/Low verbiage level
![]() Lots of log messages with little details
Lots of log messages with little details
![]() Result: Medium storage needed and large breadth of coverage but lacks details of events
Result: Medium storage needed and large breadth of coverage but lacks details of events
![]() Low severity/High verbiage level
Low severity/High verbiage level
![]() Lots of log messages with lots of details in logs
Lots of log messages with lots of details in logs
![]() Result: Lots of storage needed but large breadth of coverage with lots of details
Result: Lots of storage needed but large breadth of coverage with lots of details
![]() High severity/High verbiage
High severity/High verbiage
![]() Fewer log messages but lots of details in logs
Fewer log messages but lots of details in logs
![]() Result: Medium storage needed for fewer logs that contain lots of details
Result: Medium storage needed for fewer logs that contain lots of details
A common question about logging is which tuning is best for your environment. There is no absolute right answer because each approach has pros and cons. Having high severity means triggering for only events that are very recognizable. This approach is great to help administrators focus only on critical events, but it could cause events that are just as critical but stealthy to be missed. Another benefit of this approach is generating fewer events, which means requiring lower storage costs. High verbiage is great to have details on an event, but again, more verbiage means more logs, hence more costly storage. The same concept applies to having less-sensitive tuning to generate more logs. The more logs you create, the higher the storage requirements and the more data to monitor.
To get around storage requirements, security tools tend to have local and off-product storage of log options. Local storage means data is stored within the solution and can be quickly referenced, while off-product storage means logs are compressed and moved to an outside storage system. Off-product logs typically need to be uncompressed and reloaded into a security tool before they can be referenced by the security tool. An example of dealing with an external log request is an investigation needing to view a SIEM’s view of an invent longer than what the SIEM has stored locally. The administrator would typically need to know the timeline of the event and go through a process to recall the logs for that time frame, which is archived on an external storage system. In our experience, typically a security tool carries local logs for 30 to 90 days before exporting to an external storage system. Know this concept when investigating tools like SIEMS so that you are aware of the effort involved with bringing up data outside what is in local storage.
Logs are typically formatted in some form of the syslog format. The key points of a syslog message are the fields specifying the severity level, time stamp, host, or IP address of the devices involved with the event; origin of the devices; and some form of message. The order of things and field naming depend on the specifics of the syslog format. For example, ArcSight uses CEF, seen as “suser” for source user, while LEEF uses “usrName” for the Source User column. What is important is making sure your security solutions support whichever format you use to avoid the need for customizing things to be readable by your collecting device. When customization is required, you typically need to use some software to change the format of the log to an acceptable version before it is received by the collector, or tune your collecting device using a custom parser that can read the unknown syslog format. Custom parsers can be tricky and costly to build, hence the recommendation to stick with popular logging standards whenever possible. Here are the CEF and LEEF formats along with sample output:
![]() CEF Format: CEF:Version | Device Vendor | Device Product | Device Version | Signature ID | Name | Severity | Extension
CEF Format: CEF:Version | Device Vendor | Device Product | Device Version | Signature ID | Name | Severity | Extension
Jan 23 11:17:53 dsmhost CEF:0|Trend Micro|Deep Security Manager|<DSM
version>|600|Administrator Signed In|4|suser=Master...
![]() LEEF 2.0 Format: LEEF:2.0 | Vendor | Product | Version | EventID | (Delimiter character, optional if the delimiter character is tab) | Extension
LEEF 2.0 Format: LEEF:2.0 | Vendor | Product | Version | EventID | (Delimiter character, optional if the delimiter character is tab) | Extension
LEEF:2.0|Trend Micro|Deep Security Manager|<DSA version>|192|cat=System
name=Alert Ended desc=Alert: CPU Warning Threshold Exceeded
Subject:
10.201.114.164
Severity: Warning sev=3 src=10.201.114.164 usrName=System
msg=Alert: CPUWarning Threshold Exceeded
Subject: 10.201.114.164
nSeverity:Warning TrendMicroDsTenant=Primary
Many options are available for centralizing and viewing syslogs. You could use a syslog viewer such as the Kiwi Syslog viewer or one of the many SIEM platforms previously discussed. The value of syslog data is helping you find one or more starting points for your investigation. Alarms include IP ranges that could be further investigated. Attack types could be correlated across other logs, giving you an idea of the type of activity that occurred. Timestamps help place the activity into a time frame, helping you narrow down your investigation to events close to when activity was first seen. The downside of this data could be a false sense of awareness if attacks have gone unnoticed by security logging systems, potential data overload if a lot of false positives and false negatives exist, or misdirection if a correlation engine such as a SIEM doesn’t properly prioritize events being seen. The key concepts to understand when investigating logs are that they are based on the effectiveness of the tool that generated them, only represent the space being monitored, and are a best guess, meaning they could be wrong about what they are reporting. It is best to follow up any findings within logs with further analysis to prove that what was identified actually happened.
To manually analyze logs for an investigation, you need a method to search and filter through a large amount of data. The classic method available in most Linux distributions is to search using the grep command followed by a regular expression. One easy search is simply typing grep and then quotation marks representing whatever you are looking for. For example, to search for user “user muniz,” use the command grep “muniz” followed by the file being searched.
Sample command: grep “muniz” /var/log/auth.log
Results example: Accepted password for muniz from 10.2.2.5 port 4525 ssh2
The challenge with the standard grep search approach is constructing a regular expression that will get the results you desire. For example, let’s say you are searching for a specific port and put that number in grep search quotation marks. Anything that contains the same numbers is also identified, such as URLs, timestamps, and so on. You need to practice using regular expression concepts to perfect capturing the results you desire using this approach.
Another useful search is looking at what appears before or after a key search term. For example, if you want to see details for failed login users, you can display the text before or after that term. This is done using the grep surround search. An A flag represents the line after and the B flag represents the line before. The following example searches for details about failed users, assuming you want the before text for the timestamp and after data for what was found:
Sample command: grep -B 3 -A 2 ‘Invalid user’ /var/log/auth.log
Results example: May 15 11:14:11 ip-10.1.2.2 sshd[12345]: <b>Invalid user,/b? admin from 22.15.32.106
There are many other grep command regular expression options, which you should learn if you plan on manually investigating logs. A simple Google search brings up dozens of recommended grep commands to help master grep regular express techniques.
Beyond grep, you should also be aware of a few other Linux commands for text parsing and analysis. The first command to highlight is the cut command to parse fields from delimited logs. Delimiters are characters like commas and equal signs used to break up fields or highlight key-value pairs. This is extremely helpful for developing lists from results within logs. Let’s say you want to pull values that follow the sixth equal sign from a particular log. You could use the following cut command to quickly accomplish your goal. Imagine your goal is to display all the usernames from a large log listing logins for the last month:
Sample before text: muniz(su:auth): authentication failure: logname=muniz uid1000 euid=0 tty=/dev/pts/0 ruser=muniz rhost= user=root
Sample command: grep “authentication failure” /var/log/auth.log | cut -d ‘=’ -f 6
Results: root
Another parsing option is using the awk command to filter out anything that is not relevant. For example, you may want to view any failed login attempt from an authentication log. The awk command also uses regular expressions, so you could use awk followed by /sshd. *invalid user/, which will match the sshd invalid user lines. Next, you want to print the ninth field using the default delimiter of space. The following example shows how to do this:
Sample command: awk ‘/sshd.*invalid user/ ( print $9 )’ /var/log/auth.log
Results: root
Using an enterprise log management or SIEM tool that can simplify this type of data mining will make life easier for you. This tool might not be capable of reading the log format, making understanding the manual process critical to move forward with your investigation. Another option is to customize the log to meet the format of the log reader. You may manually develop your method to clean up the data and script the process into a custom parser, which will take in the foreign format and modify it to something the log reader can leverage. Customizing parsers can be very tricky, depending on the tool being used, and likely will require specified services from the manufacturer of the tool.
Network Baselines
Another approach to monitoring a network for security events beyond using signatures and logs is leveraging baselines. The concept works by measuring the performance of traffic and establishing what is considered normal. This way when something unusual happens, it tends to stand out. This approach has been used for many years to detect irregular network performance such as a system going down or traffic congestion. A more recent tactic used by some security vendors is applying security detection rules against unusual behavior to help administrators identify threats that attempt to hide or have bypassed traditional signature detection. An example is network scanning by unauthorized devices or an unusual encrypted tunnel being established from a system that contains sensitive data. We go into this issue further later in this chapter when we look at identifying compromised behavior like beaconing.
To establish a baseline, you must have a method to tap into the network. This can come from specifically placing network taps or leveraging traffic from existing network equipment. One popular approach to building a network baseline is leveraging NetFlow from existing network gear, as described earlier in this chapter. Also, many other security technologies such as SIEMs and IPS/IDS offerings include a form of baselining to help improve detection. Those devices tend to baseline traffic as it crosses the solution inline or off a SPAN port.
As an investigator, you need to identify if baselines have been established. These are helpful to measure against as you compare security events that are triggered based on unusual behavior. For example, if malicious software is identified on a few systems, it would be helpful to see how those systems measure up against other usual system network behavior. You could use those deviations as a means to filter on to identify other compromised systems. Figure 8-9 shows tracking malware within a network based on flagging a deviation of unusual traffic, developing a signature, and matching that behavior to highlight systems that show similar infectious behavior.

Specific unwanted behavior could be automatically or manually developed into rules that trigger warnings when associated behavior is seen. For example, unauthorized tunnels, protocols, or other behavior of interest from specific parts of the network could trigger alarms, helping an investigator narrow down where to look for potential risks to the organization. Figure 8-10 shows an example of this called Host Locks found within Cisco Stealthwatch. The same concept should apply to other NetFlow-based security technology.

Figure 8-10 Cisco Stealthwatch Host Lock Example
Now that you have a basic idea of the security technologies you are likely to encounter during an investigation, it’s time to look at the symptoms of threats. This allows you to not only understand the characteristics that security tools are looking for but also help you manually look for threats when tools are not available.
Symptoms of Threats
Many things could represent a threat. Sometimes this activity falls outside usual behavior, but other times it could be hidden within normal traffic. We can’t cover every possible characteristic or unusual behavior you will encounter. We can, however, touch on some of the most common things that represent a threat on the network and help you learn how to hunt for such activity. You will likely use security tools to handle most of the hunting, but we demonstrate the manual concepts for the examples we present to you for reference purposes. It is more important that you focus on learning to understand how and why specific traffic is considered a concern. This way, you can interpret data from systems that have generated event logs, combine findings from different tools, and follow evidence as it presents itself. It is unlikely you will be blindly monitoring raw network traffic without any understanding of what you are looking for. That behavior tends to fall under a penetration testing exercise.
Let’s start with the first common malicious activity you should investigate if found within the network that tends to indicate an attack is coming. That behavior, as stated by the Lockheed Martin Cyber Kill Chain model, is reconnaissance.
Reconnaissance
It is common for people or applications that breach an environment to perform scanning. The attacker likely does not know where she is upon first accessing the unknown network and either wants to find other systems to infect, move to other parts of the network, or identify data to steal. Think of a system looking to understand the network so it can make its next move, which could be exploiting other systems or listening for useful traffic.
You can detecting reconnaissance by looking for scanning, such as unusual peer-to-peer communication. It could also be identified as spikes in traffic due to a bunch of traffic coming from one system attempting to learn the network. Another detection approach is to alarm when connections are seen accessing unusual ports, which could represent an attacker attempting to identify vulnerable methods of communication to exploit. This is known as a port sweep, meaning the attacker is evaluating other systems for open network ports.
A port sweep is one of the most common forms of reconnaissance behavior. There are different types of port sweep activity that range in stealth and aggression. You should familiarize yourself with some of the basic port sweeps using NMAP and Wireshark. This can be done by launching Wireshark from your Kali Linux system and monitoring various NMAP scans from your system. We recommend you use this approach to view common scans such as FIN, XMAS, SYN, and so on, to better understand the footprint they leave within packet captures and logs. You can check out the NMAP home page found at https://nmap.org/ as well as many sources available online for quick reference guides for using NMAP. In Figure 8-11, a standard port scan and an XMAS scan are run against a specific system. Make sure you are able to identify the indicators of this behavior, such as the repetitive resource requests and highlighted flags that changed between these two port scan types.
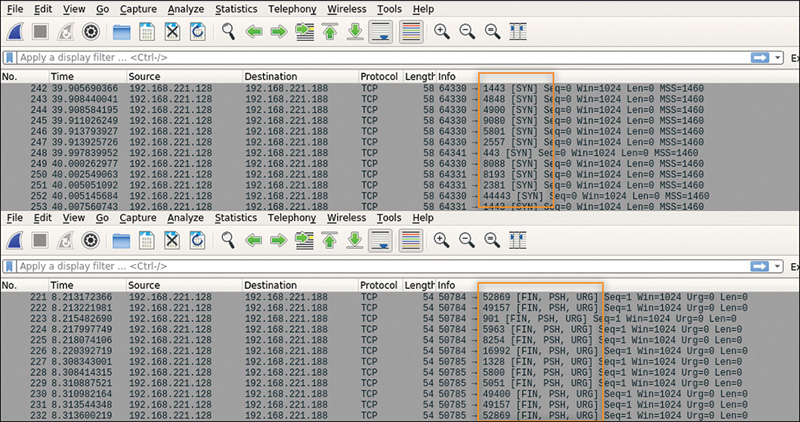
Figure 8-11 Wireshark Capture of Port Scan
You don’t need to memorize how each scan would look, but you do want to be familiar with the fingerprint of a port scan so that you can pick it out from other traffic. You will likely have to dig through tons of packets for malicious behavior. To accomplish this, you can use tools like Wireshark, which includes filtering options. For example, you could use the Wireshark filter tcp.flags.syn && tcp.flags.ack==0 to identify a bunch of SYN flags without an acknowledgment. You could also catch this behavior using other filters such as looking for ports not opened by a specific IP address using ip.src==192.168.1.20 && tcp.flags.reset && tcp.flags.ack. The goal is to realize behavior from an endpoint that appears to be looking for new targets or methods to communicate that is likely to be buried within lots of network traffic. We recommend you spend time trying to understand the filtering options in whatever tool you use and research captured traffic so that you know how to filter for port scanning activity.
Most administrators do not manually view packet captures all day, looking for the hundreds of types of scanning behavior that could exist anywhere within the network. Usually, security solutions can detect most forms of network reconnaissance that takes place within an unauthorized area. A common tool is IDS or IPS monitoring for internal peer-to-peer communication leveraging various security signatures or rules. For example, Figure 8-12 shows detection rules available within the Snort IDS software. This example uses a pre-parser Snort rule that can be leveraged to detect most NMAP scans. To use this rule, you need to uncheck the port scanning rule within the Snort.config file because it is not active by default. That rule is Preprocessor sfportscan: proto {all} sense_level {high} logfile {LOCATION}, where you need to adjust the bracket fields to your Snort environment. Figure 8-12 shows a log generated by Snort due to identified Xmas scanning activity.

Figure 8-12 Snort Detecting a Port Scan
To give you an enterprise IPS view of this type of behavior, Figure 8-13 shows Cisco Firepower identifying similar port scanning behavior using its IPS capabilities. In this example, a few different types of scanning are happening, which the administrator could click to gather details, such as source, destination, and geolocation.

Figure 8-13 Firepower Detecting a Port Scan
It is likely the security tools that detect scanning behavior log these events and export them to a centralized manager such as a SIEM. Your job as an investigator may be to identify and link reconnaissance behavior to threat actors as a method to understand the scope of a network compromise. In some situations, antivirus software may not be catching a malicious file, so your best method to identify infected systems is to map any known infected system to the network that it has access to and that it has scanned. You may also need to validate malicious files using a sandbox and monitor the file for beaconing and reconnaissance behavior to learn its tactics for spreading. Make sure you become familiar with how network reconnaissance looks because it’s likely something you will need to investigate.
Exploitation
Attackers typically exploit vulnerabilities to gain access to systems and networks. Exploitation could be anything from opening an unlocked door to gaining root access to a system that is running out-of-date software by injecting malicious code. This means exploitation is an action against a weakness, not the result of the attack. Results of an attack could be planting a backdoor, stealing data, and so on, which happen due to a successful exploitation of that system or network.
It is important to understand exploitation behavior so that you can properly identify it. For example, breach detection technology such as NetFlow and honeypots are not designed to look for exploitation. Technologies that look for and prevent exploitation are antivirus, intrusion prevention, and other technologies that target attack behavior through signature and attack behavior triggers. Figure 8-14 shows a Kali Linux system using Armitage to exploit a struts vulnerability on an Apache server. The result of this exploit is providing the attacker root access privileges to the victim’s system. This is demonstrated in the terminal window showing root when the attacker validates his access privilege level by issuing the command whoami.

Figure 8-14 Armitage Exploiting an Apache Server
It is likely that you will investigate various forms of exploitation. Most of the time, this behavior is identified by tools, which means you are reading security logs and attempting to understand what exactly happened. Your goal is to identify what was vulnerable, research the risk associated with that vulnerability, and figure out the result of the attack. This information can help you determine your next course of action, which may be to search for other systems with a similar vulnerability or other logs demonstrating similar attack behavior, or to investigate systems that are likely impacted by this attack using breach detection tactics.
Most tools that provide you details of exploitation do so through triggered attack signatures. This means tools like antivirus and IPS would be likely places to view logs representing exploitation. In Figure 8-15, a Cisco Firepower IPS log shows the attempt to exploit a struts vulnerability in the Apache Server presented in Figure 8-14.

Figure 8-15 Cisco Firepower Showing Exploitation Detection
Logs such as these typically map out the system being targeted, the source of the attack, associated ports, and so on. Basic detection tools such as Snort IDS/IPS provide this data in various independent log events while enterprise tools correlate attack behavior and offer methods to research the event further. For example, Cisco Firepower permits you to access various data points within this event to provide even more details so you don’t have to manually go through multiple independent log messages. If you were investigating this incident, you could click the source IP address of the system being targeted with the goal of learning details on this system, including potential vulnerabilities. Figure 8-16 shows details of a system that could be pulled when clicking the IP address of a log. Many enterprise security tools, ranging from SIEMs to intrusion detection platforms, offer these capabilities, which help an investigator quickly understand what occurred and provide details about the systems involved with the incident.
Various resources on the web could be used to gain details on identified exploitations and vulnerabilities. The industry tends to label security signatures with a Common Vulnerabilities and Exposures (CVE) value so that different vendor tools can have a common language when talking about the same attack. This is important not only for administrators to understand what is happening as events are generated, but also for tools that provide data correlation and data sharing from threat feeds to work together. For example, you may hear about a threat and be concerned that you are vulnerable to that attack. By having the CVE for detecting the threat, you could search for that value within your security products to see whether detection for this threat is enabled. You could also ask your vendor how to gain protection if you are seeing it in the available rules.

Note Some vendors do not disclose details of detection for certain CVEs until there is a known fix for the vulnerability and the vendor feels that specific patch has been available long enough for customers to install it. At Cisco, we hide certain detection capabilities within rules that have generic names when this is needed, so we don’t educate attackers on high-risk vulnerabilities that don’t have patches. We recommend speaking with a vendor about CVEs of concern to see whether they are hiding such details with the goal of protecting the products that are vulnerable to the attack.
An attack signature will likely specify limitations of the attack so you know the types of systems, services, software, and protocols that are required for the attack to be successful. This is extremely important to know because launching an attack doesn’t always mean the attack will be successful. It is common for investigators to find many unsuccessful attacks against systems, which means exploitation was attempted but nothing damaging occurred as a result. Knowing this also helps you narrow down your focus on investigation; if you identify a threat that is linked to a known CVE, you can focus in on required things like services to dramatically improve visibility for that attack.
You will likely have to document exploitation attempts to help your customer understand why you believe the attack was successful or not. This means explaining the type of attack attempted and the potential for it to be successful. An example many administrators had to deal with was the concern about an exploit tagged by the industry as Heartbleed. This exploit abuses a vulnerability in OpenSSL, which is a programing mistake in the OpenSSL library. You can find details on many exploits such as this by searching for the CVE on the Internet or using the national vulnerability database found at https://nvd.nist.gov/vuln/. You can test a search on Heartbleed’s CVE, which is CVE-2014-0160. Figure 8-17 shows the CVE for the Heartbleed attack.

In this example, systems must be using OpenSSL, or the attack won’t work. Systems must also be connected to the Internet because internal actors would not leverage this attack. This eliminates any systems that don’t have Internet access or that do not use OpenSSL from being potential victims of this attack. This type of filtering simplifies investigating identified CVEs. We personally had to deliver talks about this specific attack to many customers who were not leveraging such services and therefore were assured they were protected from this specific threat.
Another more current example is the WannaCry ransomware attack, which leveraged a Server Message Block (SMB) protocol exploit known as ExternalBlue. Once again, the first step to identify this type of attack is knowing that SMB is required for WannaCry to be successful using the ExternalBlue vulnerability. Systems not running SMB or that had the vulnerability patched would not be exploited. As simplistic as this may sound, it is important to identify the key elements required for a vulnerability to be exploited so that you can eliminate any system that couldn’t possibly be exploited. This leaves you with the remaining systems to evaluate for potential compromise. Be prepared to follow this process when investigating exploitation. The process includes reviewing attack signatures, researching the associated CVE, and pivoting your research based on the features of that attack.
Malicious Behavior
Sometimes malicious behavior such as exploitation takes place against systems without security detection in place, or the exploitation tactic is unknown to the existing detection systems. A prime example is zero-day attack. This type of attack exploits a vulnerability the world hasn’t seen yet; therefore, nobody has written attack signatures for it. To be clear about real-world threats, it is more common for security products that are not properly tuned to miss known attacks and therefore don’t have the proper attack signatures enabled versus the organization you are investigating being breached by a zero-day attack. In either of these situations, the next line of defense would be to use security tools designed to identify general malicious behavior.
Following are some examples of generic behavior you should be monitoring for in the event an existing attack-signature-based technology fails at detecting threats. Consider these breach detection tactics that many internal network monitoring tools should have enabled:
![]() Watch for any connection attempt from a reserved IP address because these IP addresses shouldn’t be used. A detection rule could be developed to check the source address field in an IP header for this.
Watch for any connection attempt from a reserved IP address because these IP addresses shouldn’t be used. A detection rule could be developed to check the source address field in an IP header for this.
![]() Flag any packet with an illegal TCP flag combination. A detection rule could be developed to compare the flags set in a TCP header against known good or bad flag combinations. We describe examples of this in the earlier reconnaissance section.
Flag any packet with an illegal TCP flag combination. A detection rule could be developed to compare the flags set in a TCP header against known good or bad flag combinations. We describe examples of this in the earlier reconnaissance section.
![]() Watch for any type of DNS buffer overflow attempt contained in the payload of a query. A detection rule could be developed to parse the DNS fields and validate the length of each field.
Watch for any type of DNS buffer overflow attempt contained in the payload of a query. A detection rule could be developed to parse the DNS fields and validate the length of each field.
![]() Flag any denial of service attacks on a POP3 server caused by issuing the same command numerous times. A detection signature could be developed to track the number of times the command is issued and to alert when that number exceeds a certain threshold.
Flag any denial of service attacks on a POP3 server caused by issuing the same command numerous times. A detection signature could be developed to track the number of times the command is issued and to alert when that number exceeds a certain threshold.
![]() Flag file access attacks on FTP servers by monitoring for file and directory commands to the server without first logging in. A detection rule could be developed to monitor FTP traffic for a successful login and alert if certain commands were issued before the user authenticated properly.
Flag file access attacks on FTP servers by monitoring for file and directory commands to the server without first logging in. A detection rule could be developed to monitor FTP traffic for a successful login and alert if certain commands were issued before the user authenticated properly.
![]() Watch for spikes in bandwidth consumption. Detection rules can be put in place that trigger when bandwidth thresholds are exceeded.
Watch for spikes in bandwidth consumption. Detection rules can be put in place that trigger when bandwidth thresholds are exceeded.
There are many attack events to consider, which is why most professionals leave rule writing to companies with large teams that can stay on top of the continuously changing attack use cases. When you are investigating malicious behavior found within security tools like an IPS, these types of logs likely do not have an associated CVE because they are generic malicious behavior versus a specific known exploit.
Note National Institute of Standards and Technology (NIST) published a guide for IPS deployment and use cases at http://nvlpubs.nist.gov/nistpubs/Legacy/SP/nistspecialpublication800-94.pdf. The purpose is to help you better understand IDS and IPS technology in regards to exploitation and malicious behavior.
You can use manual methods to investigate malicious behavior rather than looking at event logs. For example, let’s say you are investigating the system of a user who clicked a malicious web link and was exploited by a remote exploit kit. The first stage of your investigation may be targeting web usage and web attacks seen within a content filter, application layer firewall, IPS, or another tool that sits between the user and Internet. If you are looking at a packet capture of this user’s traffic, you could look for weird behavior, such as shown in Figure 8-18, where you see a “302 moved” event; this means the user was redirected somewhere. Typically, attackers redirect victims to an exploit kit that is designed to scan for specific vulnerabilities it can exploit. You could look deeper into the redirection and check the “credit score” of the source; in other words, you would see if that site is known for malicious behavior. The Cisco Umbrella Investigate solution is a great tool to look up this type of data.

Figure 8-18 Wireshark Showing Redirecting Behavior
You could continue to follow the TCP stream and look for things like scripts being run against the target system as well as other things that would indicate unusual activity has occurred. For example, Figure 8-19 shows a highlighted iframe exploit being sent to the victim’s system.

What could follow this behavior is an attacker gaining access to the system, beaconing from a compromised system representing malicious software that is installed as it phones back to the remote attacker or other use cases. The value of diving into these details is that doing so not only helps you see exactly what happened but also better understand how the exploit worked so that you can develop a detection rule for a security tool like an IPS to prevent future compromise.
Speaking of post compromise and beaconing, let’s investigate phoning-home behavior.
Beaconing
The term beaconing is sometimes mixed with other attack behavior such as command and control, phoning out, or other attack terms. The basic concept is that something is attempting to communicate back to a resource outside the network. The result could be to download exploit code to use within the network, provide an external party inside access, or alert a botnet manager that a host is ready to be remotely controlled. Attackers can beacon to exit a network over HTTP, HTTPS, or DNS. They may also limit which hosts exit a network by controlling peer-to-peer beacon payloads over Windows named pipes. Beacon attacks can be flexible and support asynchronous or fully interactive communication. Asynchronous communication is extremely slow and difficult to detect. The infected system phones home, downloads additional instructions, and goes to sleep, so there are no constant communications. Figure 8-20 shows how a security professional or an attacker may use a beacon tool to remotely interact with a victim.

Studies show that around 90 percent of malicious software that compromises a network will beacon out, so you are likely to see this behavior from threats that bypass your perimeter. We find a lot of infections that beacon out are hidden within junkware, which is software that offers enough value to trick a user into installing it while it really is a front for malicious software. Figure 8-21 shows a fake antivirus program that could not only harm the system where it is installed by shutting down security settings but is also likely to beacon out to a malicious party to inform it of the newly compromised system. We dealt with a situation in which an international branch of our team was using unauthorized proxy software to stream football (soccer) matches that were being blocked due to their country of origin. That proxy was a front end for a botnet, which our investigation team was notified about when traffic became really slow for everybody at that office.
As an investigator, you should understand how to identify beaconing behavior. One common approach that many security tools use is leveraging threat intelligence that includes known malicious sources. The security tool with this feature can monitor for communication to known malicious sources and trigger an alarm if it finds any matching connections. Most threat feeds categorize malicious sources into different categories, so if you see a connection to a botnet, it is likely you know the type of malicious code installed on the victim’s system. In Figure 8-22, Cisco Stealthwatch highlights two systems with identified communication to known command and control sources.


Another detection tactic is looking at outbound communication. Things to consider are the use of unusual ports or protocols such as traffic not normally sent to the Internet. If you are lucky, the outbound patterns will be obvious to detect, such as in Figure 8-23, where LogRhythm SIEM identifies Powershell Empire beacon behavior that is pretty noisy on the network.
It is common for beacon behavior to be a bit stealthier, such as using smaller packets over a long period of time, which represents the malicious program in the sleep state. If you measure this traffic over a period of time, it could be represented as a heartbeat behavior similar to what is shown in Figure 8-23, but with a lot more time extended between heartbeats to avoid detection. An example is shown in Figure 8-24, where a beacon every 30 minutes to the same source over port 443 means this beacon would hide within normal network traffic.

Figure 8-23 LogRhythm Showing Beaconing

Figure 8-24 Delayed Beaconing
Tracking this stealthy behavior can be challenging in a large network with various types of traffic. One approach that you can use is to specify filters based on timing and variance with a reasonable tolerance for both. Tools that monitor packet captures and NetFlow can be very helpful in playing back traffic and helping you zero in on deviations from your set filters. For example, you could limit to 100,000 TCP SYN connections and target anything that shows beaconing with intervals greater than 60 seconds for a traffic capture that is three to five days long. You could continue to adjust filtering until something stands out. Similar behavior may show up from multiple systems representing these hosts as all being infected by the same malware. Figure 8-25 shows an example of this. In this example, other characteristics give it away, such as rotating ports and different addresses being used by the slow beaconing behavior; here, the malware is not only breaking up the heartbeats but also attempting to change the ports being used. The filtering approach could help you highlight the top systems of interest, so you could view associated traffic to further prove your conclusion that beaconing exists.

Figure 8-25 Filtering on Hosts That Are Beaconing
The manual process can be challenging, but if you find during your investigation that malware is likely to exist, this approach may make sense to perform. Our recommendation is to either leverage a tool that automates this filtering approach of analyzing traffic such as an enterprise packet capture or NetFlow tool, or take a capture of traffic and apply timing and variance filtering to identify systems that stand out as performing beaconing behavior. You need to decide the minimum and maximum number of connections that qualify as potential targets of interest. You can also look at the number of systems that reach out to a specific external host. The goal would be to find only a small number of users accessing a unique website representing the malicious source versus a website like Facebook being accessed frequently. The final filter you could use would look at variance, or the delay between heartbeats to catch malware in the sleep state doing periodic beaconing. You could also filter out certain ports that wouldn’t make sense to consider, such as port 25, which is used for email. What will likely happen during investigations is that you will catch the source of beaconing using malware detection or domain reputation techniques before you see the beaconing behavior. It is important to understand how to detect beaconing when those other security tools fail at detecting the threat.
Brute Force
If attackers can’t exploit a system, they may attempt to brute force their way through. A brute force attack works by attempting multiple passwords with the hope of stumbling upon the correct access credentials. A traditional brute force uses a dictionary attack; it uses lots of random words found in the dictionary. Another flavor of this attack is using a rainbow table, which is a list of hash results of words from the dictionary. The reason for using a rainbow table is that the attacker may see the final hash of the password and attempt to compare that to a rainbow table full of hash results with the hope of finding a match. When a match is found, the attacker can identify the word used to create the matching hash and apply that as the victim’s password.
Note Brute force attacks require lots of time and processing power to run. The most effective brute force attacks adjust the dictionary or rainbow table to the target, which dramatically improves results. For example, knowing a target is a male who likes football (soccer) could have the dictionary terms adjusted for that type of language versus a female who likes computer science or shooting guns. Social media word-harvesting tools like Cewl are great for developing custom word lists!
Brute force attacks can have characteristics you can search for. The most obvious is multiple login attempts from a single IP address using different usernames and/or a username using multiple passwords. Best practice for authentication is to permit only a few attempts to log in and use timeouts, but not all administrators follow this best practice, thus opening the door for brute force attacks. In Figure 8-26, Wireshark identifies a brute force attack via multiple passwords being used by a single user.

Figure 8-26 Brute Force Wireshark Example
In Figure 8-26, it is important to notice the error message seen during this attack. On the right, you see a 530 alarm for an unsuccessful attempt, whereas a successful login would generate a 230 alarm. As an investigator, you should identify this failed and successful login behavior when investigating a brute force. This way, you can determine how many attempts were made against the system, compare this trend against other system accounts, and most importantly, see whether any attack attempts were successful, which indicates the malicious party gained access to the system.
Gathering the details of a brute force attack is important for the recommendations you will likely provide to help your customer prevent future brute force attacks. That recommendation likely is limiting the approved login attempts before a timeout is issued as well as adding monitoring and alerting for this type of behavior if tools don’t already exist. Figure 8-27 shows the log from a Snort rule being triggered when multiple 530, or failed login, attempts are seen on the FTP server that was attacked in Figure 8-26. This rule is basic, hence the log results are limited to the systems involved, time of occurrence, and simple text displaying “FTP Bad Login!” Best practice is to develop a more sophisticated detection rule, which is common in enterprise detection solutions.

Figure 8-27 Snort Detecting a Brute Force
Exfiltration
One of the greatest fears that keeps many administrators up at night is the idea that sensitive data is leaving the network without their knowledge. This behavior could be in clear form or hidden within an encrypted communication channel. Typically, identifying the source of exfiltration means looking outside the view of an investigation and, in most cases, is considered lost data to the malicious party. This makes identifying and preventing exfiltration extremely important because it is a common result of a successful exploitation of a system or network.
Attackers will likely use common communication channels such as HTTP and HTTPS and compress, encrypt, and password-protect what is being stolen with the goal of hiding within the common network noise. To track this behavior, you can first use a similar approach as we covered for detecting beaconing by monitoring for established communication to unauthorized sources. This includes outbound communication to Darknet sources such as Tor. You could also monitor sources using geolocation technology; in other words, you flag any communication to countries that you typically don’t communicate with. For example, say a school based in North Carolina is seeing traffic to North Korea for the first time, which may not be bad but something to investigate if it involves things like tunneling and exporting data. Monitoring for unusual traffic will likely be established to catch various internal threats, including exfiltration behavior. This is also one of the recommendations that many vendors provide when identifying and preventing ransomware infections because malware typically needs to reach back to a remote source to initiate an asynchronous handshake.
Another approach to identifying exfiltration is evaluating deviations from established baselines, meaning new and unusual traffic such as large, sporadic bursts of traffic from users who have never sent traffic in that manner. Grouping user types into categories and baselining those categories can improve the effectiveness of this approach, which means having a more sensitive tuning for the average user versus a savvier technical group that would be expected to use technology such as TFTP and share lots of files. For example, finding SSH traffic from an administrator may not be as concerning as finding it from somebody in human resources because it is more likely this behavior is a risk when associated with the less technical user group and the type of content that people in human resources have contact with.
A similar approach is establishing thresholds; any time specific behavior is seen, an alarm is triggered regardless of whether any attack behavior has been associated. Examples include seeing more than a specific amount of data, data leaving during nonbusiness hours, data crossing a specific segmentation such as a host pulling data from the data center into a network associated only with printers, and so on. These baselines can be established using NetFlow, security tools such as application layer firewalls, or other security monitoring technology. In Figure 8-28, Cisco Stealthwatch sets off an alarm when a specific threshold of data is identified as leaving the network from an unusual user category, such as an employee in finance exporting more than a gigabyte of data for the first time. In this example, we see all the traffic from the user that has been identified as potentially exfiltration data. It should be obvious from this viewpoint that there is something to be concerned about.

If you identify unusual outbound communication, you may need to investigate it. One common place to start is issuing a traceroute command to identify the path to the source of interest. You could also focus on the DNS information by using the domain information grouper, aka the dig command. In Figure 8-29, the dig command is run against www.cisco.com.

Figure 8-29 dig Example for www.cisco.com
Dig helps you find authoritative DNS servers for a domain, but you might want to see what hosts have entries on that domain. For example, maliciouswebsite.com may have various other hosts such as sharepoint.maliciouswebsite.com, maliciouswebsite.mail, or something else that could help you understand more about the source data is flowing to. One tool that you can use to pull all DNS entries if zone transfers are allowed is Fierce. Fierce is available in Kali Linux and run by typing fierce.pl -dns <target>. For example, you could use the command fierce.pl -dns thesecurityblogger.com to pull all DNS entries from www.thesecurityblogger.com, as shown in Figure 8-30.
An alternative enterprise solution for gathering deep DNS information about a source is the Cisco Umbrella Investigate technology, which we cover in more detail in Chapter 11, “Cisco Forensics Capabilities.”
Finally, data could be leaked in other ways that are outside of network forensics. Examples include using USB portable drives, over email, and so on. We also touch on email and host network logs in Chapter 10, “Email and Social Media,” to give you more details on those concepts. Data loss prevention technologies are yet another approach that tags files with specific trust levels and monitors movement to control exfiltration of data that is considered sensitive. Such details would come directly from the management platform of the data loss prevention technology.

Figure 8-30 Fierce Example for www.thesecurityblogger.com
To summarize exfiltration forensics, you will likely use one of the following approaches. You could look for communication to unusual external sources using reputation or threat feeds containing known malicious sources. You could also use geolocation technology or monitor for unusual ports or protocols. Another approach is baselining normal traffic and looking for deviations that could indicate exfiltration. Lastly, you could leverage some form of data loss technology that zeros in on monitoring sensitive data and notifies you when that data is seen being removed. Enterprise technology helps for this type of investigation work, but you could also take a capture of traffic and filter for this type of behavior.
Other Indicators
There are many potential indications of a security event that you will encounter as you investigate networks. Some may be very specific to the environment based on research performed by the attacker. An example is malicious software designed to bypass sandboxes by evaluating the surrounding environment for virtual container characteristics. Sometimes an environment such as a highly secured network will not permit protocols common on most networks such as DHCP, making any sign of DHCP within this environment an indicator of a potential threat. In many cases, baselines, security logs, and experience can help you zero in on potential targets that you can further investigate.
Following are some other common indicators of compromises you should look out for as you investigate networks:
![]() Denial of service attacks used to consume traffic from a targeted system
Denial of service attacks used to consume traffic from a targeted system
![]() Unwanted activity such as bitcoin mining or communication to dark networks
Unwanted activity such as bitcoin mining or communication to dark networks
![]() Unauthorized or unusual encryption within or leaving the network
Unauthorized or unusual encryption within or leaving the network
![]() Network attacks such as man-in-the-middle communication indicated by increases in TTL values
Network attacks such as man-in-the-middle communication indicated by increases in TTL values
![]() Network performance complications
Network performance complications
![]() General unusual behavior found by comparing against baselines
General unusual behavior found by comparing against baselines
![]() Unauthorized or unusual user behavior (Group use types into authentication groups such as sales, engineering, and human resources to help determine which users should be accessing what type of data.)
Unauthorized or unusual user behavior (Group use types into authentication groups such as sales, engineering, and human resources to help determine which users should be accessing what type of data.)
![]() Change in environment such as new systems, users, or traffic (temporary or permanent)
Change in environment such as new systems, users, or traffic (temporary or permanent)
![]() Rogue devices such as wireless access points, mobile systems like a Raspberry Pi, and so on
Rogue devices such as wireless access points, mobile systems like a Raspberry Pi, and so on
Learning to identify these and other threats will come with experience. The best way to gain that experience is to participate in capture-the-flag exercises, which represent situations similar to real-world security events. As an attacker, you can learn the tools used to accomplish your goal, which includes predicting what defenses are being used by the opposing party. As a defender, you can practice your detection and investigation skills. Here are a few sources that are available to practice these skills:
![]() https://microcorruption.com/login
https://microcorruption.com/login
![]() https://www.hellboundhackers.org/
https://www.hellboundhackers.org/
![]() http://overthewire.org/wargames/
http://overthewire.org/wargames/
Summary
This chapter provided a foundation for performing network forensics. Many of the topics we covered here have entire books dedicated to them, so we just scratched the surface of what you should know as a forensic investigator. We first provided a brief introduction to networking concepts by looking at commonly used ports and protocols. Next, we reviewed popular security technologies and the types of forensic value they can provide. We looked at two types of data sources you are likely to review during an investigation, which are security logs and network baselines. Then we wrapped up the chapter by reviewing how to investigate typical attack behavior that ranges from earlier indicators of a potential threat to post breach behavior.
We encourage you to continue learning about network and security concepts through certification and study. The more you know, the more likely you will be able to successfully investigate a security incident. In the next chapter, we switch our focus to investigating mobile and web resources.
http://searchsecurity.techtarget.com/definition/firewall
https://www.symantec.com/connect/articles/network-intrusion-detection-signatures-part-one
https://help.deepsecurity.trendmicro.com/Events-Alerts/syslog-parsing.html
https://www.iana.org/assignments/service-names-port-numbers/service-names-port-numbers.xhtml
https://stackoverflow.com/questions/16047306/how-is-docker-different-from-a-normal-virtual-machine
https://www.cisco.com/en/US/technologies/tk648/tk362/technologies_white_paper09186a00800a3db9.html