Chapter 6
Finding the Data: Documents and Reports
IN THIS CHAPTER
![]() Discovering how to use the Securities and Exchange Commission’s EDGAR database
Discovering how to use the Securities and Exchange Commission’s EDGAR database
![]() Putting financial data into a format that can be analyzed
Putting financial data into a format that can be analyzed
![]() Keeping in touch with news and other important non-financial data
Keeping in touch with news and other important non-financial data
Investment bankers make a business out of knowing other companies’ business. Part of being a dealmaker requires a deep knowledge of what companies are up to, what their CEOs are trying to accomplish, and what goals organizations have.
But investment bankers can’t afford to sit in their high-priced skyscrapers and wait for CEOs to call them, looking to do a deal. Investment bankers need to be proactive, scanning the world for mergers that would make sense, divestitures that would save companies money, or financial instruments that don’t yet exist, but could.
Part of this role of investment banking requires investment bankers to have a good grasp of the financial and non-financial information about the corporate world. It doesn’t take much guesswork to know which companies need to grow to keep their shareholders happy, which ones could drive profits higher with a well-designed merger, or even which private companies could turbo-charge growth with an initial public offering (IPO).
But knowing what investment banking needs companies have — often even before the companies themselves realize it — takes a strong ability to unearth all the information possible about companies and industries. And that’s the job of this chapter. Here, you find out how investment bankers can learn about companies in a hurry, getting up to speed on an industry and practically becoming experts without even leaving their desks.
Much of the data that investment bankers need are stored on the system operated by the chief securities regulator, the U.S. Securities and Exchange Commission (SEC). But getting your hands on the data is only part of the trick. Next, you need to know how to get the data into a format that can be put through the rigors of investment banking research. This chapter also shows you how to get your hands on the non-financial data, which can be as important (if not even more critical) to investment bankers.
Finding What You Need on the Securities and Exchange Commission’s Website
Edgar Allan Poe may be known for his stories of mystery and suspense, but there’s another Edgar, one that’s much nearer and dearer to investment bankers’ hearts (yes, they have hearts!). This Edgar has the job of removing mystery from company information.
The SEC, the unit of the government responsible for overseeing the securities business, operates a database known as EDGAR, short for Electronic Data-Gathering Analysis and Retrieval. The EDGAR database is the best friend of many investment bankers who are trying to research companies and understand the very fine subtleties of their businesses.
What types of information you can find
The SEC performs all sorts of functions to insure the smooth and efficient functioning of the financial system. The SEC inspects companies’ accounting, looking for funny business, and supervises the issuance of new securities. The SEC’s role of running the EDGAR database, though, is of utmost importance to investment bankers. This database is the wellspring for information that drives many investment banking activities.
The EDGAR database is essential for investment bankers because it contains
- The key financial filings that companies provide: Looking for a company’s annual report or quarterly statement? These forms and many more are all stored on EDGAR and are accessible anytime and for free online.
- Reports showing who owns large pieces of companies: If you buy a stock, if you’re like most people, that’s a matter between you and your accountant. But large investors — those with $100 million or more of other people’s money to invest — have to provide a report called a 13F, showing their funds’ holdings. These documents can be telling for investment bankers looking to monitor the movements of large and influential investors. Similarly, investors who own more than 5 percent of a company must disclose that holding in EDGAR on a 13D filing.
- News events and internal corporate details: Popular media outlets can be vital sources of news. But when a new development is extremely significant, companies must disclose them in the EDGAR database as an 8-K filing. Similarly, the juicy details about a company, including how much the executives are paid, are also available in EDGAR in the DEF 14A filings.
 Remember the SEC typically only has detailed data on publicly traded companies or companies with debt owned by public investors. Private, or closely held, companies are those owned by a relatively small number of private investors, where the shares aren’t available on a public market.
The key types of documents
EDGAR is an enormous database. Every day, companies submit scores of electronic filings to EDGAR, where they’re stored and made available to anyone in the public who wants to view them.
The filings pour into EDGAR because companies and other registrants are required to provide documents to investors and regulators and meet deadlines set by the SEC for compliance.
There’s a massive number of possible forms that companies and investors may have to submit. Some of the regulatory forms are pretty obscure, so they’re rarely filed. If you’re a glutton for punishment, or you’re having trouble falling asleep, you can read a list of every single document that can be filed into EDGAR at www.sec.gov/info/edgar/forms/edgform.pdf. But to save you the trouble, in this section we tell you about the regulatory filings that matter most to investment bankers.
Annual report (10-K)
Companies’ annual reports used to be beautiful colorful documents that were magazine-like and mailed to investors’ homes. Those days are quickly fading away as the functional needs of real-time investors push aside the form of beautiful financial documents.
The term annual report is somewhat of a colloquialism. The actual document that matters, which companies release each year to describe how they’re doing, is known by its regulatory name, the 10-K. The 10-K is an often lengthy, comprehensive document that describes the company’s performance over the past fiscal year. The 10-K is extremely detailed and must be looked over by an accounting firm before being submitted to EDGAR. The 10-K provides the numerical data showing the company’s profits and the value of what the company owes and owns, as well as descriptive language highlighting how the company did.
Quarterly report (10-Q)
Publicly traded companies have several large burdens, one of the largest being to keep investors up-to-date on progress on a quarterly basis. The quarterly report, or 10-Q, is the regulatory document in which companies give investors a rundown of their performance over a three-month period. The quarterly report isn’t nearly as detailed as the annual report, but it gives the key data points from the period, including the financial statements. (We cover the financial statements in more depth in Chapter 7.)
Proxy statement (DEF 14A)
The proxy statement is one of the juicier regulatory filings. We’re not talking The Hunger Games or anything here, but the proxy statement, known by its official name DEF 14A, is where companies put many of the more salacious details about their operations. The purpose of the proxy statement is to present investors with a list of all the items that are up for shareholder approval, or a vote at the annual meeting. But included in this filing are endless goodies, including details on what the top management are paid. (We offer more details on reading the proxy statement in Chapter 7.)
Prospectus (S-1)
When a company sells shares to the public for the first time in an IPO, the document that matters most is the prospectus, or S-1. The prospectus contains all the information that investors should know before investing in a new issue. (You can read more about the prospectus and what it contains in Chapter 3.)
Interim report of material events (8-K)
Companies are constantly changing and evolving organizations. New developments, such as getting approval to sell a new product or canceling a big project, are potentially important for investors to know about because they can significantly impact the value of the stock. Whenever a company has non-public and material information — in other words information that no one knows about but that’s also important — it must be shared with the world. The way companies get the data out to everyone is the 8-K filing in the EDGAR database.
How to use EDGAR to pinpoint information
One of the greatest things about EDGAR is that it contains just about every piece of data on publicly traded companies (those that have stock that trades on a public exchange) and firms that have sold debt to the public. But the second best thing about EDGAR is the fact that it’s free. And even though EDGAR is operated by the government, you don’t have to wait in line to use it. In fact, you can use it right now.
The EDGAR database is extremely easy to use, once you figure out where to go and what to do. And that’s exactly what we explain in this section. It all starts at the SEC’s website (www.sec.gov).
Instead of giving you theoretical instructions on how to find a company filing, you can discover how to do it using a typical situation. Let’s say you’re an investment banker who’s trying to help a midsize healthcare company sell itself to a larger company. Your client wants to sell the company, rather than pursue an initial public offering, because there are other rivals working on similar technology. A delay in getting to market could mean the company could lose market share and not reach its potential.
That’s your challenge. You now need to start your research on companies that may be interested in making a deal. As an investment banker, you start putting together your short list of possible bidders, one of which is General Electric. But you can use EDGAR to strengthen your case. Here are the steps you’d follow to research one possible bidder:
- Go to
www.sec.gov. -
Click the Company Filings link, located just below the Search SEC.gov box in the upper-right corner (see Figure 6-1).
You’re taken to the EDGAR search page.
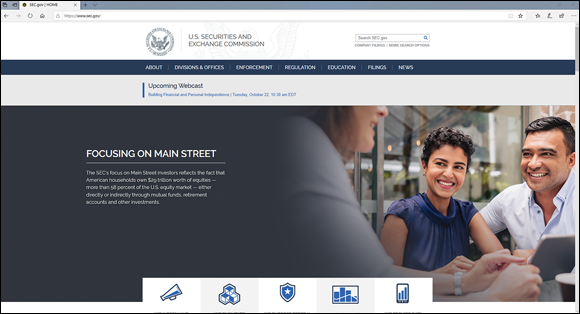
Source: U.S. Securities and Exchange Commission (
www.sec.gov)FIGURE 6-1: The Company Filings link on the SEC home page.
- In the Fast Search box on the right side of the page, enter the name of the company (in this example, General Electric) or the stock symbol if you know it (in this case, GE), and click the Search button.
-
Click the See All Company Filings link.
A giant list of all the company filings that are in EDGAR appears. With a company the size and stature of GE, there are, not surprisingly, all sorts of filings, including the ones described in the previous section.
-
Look through the list and start thinking about the filing with the information you seek.
When examining whether a company may be a potential buyer, what you want to know is how important the target’s industry is to the possible bidder (in this example, GE). GE has a large business unit that serves the healthcare industry. Getting the full details on the importance of an industry to a company is exactly the type of thing a 10-K is for.
- Look through the list of results in the EDGAR database (and this may take quite a bit of scrolling), until you find the 10-K listing (shown in Figure 6-2).
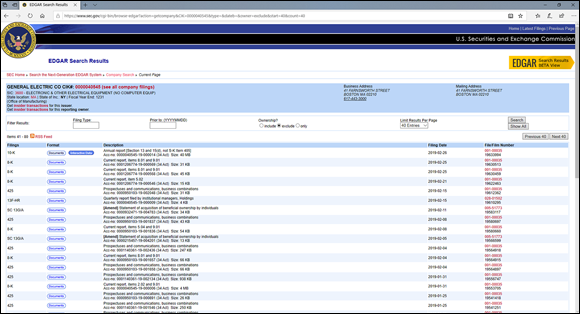
Source: U.S. Securities and Exchange Commission (
www.sec.gov)FIGURE 6-2: The EDGAR database listing shows you all the filings that are available for a company (in this case, GE).
-
Click the Documents link for the filing you’re interested in.
You’re taken to a listing of the data inside the 10-K filing. You can see what GE’s looks like in Figure 6-3.
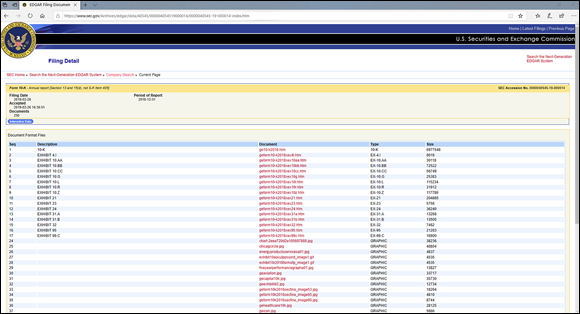
Source: U.S. Securities and Exchange Commission (
www.sec.gov)FIGURE 6-3: GE’s 10-K filing contains a number of documents.
-
Select the actual Form 10-K.
 Don’t be confused by the variety of documents. You want the Form 10-K, not one of the accompanying exhibits. In this case, click
 geform10-k2018.htm. You’re taken to the form. -
Drill down and find the relevant data.
After opening the document, it’s time to start sleuthing. Be sure to use the search function on your computer to find keywords. With a little bit of searching, you’ll soon find that GE describes its different industry units in a footnote (a detailed piece of financial data that doesn’t fit in the financial statements). Specifically, in this case, footnote 25 is the one to home in on. This footnote, called “Operating Segments,” describes GE’s healthcare unit, including the products it makes (such as magnetic resonance imaging and computed tomography devices).
-
Do the analysis.
Scroll down even further in the footnote and you’ll see a financial breakdown of all GE’s business units, including healthcare. It turns out, GE’s healthcare business hauled in $19.8 billion in revenue in 2018, making it the company’s fourth largest of seven industrial business units. That’s a significant fact and tells the investment banker that healthcare is of interest to GE. In fact, the healthcare unit grew by just 4 percent in 2018 — that’s pretty slow growth, especially compared to the 13 percent growth in the aviation unit. Perhaps a manager of GE’s healthcare unit would be up to discussing a merger that could reignite growth for them.
The preceding steps are just a hypothetical example, but they give you an idea of how the EDGAR database can be tapped to glean financial insights about companies of importance to investment bankers.
Getting Data in a Format You Can Work With
EDGAR can be a bit like catnip for investment bankers: They can’t get enough. When you start diving into the regulatory filings of companies, it’s not long before you’re checking the annual reports of competitors or diving into the latest stock moves of Warren Buffett.
But if there’s one shortcoming of EDGAR, it’s that the data aren’t exactly in the most perfect shape for analysis. The data contained in the regulatory filings aren’t typically presented in a format that’s easily analyzed. In a perfect world, the financial statements would be in a spreadsheet that could be crunched. But instead, the documents are stored in text files, which are fine for reading, but not so great for doing the kinds of analysis investment bankers are known for.
Don’t lose heart, though. In this section, we tell you how to transform the data-laden files of EDGAR into files that are just begging to be analyzed. Before getting your hands dirty with Microsoft Excel, though, it’s useful to see if any web-based tools can do much of the heavy lifting for you. If those tools fail, which may happen if your needs are unique, you need to understand how to import EDGAR data into an Excel spreadsheet.
Assembling the tools you need
Joe Friday of Dragnet fame would like EDGAR. EDGAR gives you the facts and just the facts. The SEC puts little to no effort into getting the data into a format that’s easy to analyze. And that’s by design. EDGAR is built to simply be a central storage place for all the documents filed by companies and investors.
 Investment bankers need much more than comes out of EDGAR. Reading a regulatory filing word by word like a book isn’t how analysis is done. The numbers must be examined and dissected, and making this happen takes some data mining.
But before you start building complex mathematical formulas and spreadsheets, it’s always a good idea to see if you’re able to get the data you need from a pre-built system. Here are examples from three of the most dominant players in the business that do much of the analysis of EDGAR data:
- Bloomberg: If knowledge is power on Wall Street, then investment bankers’ go-to weapon is their Bloomberg machine. These devices, which you see perched on many investment bankers’ desks, pull financial data from thousands of sources, including from EDGAR. All the data are organized and accessible with just a few keystrokes. You can find data about the specific company you’re examining, but also the stock and bond data of the company’s competitors. If you work at a firm that has Bloomberg access, you’ll most likely be able to extract the data you need there.
- S&P Global Market Intelligence: Standard & Poor’s is a household name, but when it comes to ranking the creditworthiness of companies and governments, it’s becoming more well known when it comes to data services. S&P Global Market Intelligence is a web-based financial information system that provides in-depth access to just about anything you’d want to know about companies. The system calculates various financial ratios, like the ones you find out about in Chapter 8. S&P Global Market Intelligence is especially good at pulling data out of EDGAR and presenting it in a way that makes analysis easy.
- Thomson Reuters: This data service has a long history of being invaluable for investment bankers, especially in Europe. It, too, contains a wealth of knowledge from companies, and if your office has access to the system, you can save yourself lots of time by pulling the data out here.
Keep in mind that Bloomberg, S&P Global Market Intelligence, and Thomson Reuters are all, first and foremost, professional products. The subscription fees for these services are pretty steep, because they’re not designed for consumer use. But if you work at a bank, brokerage firm, or investment banking operation, most likely you can gain access to one of these three systems.
Even if your workplace doesn’t have Bloomberg or Thomson Reuters access, you can still gain from their wealth of information. Both Bloomberg (www.bloomberg.com) and Thomson Reuters (www.reuters.com/finance/markets) operate robust public websites that contain a good helping of aggregated data from EDGAR. Thomson Reuters’s website is particularly good at providing investors with a bevy of commonly used financial ratios. You can save yourself a ton of time by looking up financial ratios on Thomson Reuters’s site as opposed to calculating them yourself. But if you still want to calculate the ratios, which is a good idea to know how to do, be sure to check out Chapter 8.
Importing financial information into Excel
If you don’t have access to one of the big financial services commonly used by investment bankers (see the preceding section), don’t fret. As long as you have access to a spreadsheet program, the most powerful of which is Microsoft Excel, you can do deep analysis of company data. The tricky part, though, is knowing how to get data from EDGAR into Excel. There are a few ways to help your data make the leap.
Copying and pasting EDGAR data
To copy and paste data from EDGAR into an Excel spreadsheet, follow these steps:
-
Get the EDGAR financial document up on your screen.
See the “How to use EDGAR to pinpoint information” section, earlier in this chapter, for instructions.
- Hold down the left mouse button, and highlight the data you want to capture.
- When all the data is highlighted, click your right mouse button and choose copy.
- Open Excel.
-
Place your cursor in cell A1, and right-click.
A contextual menu appears. In newer versions of Excel, this menu has several Paste options (including Paste – Keep Source Formatting or Paste – Match Destination Formatting), and the one you choose varies on how the data was formatted in EDGAR, which varies by company. With some versions of Excel, including Excel 2019, you can see what the pasting will look like before you actually commit. Choose the paste option that keeps the columns in the best order and go for it. You’ll know the best paste option because the data will line up neatly in rows and columns in the spreadsheet.
If you don’t like the way it looks after pasting, just press Ctrl+Z to undo your work. Then right-click, and try another paste option. -
Clean up the spreadsheet.
When cutting and pasting from EDGAR into Excel, a few glitches are easy to spot. For example, you may find a strange column break or another weird formatting issue. You can clean them up as needed.
Importing directly into Excel
Copying and pasting into spreadsheets is usually the first thing that comes to mind when people think about analyzing EDGAR data. But sometimes the jump over the great divide doesn’t go well. In those cases, or in more specialized instances where you want to automate the process, you can use a built-in feature of Excel that pulls in data from Edgar. It’s Excel’s Data From Web feature. Here’s how to use it:
- Open a new Excel spreadsheet, and go to the EDGAR page you need.
-
Select the Data tab in Excel, and click the From Web option.
If you’re using an old version of Excel (2003 or earlier), you won’t see a Data tab. In that case, we suggest upgrading Excel. (You’ll be better off in the long run anyway.)
A box that looks like a browser screen appears.
-
Copy the EDGAR web page address and paste it into the New Web Query box in Excel, and click Go.
The New Web Query feature scans the EDGAR page for any table and places a yellow square with an arrow next to it.
- Click the yellow square with the arrow next to the table you want to pull into Excel.
-
Click the Import button at the bottom of the New Web Query window, and click OK in the Import Data box.
Excel does the rest.
Using your smartphone to pull in data
If you’re looking for a cool party trick to impress your investment banking friends, you’ll want to put Excel on your smartphone (either Android or iOS. This will sound like science fiction, but by using the mobile Excel app, you can take a photo of data. And Excel does the rest to pull all your data in. Here’s how:
- Launch the Excel app on your phone.
- Tap the new document icon in the upper right-hand corner of the screen. It looks like a sheet of paper with a plus sign in it.
- Choose a location for the spreadsheet. You can save it on your OneDrive cloud storage or on the device.
- Tap the photo import icon. The icon is the fifth from the left. It looks like a grid of squares with a camera on it, as shown in Figure 6-4.
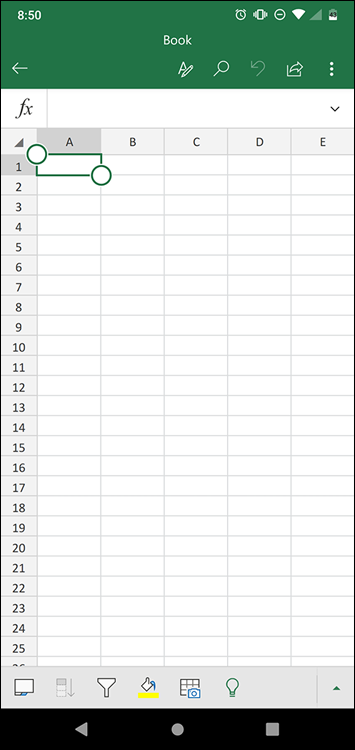
FIGURE 6-4: Excel for Android and iOS allows you to import a table of data by taking a photo.
- Take a photo of the chart you want to import. This can be a photo of a printout of a chart or the screen. Tap the Done icon when you’re happy with the shot.
- Approve and import the data. Look the imported data over to make sure the conversion went OK.
Getting in tune with interactive data
The SEC has been on a push to help make it easier for investors to use EDGAR. One of the SEC’s initiatives is designed to help get data to leap from EDGAR to Excel. Some companies choose to file their financial data on EDGAR in a special format called interactive data. Some companies may voluntarily add a function to EDGAR that allows investors to see financial data in tabular form.
To obtain a company’s interactive data, follow the instructions in the “How to use EDGAR to pinpoint information” section, earlier in this chapter. When you see the list of available documents listed for the company (in Step 6), if that company makes interactive data available, you’ll see an Interactive Data button next to the Documents button (refer to Figure 6-2). After clicking the Interactive Data button, all the company’s financials will be presented in a special website that allows you to choose different ways to look at the data. And the data are presented in a table that makes it much easier to cut and paste into Excel than the standard electronic filing.
Paying Attention to the Non-Financial Information
Numbers, financial statements, and other quantifiable information are usually what people associate with investment bankers and investing banking. But it’s pretty typical for investment bankers to have to pay close attention to non-financial data, too. Much of the art of a deal has to do with recent developments at companies, not to mention the personalities of the key players.
Doing your homework and analyzing the financial information of companies is certainly one of the primary things an investment banker needs to do. But don’t overlook the importance of non-financial developments either. Just because a data point doesn’t fit into the rows and columns of a spreadsheet doesn’t mean it’s not important.
Monitoring news streams for investment banking ideas
Investment bankers don’t waste any time in reacting to corporate developments. The trading desk at many large firms is clearly reacting in real-time to changes in interest rates, exchange rates, and the stock market. But all areas of an investment banking operation need to be nimble and able to adjust the operation’s offerings to reflect the current economic environment.
Investment bankers need to keep their eyes on developments at companies or markets to identify ways to best serve their customers. Doing so means constantly surveying the economic landscape for developments pertaining to key aspects of the financial system.
Monitoring the macro economy
Companies and investors like to think of themselves as free thinkers, but most are largely beholden to the vagaries of the economy. When the economy is rockin’ and rollin’ and the factories are humming, many companies look to get aggressive and expand, buy competitors, and file to sell stock to the public. But when the economy cools off and business gets slow, most companies completely retrench, lay off employees, and cut investments in plant and property.
Investment bankers need to keep a close eye on how the economy is performing so they can be in sync with the needs of clients. One aspect of watching the macro economy involves keeping tabs on economic indicators. Economic indicators are statistical measures that sample the health of the economy. Oft-watched economic indicators include the following:
- Consumer confidence: When consumers are in the spending mood, it can drive demand for companies’ goods and services. The University of Michigan releases monthly survey data on thousands of households to reveal how consumers are feeling about the economy.
- Unemployment reports: When jobs are hard to come by, companies aren’t hiring and consumers aren’t spending. This critical piece of economic data, from the Bureau of Labor Statistics and U.S. Department of Labor, is closely watched each month.
- Retail sales: The U.S. economy is consumer driven, so if consumers aren’t spending, that’s not good for growth. Investors closely watch the total receipts of retail outlets, generated by the Census Bureau of the Department of Commerce each month.
- Inflation: Inflation, or rising prices, can have a profound influence on the economy, companies, and investors. Inflation can be measured in several ways, including the Consumer Price Index (CPI), which is a monthly gauge of the cost of a representative basket of goods.
You can always go to the source of economic indicators. For instance, if you want, you can go directly to the website of the Bureau of Labor Statistics (www.bls.gov) to retrieve information on the unemployment rate or the CPI. But investment bankers often save time by using services that not only pull all the economic indicators into one place, but show what economists were expecting. The value of the indicator itself isn’t as important as how it measures up to forecasts.
A great source for economic indicator data is Briefing.com, which maintains an economic calendar at http://briefing.com/investor/calendars/economic/ and not only gives the data and dates of key reports, but tells you what was expected.
Monitoring the news
Don’t forget that investment banking demands ebb and flow with developments in the business world. For that reason, it’s critical to keep a close eye on developments in companies to know where the demands for financial services will likely be. Both Bloomberg and Thomson Reuters maintain dedicated news feeds that give investment bankers a good idea of the developments that matter most.
Bloomberg’s and Thomson Reuters’s websites are comprehensive data sources, so it’s easy to get distracted. But if you’re looking to monitor news key to investment banking, Bloomberg places much of that in the news area, www.bloomberg.com/news, and Thomson Reuters places it in its Global Markets area, www.reuters.com/finance/markets.
Don’t overlook the major national newspapers and their websites — The Wall Street Journal, The New York Times, and Investor’s Business Daily closely watch business developments. All these sources also provide links to their stories using Twitter, which is fast becoming a handy way for investment bankers to measure scuttlebutt on news and the economy.
Monitoring the filings
One of the greatest things about EDGAR is that it contains just about every filing ever made by a company. But that’s also one of its drawbacks. There’s so much data being filed to EDGAR that you can easily overlook important filings that may slip in unnoticed. The investment banker’s duty is to keep a close eye on what companies and investors are filing so nothing gets overlooked.
Most of the professional market information tools — Bloomberg, Thomson Reuters, and S&P Global Market Intelligence — allow users to get notifications when a company of interest makes a filing. But there are free services that do the same thing for people who don’t have access to these services. SECFilings.com (www.secfilings.com), for instance, allows you to set up alerts and be notified any time a company, investor, or any other filers submit a document to EDGAR.
Quickly processing information with aggregators
If you pick up anything from this section, it’s that investment bankers are constantly on the search for data. They’re looking for clues about the economy’s direction and closely monitoring the stock market and company filings. Any information about the financial markets can help an investment banker sense what kind of financial products will be in demand.
Because investment bankers are so focused on certain areas, it’s especially important to keep a close eye on specific transactions. Trend information can be helpful when trying to figure out what companies and investors will need from their investment bankers in the future.
Keeping tabs on mergers and acquisitions
Two of the biggest money makers for investment bankers are buyouts and sellouts. When companies are on the hunt to buy rivals or other businesses (see Chapter 4), there are lots of fees for investment bankers to collect on. Luckily, there are ample tools for investment bankers to see who’s buying whom.
One popular source for mergers and acquisitions (M&A) hounds is Mergermarket (www.mergermarket.com). The subscription service closely monitors deal making so investment bankers can see how active the M&A market is and try to figure out what companies may be in play and, therefore, in the market for an investment banker. Factset Mergers (www.factsetmergers.com), another subscription service, monitors M&A activity to keep investment bankers informed. And Dealogic (www.dealogic.com), another subscription service, keeps in-depth data on deals so investment bankers can mine for trends and try to see what’s next.
Tracking the IPO market
Bringing companies public and allowing them to raise money by selling stock to the public, has long been a cornerstone of investment banking. So keeping an eye on what kinds of companies are going public and at what prices is a critical thing investment bankers should be watching.
A top source of IPO market data is Renaissance Capital (www.renaissancecapital.com); here, you find data on recent IPOs and in-depth and thoughtful resources regarding IPO trends. The IPO calendar is a listing of all the IPOs that are coming, and something investment bankers keep close tabs on; IPOScoop.com (www.iposcoop.com) lets you track the IPO calendar.
Watching corporate profits
When companies are swimming in profits, they don’t jump into a money bin like Uncle Scrooge. These profit-rich companies can, though, afford to do many of the things investment bankers would like them to do. After all, the companies flush with profit can entertain ideas of buying another company or investing in a new plant or expanding overseas.
Given that profits are what fill a company’s coffers, investment bankers need to monitor profits closely. There’s no question that companies provide full details on their profitability in their financial statements on EDGAR. And in Chapter 7, we explain how to read companies’ profit reports.
But investment bankers must also have an understanding of overall profit growth trends for companies at large. And S&P Dow Jones Indices maintains a treasure trove of profit data at http://us.spindices.com/indices/equity/sp-500. There, you can see corporate profit trends, using the Standard & Poor’s 500 universe of large U.S. companies.
Doing research on the key players in a deal
Don’t make the mistake of thinking that a deal is just about the numbers. The people behind the deal — for instance, the CEO and investors in a company being targeted for a buyout — can be very important.
Bloomberg, S&P Global Market Intelligence, and Thomson Reuters all maintain comprehensive databases on all the players in finance, ranging from mutual fund managers to large investors. These services even allow you to e-mail some of these heavy hitters.
If your employer doesn’t have access to one of these services, or you’re an individual, you’ll need to be a bit more creative to find the information you need. Again, EDGAR is your best friend.
If you’re looking for information about a large investor, for instance, you can use the same EDGAR search directions given in the “How to use EDGAR to pinpoint information” section, earlier in this chapter. But instead of using the Fast Search, you can use the Company Name search. Most big investors operate under a company name. For instance, if you want to track the moves of hedge-fund manager David Einhorn, you’ll want to search for his investment firm — Greenlight Capital — in EDGAR. There, you’ll find all Einhorn’s moves that must be reported to the SEC.