
Chapter 7. Heap Memory Best Practices
Chapter 5 and Chapter 6 discussed the details of how to tune the garbage collector so that it has as little effect on a program as possible. Tuning the garbage collector is important, but often better performance gains can be made by utilizing better programming practices. This chapter discusses some of the best-practice approaches to using heap memory in Java.
There are two conflicting goals here. The first general rule is to create objects sparingly and to discard them as quickly as possible. Using less memory is is the best way to improve the efficiency of the garbage collector. On the other hand, frequently recreating some kinds of objects can lead to worse overall performance (even if GC performance improves). If those objects are instead reused, programs can see substantial performance gains. There are a variety of ways in which objects can be reused, including threadlocal variables, special object reference, and object pools. Reusing objects means they will be long-lived and impact the garbage collector, but when they are reused judiciously, overall performance will improve.
This chapter discusses both approaches and the trade-offs between them. First, though, we’ll look into tools for understanding what is happening inside the heap.
Heap Analysis
GC logs and the tools discussed in Chapter 5 are great at understanding the impact GC has on an application, but for additional visibility, we must look into the heap itself. The tools discussed in this section provide insight into the objects that the application is currently using.
Most of the time, these tools operate only on live objects in the heap—objects that will be reclaimed during the next full GC cycle are not included in the tools’ output. In some cases, tools accomplish that by forcing a full GC, so the application behavior can be affected after the tool is used. In other cases, the tools walk through the heap and report live data without freeing objects along the way. In either case, though, the tools require some amount of time and machine resources; they are generally not useful during measurement of a program’s execution.
Heap Histograms
Reducing memory use is an important goal, but as with most performance topics,
it helps to target efforts to maximize the available benefits. Later in this
chapter, I’ll show an example around
lazily-initializing a
Calendar
object. That will save 640 bytes in the heap, but
if the application only ever initializes one such object, there will not be
a measurable difference in performance. Analysis must be performed to know which
kinds of objects are consuming large amounts of memory.
The easiest way to do that is via a heap histogram. Histograms are a quick way to look at the number of objects within an application without doing a full heap dump (since heap dumps can take a while to analyze, and they consume a large amount of disk space). If a few particular object types are responsible for creating memory pressure in an application, a heap histogram is a quick way to find that.
Heap histograms can be obtained by using jcmd (here with process id 8898):
% jcmd 8998 GC.class_histogram
8898:

 num     #instances         #bytes  class name
 ---------------------------------------------
   1:        789087       31563480  java.math.BigDecimal
   2:        237997       22617192  [C
   3:        137371       20696640  <constMethodKlass>
   4:        137371       18695208  <methodKlass>
   5:         13456       15654944  <constantPoolKlass>
   6:         13456       10331560  <instanceKlassKlass>
   7:         37059        9238848  [B
   8:         10621        8363392  <constantPoolCacheKlass>
In a heap histogram, Klass-related objects are often near
the top; those are the meta data objects from loading the classes. It is
also quite common to see character arrays ([C).[37] and String objects near
the top, as these are the most commonly-created Java objects. Byte arrays ([B)
and object arrays
([Ljava.lang.Object;)
are also quite common, since
class loaders store their data in those structures.
In this example (which comes from running a variation of the sample stock servlet
in an application server), the
inclusion of the
BigDecimal
class is something to pursue: we know the sample code produces a lot
of transient
BigDecimal
objects, but having so many stay around in the heap
is not what we might ordinarily expect. The output from
GC.class_histogram
includes only live
objects, though the command does not force a full GC.
Similar output is available by running this command:
% jmap -histo process_id
The output from jmap includes objects that are eligible to be collected (dead
objects).
To force a full GC prior to seeing the histogram, run this command instead:
% jmap -histo:live process_id
Histograms are quite small, so gathering one for every test in an automated system can be quite helpful. Still, because they take a few seconds to obtain, they should not be taken during a performance measurement steady state.
Heap Dumps
Histograms are great at identifying issues caused by allocated too many instances of one or two particular classes, but for deeper analysis, a heap dump is required. There are many tools that can look at heap dumps, and most of them can connect to a live program to generate the dump. It is often easier to generate the dump from the command line, which can be done with either of the following commands:
%jcmd process_id GC.heap_dump /path/to/heap_dump.hprofor %jmap -dump:live,file=/path/to/heap_dump.hprof process_id
Including the live option in jmap will force a full GC to occur before the
heap is dumped. That is the default
for jcmd,
though if for some reason you want those other (dead) objects
included, you can specify
-all
at the end of the jcmd
command line.
Either command creates a file named heap_dump.hprof in the given directory; a number of tools can then be used to open that file. Three of the most common are:
-
jhat - This is the original heap analyzer tool; it reads the heap dump and runs a small HTTP server that lets you look at the dump through a series of web page links.
-
jvisualvm -
The monitor tab of
jvisualvmcan take a heap dump from a running program or open a previously produced heap dumps. From there you can browse through the heap, examining the largest retained objects and executing arbitrary queries against the heap. -
mat -
The open-source EclipseLink Memory Analyzer Tool (
mat) can load one or more heap dumps and perform analysis on them. It can produce reports that suggest where problems are likely to be found, and it too can be used to browse through the heap and execute SQL-like queries into the heap.
The first-pass analysis of a heap generally involves retained memory. The retained memory of an object is the amount of memory that would be freed if the object itself were eligible to be collected. In Figure 7-1, the retained memory of the string trio object includes the memory occupied by that object as well as the memory occupied by the Sally and David objects. It does not include the memory used by the Michael object, since that object has another reference and won’t be eligible for garbage collection if string trio is freed.
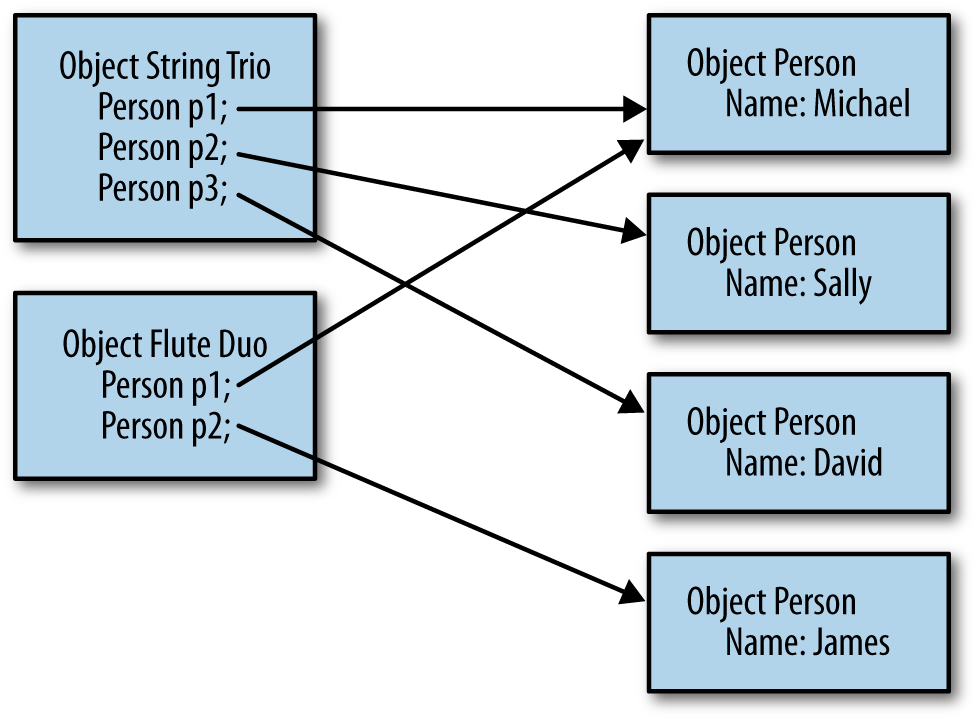
Objects that retain a large amount of heap space are often called the dominators of the heap. If the heap analysis tool shows that there are a few objects which dominate the bulk of the heap, then things are easy: all you need do is create fewer of them, retain them for a shorter period of time, simplify their object graph, or make them smaller. That may be easier said than done, but at least the analysis is simple.
More commonly, some detective work will be necessary because the program is likely sharing objects. Like the Michael object in the previous figure, those shared objects are not counted in the retained set of any other object, since freeing one individual object will not free the shared object.[38] As an extreme example, here are the top retained objects of a heap from a version of the stock servlet running in GlassFish that caches items strongly in the user’s session and weakly in a global hashmap (so that the cached items have multiple references).
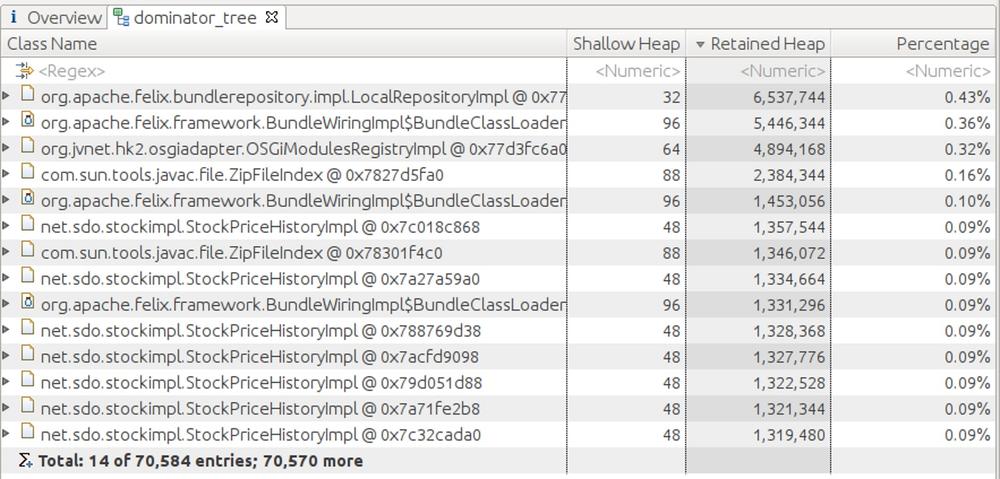
The heap has some 1.4 GB of objects in it (that value doesn’t appear on this tab). Even so, the largest set of objects that is referenced singly is only 6 MB (and is, unsurprisingly, part of GlassFish’s OSGi classloading framework). Looking at the objects that directly retain the largest amount of memory isn’t going to solve the memory issues.
In this example, there are multiple instances
of
StockPriceHistoryImpl
objects in this list, each of which retains a fair amount of
memory. It can be deduced from the amount of memory consumed
by those objects that they
are the issue. In the general case, though, objects might be shared
in such a a way that looking at the retained heap won’t show anything obvious.
The histogram of objects is a useful second step:
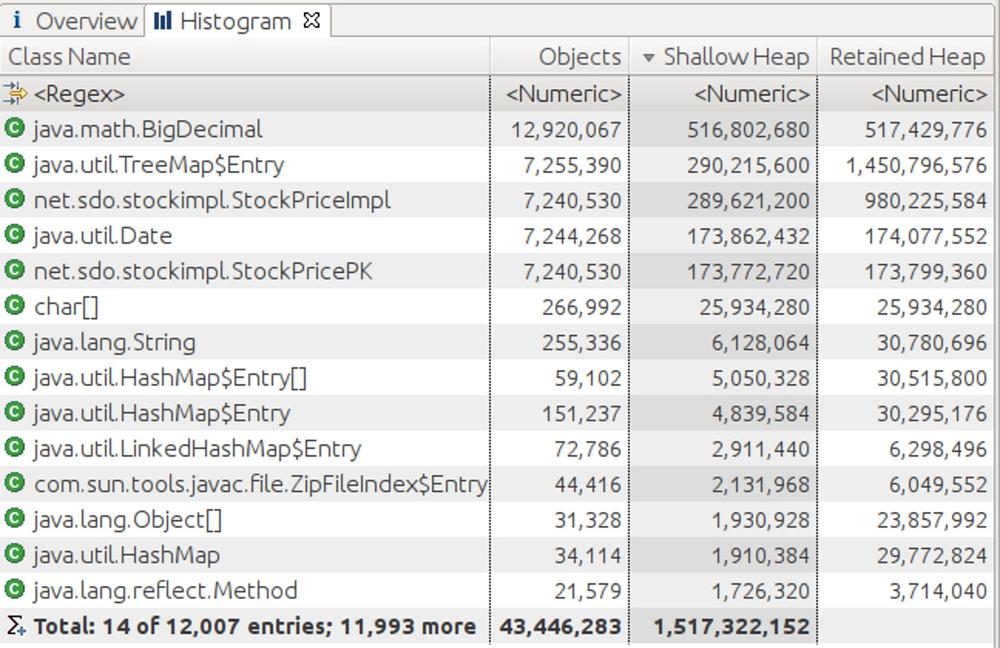
The histogram aggregates objects of the same type, and in this example
it is much more apparent that the 1.4 GB of memory retained by the seven
million
TreeMap$Entry
objects is the key here.
Even without knowing what is going on in the program, it is
straightforward enough
to use the Memory Analyzer’s facility to trace those objects to see what
is holding onto them.
Heap analysis tools provide a way to find the GC roots of
a particular object (or set of objects in this case)—though jumping
directly to the GC roots isn’t necessarily helpful. The GC roots are the
system objects that hold some static, global reference which (through a long
chain of other objects) refers to the object in question. Typically these
come from the static variables of a class loaded on the system or
bootstrap classpath. This includes the
Thread
class and all active threads;
threads retain objects either through their thread local variables or through
references via their target
Runnable
object (or, in the case of a subclass
of the
Thread
class, any other references the subclass has).
In some cases, knowing the GC roots of a target object is helpful, but if the
object has multiple references, it will have many GC roots. The references
here are a tree structure in reverse. Say that there are two objects referring
to a particular
TreeMap$Entry
object. Each of those objects may be referred
to by two other objects, each of which may be referred to by three other
objects, and so on. The explosion of references as the roots are traced back
means that there are likely multiple GC roots for any given object.
Instead, it can be more fruitful to play detective and find the lowest
point in the object graph where the target object is shared. This is done
by examining the objects and their incoming references, and tracing those
incoming references until the duplicate path is identified. In this case,
references to the
StockPriceHistoryImpl
objects held in the tree map have
two referents: the
ConcurrentHashMap
which holds attribute data of the
session, and the
WeakHashMap
which holds the global cache:
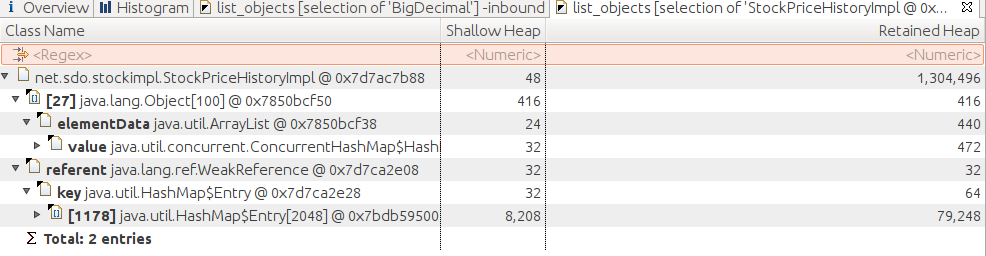
In Figure 7-4, the back traces are expanded enough only to show a
little data about the two of them. The way to conclude that it is the session
data is to continue to expand the
ConcurrentHashMap
path until it becomes
clear that path is the session data. A similar logic applies to the
path for the
WeakHashMap.
The object types used in this example made the analysis a little easier than
is often the case
If the primary data in this application had been modeled as
String
objects
instead of
BigDecimal
objects, and stored in
HashMap
objects instead
of
TreeMap
objects, things
would have been more difficult. There are hundreds of thousands of other
strings, and tens of thousands of other hashmaps in the heap dump. Finding
paths to the interesting objects, then, takes some patience. As a
general rule of thumb, start with collection objects
(e.g.,
HashMap)
rather than
the entries
(e.g.,
HashMap$Entry),
and look for the biggest collections.
Quick Summary
- Knowing which objects are consuming memory is the first step in knowing which objects to optimize in your code.
- Histograms are a quick and easy way to identify memory issues caused by creating too many objects of a certain type.
- Heap dump analysis is the most powerful technique to track down memory usage, though it requires some patience and effort to be utilized well.
Out of Memory Errors
The JVM throws an out of memory error under these circumstances:
- No native memory is available for the JVM.
- The permgen portion of the heap (in Java 7 and earlier) is out of memory.
- The Java heap itself is out of memory: the application has too many live objects for the given heap size.
- The JVM is spending too much time performing garbage collection.
The last two cases—involving the Java heap itself—are the more common case, but don’t automatically conclude from an out of memory error that the heap is the problem. It is necessary to look at the reason why the out of memory error occurred (that reason is part of the output of the exception).
Out of Native Memory
The first case in this list—no native memory available for the JVM—occurs for reasons unrelated to the heap at all. In a 32-bit JVM, the maximum size of a process is 4 GB (3 GB on some versions of Windows, and about 3.5 GB on some older versions of Linux). Specifying a very large heap—say, 3.8 GB—brings the application size dangerously close to that limit. Even in a 64-bit JVM, the operating system may not have sufficient virtual memory for whatever the JVM requests.
This topic is addressed more fully in Chapter 8. Be aware that if the message for the out of memory error discusses allocation of native memory that heap tuning isn’t the answer: you need to look into whatever native memory issue is mentioned in the error. For example, the following message tells you that the native memory for thread stacks is exhausted:
Exception in thread "main" java.lang.OutOfMemoryError: unable to create new native thread
Out of Permgen or Metaspace Memory
This memory error is also not associated with the heap—it occurs because the perm gen (in Java 7) or the metaspace native memory (in Java 8) is full. The root cause of that can be for two reasons. The first is simply that the application uses more classes than can fit in the default perm space; the solution to that is to increase the size of permgen (see Sizing PermGen and Metaspace).[39]
The second case is trickier: it involves a classloader memory leak. This occurs most frequently in a Java EE application server. Each application that is deployed to an appserver runs in its own class loader (that provides isolation, so that classes from one application are not shared with—and do not interfere with—classes from another application). In development, each time the application is changed, it must be redeployed: a new class loader is created to load the new classes, and the old class loader is allowed to go out of scope. Once the class loader goes out of scope, the class metadata can be collected.
If the old class loader does not go out of scope, then the class meta data cannot be freed, and eventually permgen will fill up and throw an out of memory error. In this case, increasing the size of permgen will help, but ultimately that will simply postpone the error.
If this situation occurs in an appserver
environment, there is little to do but contact the appserver vendor and get
them to fix the leak. If you are writing your own application that creates
and discards lots of class loaders, then take care to make sure the class
loaders themselves are discarded correctly (in particular, make sure that
no thread sets its context classloader to one of the temporary classloaders).
To debug this situation, the heap dump analysis just described is quite
helpful: in the histogram, find all the instances of the
ClassLoader
class,
and trace their GC roots to see what is holding on to them.
The key to recognizing this situation is again the full text output of the out of memory error. In Java 8, if the meta space is full the error text will appear like this:
Exception in thread "main" java.lang.OutOfMemoryError: Metaspace
Similarly in Java 7:
Exception in thread "main" java.lang.OutOfMemoryError: PermGen space
Out of Heap Memory
When the heap itself is actually out of memory, the error message appears like this:
Exception in thread "main" java.lang.OutOfMemoryError: Java heap space
The common cases where an out of memory condition is triggered by a lack of heap space are similar to the permgen case. The application may simply need more heap space: the number of live objects that it is holding onto cannot fit in the heap space configured for it. Or, the application may have a memory leak: it continues to allocate additional objects without allowing other objects to go out of scope. In the first case, increasing the heap size will solve the issue; in the second case, increasing the heap size will merely postpone the error.
In either case, heap dump analysis is necessary to find out what is consuming
the most memory; the focus can then be on reducing the number (or size) of
those objects. If the application has a memory leak, then take successive
heap dumps a few minutes apart and compare them. mat has that functionality
built into it: if two heap dumps are open, then mat has an option to
calculate the difference in the histograms between the two heaps.
- Automatic Heap Dumps
Figure 7-5 shows the classic case of a Java memory leak caused by
a collection class (in this case, a
HashMap).[40]
This is a comparison histogram view: it displays the difference in the
number of objects in two different heap dumps.
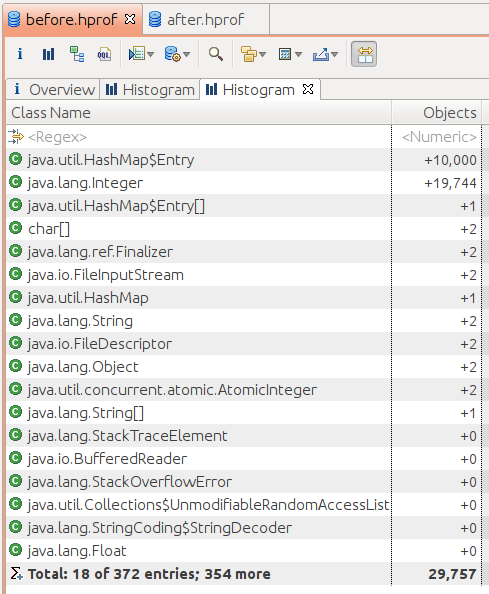
The best way to overcome this situation is to change the application logic such that items are proactively discarded from the collection when they are no longer needed. Alternatively, a collection that uses weak or soft references can automatically discard the items when nothing else in the application is referencing them, but those collections come with a cost (as is discussed later in this chapter).
GC Overhead Limit Reached
The final case where the JVM throws an out of memory error is when it determines that is it spending too much time performing GC:
Exception in thread "main" java.lang.OutOfMemoryError: GC overhead limit exceeded
This error is thrown when all of the following conditions are met:
-
The amount of time spent in full GCs exceeds the value specified by the
-XX:GCTimeLimit=Nflag. The default value is 98 (i.e., if 98% of the time is spent in GC). -
The amount of memory reclaimed by a full GC is less than the value specified by the
-XX:GCHeapFreeLimit=N+ flag. The default value for this is 2, meaning that if less than 2% of the heap is freed during the full GC, this condition is met. - The above two conditions have held true for five consecutive full GC cycles (that value is not tunable).
-
The value of the
-XX:+UseGCOverheadLimitflag istrue(which it is by default).
Note that all four of these conditions must be met. It is common to see
more than five consecutive full GCs occur in an application that does not
throw an out of memory
error. That is because even if the application is spending 98% of its time performing
full GCs, it may be freeing more than 2% of the heap during each GC. Consider
increasing the value of
GCHeapFreeLimit
in that case.
Note that as a last-ditch effort to free memory, if the first two conditions hold for four consecutive full GC cycles, then all soft references in the JVM will be freed before the fifth full GC cycle. That often prevents the error, since that fifth cycle will likely free more than 2% of the heap (assuming that the application uses soft references).
Quick Summary
- Out of memory errors are thrown for a variety of reasons; do not assume that the heap space is the problem.
- For both permgen and the regular heap, out of memory errors most frequently occur because of memory leaks; heap analysis tools can help to find the root cause of the leak.
Using less memory
The first approach to using memory more efficiently in Java is to use less heap memory. That statement should be unsurprising: using less memory means the heap will fill up less often, requiring fewer GC cycles. The effect can multiply: fewer collections of the young generation means the tenuring age of an object is increased less often—meaning that the object is less likely to be promoted into the old generation. Hence, the number of full GC cycles (or concurrent GC cycles) will be reduced. And if those full GC cycles can clear up more memory, then they will also occur less frequently.
This section investigates three ways in which to use less memory: reducing object size, lazy initialization of objects, and the use of canonical objects.
Reducing Object Size
Objects occupy a certain amount of heap memory, so the simplest way to use less memory is to make objects smaller. Given the memory constraints on the machine running your program, it may not be possible to increase the heap size by 10%, but a 20% reduction of half the objects in the heap can achieve the same goal.
The size of an object can be decreased by (obviously) reducing the number of instance variables it holds and (less obviously) by reducing the size of those variables. Table 7-1 gives the size of an instance variable of all Java types.
| Type | Size |
byte | 1 |
char | 2 |
short | 2 |
int | 4 |
float | 4 |
long | 8 |
double | 8 |
reference | 4 on 32-bit JVMs and 64-bit JVMs with heaps of less than 32 GB; 8 on 64-bit JVMs with large heaps.[footnote:See Compressed oops for more details.] |
The reference type here is the reference to any kind of Java object—instances of classes or arrays. That space is the storage only for
the reference itself. The size of an object that contains references to
other objects varies depending on whether we want to consider the
shallow, deep, or retained size of the object, but that size also includes
some invisible object header fields. For a regular object, the size of the
header fields is eight bytes on a 32-bit JVM and 16 bytes on a 64-bit JVM
(regardless of heap size).
For an array, the size of the header fields is 16 bytes on a 32-bit JVM or
a 64-bit JVM with a heap of less that 32 GB, and 24 bytes otherwise.
For example, consider these class definitions:
publicclassA{privateinti;}publicclassB{privateinti;privateLocalel=Locale.US;}publicclassC{privateinti;privateConcurrentHashMapchm=newConcurrentHashMap();}
The actual sizes of a single instance of these objects (on a 64-bit Java 7 JVM) is given in Table 7-2.
In class B, defining the Locale reference
adds eight bytes to the object size, but at least in that
example, the actual
Locale
object is shared among other classes. If the
Locale
object is never actually needed by the class, including that instance
variables will waste only the additional bytes for the reference.
Still, those bytes add up if the application creates a lot of instances
of class B.
On the other hand, defining and creating a
ConcurrentHashMap
consumed additional bytes for the object reference, plus an additional
200 bytes for the hash map object. If the hash map is never used, instances of
class C are quite wasteful.
Originally defining only required instance variables is one way to save
space in an object.
The less obvious case involves using smaller data types.
If a class needs to keep track of one of eight possible states, it can do
so using a byte rather than an int—potentially saving three bytes.
Using float instead of double, int instead of long, and so on can help
to save memory, particularly in classes which are frequently instantiated. As
discussed in Chapter 12, using appropriately-sized collections (or using simple
instance variables instead of collections) achieves similar savings.
- Object Alignment and Object Sizes
Eliminating instance fields in an object can help make the object smaller, but there is a gray area here: what about object fields that hold the result of a calculation based on pieces of data. This is the classic computer science trade-off of time versus space: is it better to spend the memory (space) to store the value, or better to spend the time (CPU cycles) to calculate the value as needed? In Java, though, the trade-off applies only to CPU time as well, since the additional memory can cause garbage collection to consume more CPU cycles.
The hash code for a
String,
for example, is calculated
by summing an equation involving each character of the string; it is
somewhat time-consuming to calculate. Hence, the
String,
class stores
that value in an instance variable so that the hashcode need only be
calculated once: in the end, reusing that value will always produce
better performance than any memory savings from not storing it. On the other
hand, the
toString(),
method of most classes does not cache the
string representation of the object in an instance variable, which would
consume memory both for the instance variable and the string it references.
Instead, the time required to calculate a new string will usually give
better performance than the memory required to keep the string reference
around.[41]
This case is definitely a your-mileage-may-vary situation, and the point along the time/space continuum where it makes sense to switch between using the memory to cache a value (as opposed to recalculating the value) will depend on many factors. If reducing GC is the goal, then the balance will swing more to recalculating.
Quick Summary
- Reducing object sizes can often improve the efficiency of garbage collection.
- The size of an object is not always immediately apparent: objects are padded to fit on eight-byte boundaries, and object reference sizes are different between 32- and 64-bit JVMs.
-
Even
nullinstance variables consume space within object classes.
Lazy Initialization
Much of the time, the decision about whether or not a particular instance
variable is needed is not as black-and-white as the previous section suggests.
A particular class may need a
Calendar
object only 10% of the time, but
Calendar
objects are expensive to create, and it definitely makes sense
to keep that object around rather than re-create it on demand. This is
a case where lazy initialization can help.
So far, this discussion has assumed that instance variables are
initialized eagerly. A class that needs to use a
Calendar
object (and that doesn’t need to be thread-safe) might look something like this:
publicclassCalDateInitialization{privateCalendarcalendar=Calendar.getInstance();privateDateFormatdf=DateFormat.getDateInstance();privatevoidreport(Writerw){w.write("On "+df.format(calendar.getTime())+": "+this);}}
To initialize the fields lazily instead, there is a small trade-off in terms of computation performance: the code must test the state of the variable each time the code is executed:
publicclassCalDateInitialization{privateCalendarcalendar;privateDateFormatdf;privatevoidreport(Writerw){if(calendar==null){calendar=Calendar.getInstance();df=DateFormat.getDateInstance();}w.write("On "+df.format(calendar.getTime())+": "+this);}}
Lazy initialization is best used when the operation in question is only infrequently used—if the operation is commonly used, then no memory will actually be saved (since it will always be allocated), and there will be that slight performance penalty on a common operation.
When the code involved must be thread-safe, lazy initialization becomes more complicated. As a first step, it is easiest simply to add traditional synchronization:
publicclassCalDateInitialization{privateCalendarcalendar;privateDateFormatdf;privatesynchronizedvoidreport(Writerw){if(calendar==null){calendar=Calendar.getInstance();df=DateFormat.getDateInstance();}w.write("On "+df.format(calendar.getTime())+": "+this);}}
Introducing synchronization into the solution opens up the possibility that the synchronization will become a performance bottleneck. That case should be rare. The performance benefit from lazy initialization only occurs when the object in question will only rarely initialize those fields—since if it usually initializes those fields, then no memory has actually been saved. So the case where synchronization becomes a bottleneck for lazily-initialized fields is one where an infrequently-used code path is suddenly subject to use by a lot of threads simultaneously. That case is not inconceivable, but it isn’t the most common case either.
Solving that synchronization bottleneck can only happen if the
lazily-initialized
variables are themselves threadsafe.
DateFormat
objects are not threadsafe, so in the current example, it doesn’t
really matter if the lock includes the
Calendar
object—if the lazily-initialized objects are suddenly used heavily, the
required synchronization around the
DateFormat
object will be an issue no matter what. The threadsafe code would have to
look like this:
publicclassCalDateInitialization{privateCalendarcalendar;privateDateFormatdf;privatevoidreport(Writerw){unsychronizedCalendarInit();synchronized(df){w.write("On "+df.format(calendar.getTime())+": "+this);}}}
Lazy initialization that involves an instance variable which is not threadsafe
can always synchronize around that variable (e.g., using the
synchronized
version of the method shown previously).
Consider a somewhat different example, where a large
ConcurrentHashMap
is lazily initialized:
publicclassCHMInitialization{privateConcurrentHashMapchm;publicvoiddoOperation(){synchronized(this){if(chm==null){chm=newConcurrentHashMap();...codetopopulatethemap...}}...usethechm...}}
Because the
ConcurrentHashMap
can be safely accessed by multiple threads,
the extra synchronization in this example is one of the
infrequent cases where properly-used lazy initialization could introduce
a synchronization bottleneck.[42] That
bottleneck is solved using the double-checked locking idiom:
publicclassCHMInitialization{privatevolatileConcurrentHashMapinstanceChm;publicvoiddoOperation(){ConcurrentHashMapchm=instanceChm;if(chm==null){synchronized(this){chm=instanceChm;if(chm==null){chm=newConcurrentHashMap();...codetopopulatethemapinstanceChm=chm;}}...usethechm...}}}
There are some important threading issues here—the instance variable
must be declared
volatile,
and there is a slight performance benefit
in assigning the instance variable to a local variable. More details of
that are given in Chapter 9; in the occasional case where
lazy initialization of threaded code makes sense, this is the design pattern
to follow.
Eager De-initialization
The corollary to lazily initializing variables is eagerly de-initializing
them by setting their value to null. That allows the object in question to
be collected more quickly by the garbage collector. While that sounds like
a good thing in theory, it is really useful only in limited circumstances.
A variable that is a candidate for lazy initialization might seem like a
candidate for eager de-initialization: in the examples above, the
Calendar
and
DateFormat
objects could be set to
null
upon completion of
the
report()
method. However, if the variable isn’t going to be used in
subsequent invocations of the method (or elsewhere in the class),
there is no reason to make it
an instance variable in the first place: simply create the local variable
in the method, and when the method completes, the local variable will fall
out of scope and the garbage collector can free it.
The common exception to rule about not needed to eagerly de-initialize
variables occurs in classes like the classes in the
Java collection framework:
classes that hold object references to data for a long time, and
then are informed that
the data in question is no longer needed. Consider the implementation of
the
remove()
method in the
ArrayList
class of the JDK (some code simplified):
publicEremove(intindex){EoldValue=elementData(index);intnumMoved=size-index-1;if(numMoved>0)System.arraycopy(elementData,index+1,elementData,index,numMoved);elementData[--size]=null;// clear to let GC do its workreturnoldValue;}
The code comment about GC appears in the (otherwise sparsely-commented)
JDK source itself: setting the value of a
variable to
null
like that
is an unusual-enough operation that some explanation is needed. In this case,
trace through what happens when the last element of the array is removed.
The number of items remaining in the array—the
size
instance variable—is decremented. Say that size is decremented from five to four. Now
whatever is stored in
elementData[4]
cannot be accessed—it is beyond the valid size of the array.
elementData[4]
is, in this case, a stale reference. The
elementData array
is probably going to remain active for a long time, and so anything that it
no longer needs to reference needs to be actively set to null.
This notion of stale references is the key—if a long-lived class
caches and then discards object references, care must be taken to avoid
stale references. Otherwise, explicitly setting an object reference to
null
will offer little performance benefit.
Quick Summary
- Use lazy initialization only when the common code paths will leave variables uninitialized.
- Lazy initialization of thread-safe code is unusual but can often piggyback on existing synchronization.
- Use double-checked locking for lazy initialization of code using thread safe objects.
Immutable and Canonical Objects
In Java, many object types are immutable. This includes objects which
have a corresponding primitive type—Integer,
Double,
Boolean,
and so on—as well as other numeric-based types like
BigDecimal.
The
most common Java object, of course, is the immutable
String.
From a program design
perspective, it is often a good idea for custom classes to represent
immutable objects as well.
When these objects are quickly created and discarded, they have a small effect on young collections; as we saw in Chapter 5, that impact is limited. But as is true of any object, if a large number of immutable objects are promoted to the old generation, performance can suffer.
Hence, there is no reason to avoid designing and using immutable objects, even if it may seem a little counter-productive that these objects cannot be changed and must be recreated. But one optimization that is often possible when handling these objects is to avoid creating duplicate copies of the same object.
The best example of this is the
Boolean
class. In any Java application,
there need ever be only two instances of the
Boolean
class: one for true, and one for
false. Unfortunately, the
Boolean
class is badly designed. Because it
has a
public
constructor, applications can create as many of these objects as they
like, even though they are all exactly the same as one of the two canonical
Boolean
objects. A better design would have been for the
Boolean
class
to have only a private constructor, and static methods to return either
Boolean.TRUE
or
Boolean.FALSE
based on their parameter. If such a model
can be followed for your own immutable classes, you can prevent them
from contributing to the heap usage of your application.[43]
These singular representations of immutable objects are known as the canonical version of the object.
Creating Canonical Objects
Even if the universe of objects for a particular class is practically
limitless, using canonical values can often save memory. The JDK provides
a facility to do this for the most-common immutable object: strings can
call the
intern()
method to find a canonical version of the string.
More details of string interning are examined in the next section,
but for now we’ll look at how to accomplish the same thing for
custom classes.
To canonicalize an object, create a map that stores the canonical version of the object. In order to prevent a memory leak, make sure that the objects in the map are weakly referenced. So the skeleton of such a class looks like this:
publicclassImmutableObject{WeakHashMap<ImmutableObject,ImmutableObject>map=newWeakHashMap();publicImmutableObjectcanonicalVersion(ImmutableObjectio){synchronized(map){ImmutableObjectcanonicalVersion=map.get(io);if(canonicalVersion==null){map.put(io,io);canonicalVersion=io;}returncanonicalVersion;}}}
In a threaded environment, the synchronization here can potentially become
a bottleneck. There is no easy solution for that if you stick to JDK classes,
since they do not provide a concurrent hashmap for weak references.
However, there have been proposals to add a
CustomConcurrentHashMap
to the JDK (originally as part of JSR 166), and you can find various
third-party implementations of such a class.
Quick Summary
- Objects which are immutable offer the possibility of special lifecycle management: canonicalization.
- Eliminating duplicate copies of immutable objects via canonicalization can greatly decrease the amount of heap an application uses.
String Interning
Strings are, far and away, the most common Java object; your application’s heap is almost certainly filled with them.
If a large number of those strings are the same, then a large part of the heap is wasted. Since strings are immutable, there is never any reason to have more than one string representing the same sequence of characters. Programming being what it is, though, it can be hard to know if you are creating duplicate strings.
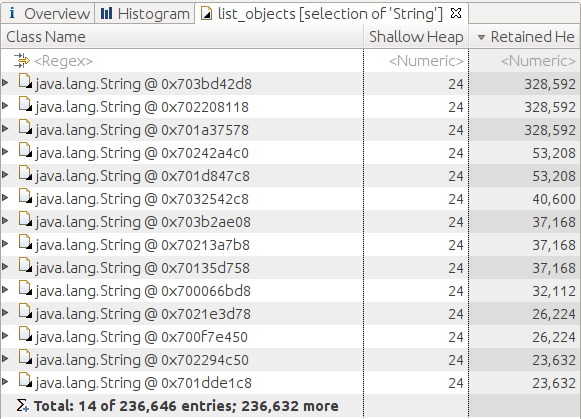
Knowing if you have a large amount of duplicate strings requires some
heap analysis. One way to do that is to load a heap dump in the Eclipse
Memory Analyzer, calculate the retained size for all the
String
objects, and list those objects sorted by their maximum retained size.
Figure 7-6 shows such a heap dump. It seems likely that the first
three strings are the same,.footnote[The strings can be inspected in the tool
for verification.] and that interning them would save 650 KB of memory.
The same is true of the fourth and fifth strings, the seventh though ninth
strings,
and so on—except of course the lower in the list, the less
memory that is saved by interning the string.
This is a case where interning those particular strings is advantageous;
retaining only the canonical version of the string can save all the memory
allocated by those duplicate cases. That could be done with a variant of
the canonicalization example in the previous section,
but the
String
class provides its own method to
perform canonicalization: the
intern()
method.
Like most optimizations, interning strings shouldn’t be done arbitrarily, but it can be effective if there are lots of duplicate strings occupying a significant portion of the heap. One caveat about interning too many strings is that the table of interned strings—which is held in native memory—is a fixed-size hashtable. In Java releases prior to Java 7u40, the default size of the table is 1009 buckets; on average, then, it can be expected to hold about 500 strings before there are performance problems due to chaining. In 64-bit versions of Java 7u40 and later, the default size is 60013.
Starting in Java 7, the size of this table can be set when
the JVM starts by using the flag
-XX:StringTableSize=N
(which defaults to
1009 or 60013 as previously mentioned). If an application will intern a lot
of strings, this
number should be increased. The string intern table will operation most
efficiently if
that value is a prime number.
The performance of the
intern()
method is dominated by how well
the string table size is tuned. As an example, here is the total time to
create and intern 10 million randomly-created strings under various
scenarios:
| Tuning | Time |
String Table size 1009 | 2.3 hours |
String Table size 1 Million | 30.4 seconds |
String Table size 10 Million | 25.2 seconds |
Custom Method | 26.4 seconds |
Note the very severe penalty for the improperly-sized string intern table. Once the table is sized according to the expected data, performance is drastically improved.
For that last test case, instead of using the
intern()
method,
I used the sample
canonicalVersion()
method shown previously and implemented with a
CustomConcurrentHashMap
class (from a pre-release version of JSR 166)
with weak keys and values.
That didn’t help performance against
a well-tuned string intern table, but the advantage with the custom
implementation is that I
didn’t need to tune the size of that custom map at all. The
CustomConcurrentHashMap
was given an initial
size of 1009, and it resized itself dynamically as needed. That had
a small penalty
against the best-tuned string table size, but it was far easier to
run.[44]
To see how the string table is performing, run your
application with the
-XX:+PrintStringTableStatistics
argument (this
flag requires JDK 7u6 or later and is false by default). When the
JVM exits, it will print out a table like this:
StringTable statistics:
Number of buckets       :    1009
Average bucket size     :    3008
Variance of bucket size :    2870
Std. dev. of bucket size:      54
Maximum bucket size     :    3186
This command also displays information about the symbol table, but the string table is what interests us here.[45] In this case, there are 3,035,072 interned strings (since there are 1009 buckets with an average of 3008 strings per bucket). Ideally, the average bucket size should be 0 or 1. The size won’t ever actually be 0—just less than 0.5, but the calculation is done using integer arithmetic, so it might be rounded down in the report. If the averages are larger than 1, increase the size of the string table size.
The number of interned strings an application has allocated
(and their total size) can also be obtained using the jmap command
(this also requires JDK 7u6 or later):
% jmap -heap process_id
... other output ...
36361 interned Strings occupying 3247040 bytes.
The penalty for setting the size of the string table too high is minimal: each bucket takes only four or eight bytes (depending on whether you have a 32- or 64-bit JVM), so having a few thousand more entries than optimal is a one-time cost of a few KB of native (not heap) memory.
- String Interning and Equals
Quick Summary
- Applications that reuse the same strings a lot will benefit by interning those strings.
- Applications that intern many strings may need to adjust the size of the string intern table (unless they are running on a 64-bit server JVM starting in Java 7u40).
Object Lifecycle Management
The second broad topic of memory management discussed in this chapter is object lifecycle management. For the most part, Java attempts to minimize the effort developers must put into managing the lifecycle of objects: the developer creates the objects when needed, and when they are no longer needed, the objects fall out of scope and are freed by the garbage collector.
There are times when this normal lifecycle is not optimal. Some objects are expensive to create, and managing the lifecycle of those objects will improve the efficiency of an application, even at the expense of requiring some additional work by the garbage collector. This section explores when and how the normal lifecycle of objects should be changed, either by reusing the objects, or by maintaining special references to them.
Object Reuse
There are two ways by which object reuse is commonly achieved: object pools and thread local variables. GC engineers around the world are now groaning, since either of these techniques hampers the efficiency of GC. Object pooling in particular is widely disliked in GC circles for that reason, though for that matter, object pools are also widely disliked in development circles for many other reasons as well.
At one level, the reason for this position seems obvious: objects that are reused stay around for a long time in the heap. If there are a lot of objects in the heap, then there is less room to create new objects, and hence GC operations will occur more frequently. But that is only part of the story.
As we saw in Chapter 6, when an object is created, it is allocated in eden. It will spend a few young GC cycles shuffling back and forth between the survivor spaces, before finally it gets promoted to the old generation. Each time the (recently- or) newly-created pooled object is processed, the GC algorithm must perform some work to copy it and adjust references to it until it finally makes it into the old generation.
Although that seems like it might be the end of it, once the object is promoted to the old generation, it can cause even more performance problems. The length of time it takes to perform a full GC is proportional to the number of objects that are still alive in the old generation. The amount of live data is more important even than the size of the heap; it is faster to process a 3 GB old generation with few surviving objects than to process a 1 GB old generation where 75% of the objects survive.
Using a concurrent collector and avoiding full GCs doesn’t make the situation that much better, since the time required by the marking phases of the concurrent collectors similarly depends on the amount of still-live data. And for CMS in particular, the objects in a pool are likely to be promoted at different times, increasing the chance of a concurrent failure due to fragmentation. Overall, the longer objects are kept in the heap, the less efficient GC will be.
So: object reuse is bad. Now we can discuss how and when to reuse objects.
The JDK provides some common object pools: the thread pool, which is discussed in Chapter 9, and soft references. Soft references—which are discussed later in this section—are essentially a big pool of reusable objects. Java EE, meanwhile, depends on object pools for connections to databases and other resources, and the entire lifecycle of Enterprise Java Beans is built around the notion of an object pool.
The situation is similar for thread local values; the JDK is filled with classes that use thread local variables to avoid reallocating certain kinds of objects.
Clearly, even Java experts understand the need for object reuse in some circumstances.
The reason for reusing objects is that many objects are quite expensive to initialize, and re-using those objects is more efficient than the trade-off in increased GC time. That is certainly true of things like the JDBC connection pool: creating the network connection, and possibly logging in and establishing a database session, is quite expensive. Object pooling in that case is a big performance win. Threads are pooled to save the time associated with creating a thread; random number generators are supplied as thread-local variables to save the time require to seed them; and so on.
One feature these examples share is that it takes a long time to initialize the object. In Java, object allocation is quite fast and inexpensive (and arguments against object reuse tend to focus on that part of the equation). Object initialization performance depends on the object. You should only consider reusing objects with a very high initialization cost, and only then if the cost of initializing those objects is one of the dominant operations in your program.
Another feature these examples share is that the number of shared objects tends to be small, which minimizes their impact on GC operations: there aren’t enough of them to slow down those GC cycles. Having a few objects in a pool isn’t going to affect the GC efficiency too much; filling the heap with pooled objects will slow down GC significantly.
Here are just some examples of where (and why) the JDK and Java EE reuse objects:
- Thread Pools
- Threads are expensive to initialize.
- JDBC Pools
- Database connections are expensive to initialize.
- EJB Pools
- EJBs can be expensive to initialize (see Chapter 10).
- Large arrays
-
Java requires that when an array is allocated,
all individual elements in the array must be initialized to some default value
(
null, 0, or false as appropriate). This can be quite time-consuming for large arrays. - Native NIO buffers
-
Allocating a direct
java.nio.Buffer(that is, a buffer returned from calling theallocateDirect()method) is an expensive operation regardless of the size of the buffer. It is better to create one large buffer and managing the buffers from that by slicing off portions as required, and returning them to be reused by future operations. - Security Classes
-
Instances of
MessageDigest,Signature, and other security algorithms are expensive to initialize. The apache-based XML code uses thread local variables to save these instances. - String encoder and decoder objects
- Various classes in the JDK create and reuse these objects. For the most part, these are also soft references, as we’ll see in the next section.
- StringBuilderHelpers
-
The
BigDecimalclass reuses aStringBuilderobject when calculating intermediate results. - Random number generators
-
Instances of either the
Randomand—especially—SecureRandomclasses are expensive to seed. - Names obtained from DNS lookups
- Network lookups are expensive.
- Zip encoders and decoders
- In an interesting twist, these are not particularly expensive to initialize. They are, however, quite expensive to free, because they rely on object finalization to ensure that the native memory they use is also freed. See Finalizers and Final References for more details.
There are some differences in performance between the two options (object pools and thread local variables) being discussing here; let’s look at those in more detail.
Object Pools
Object pools are disliked for many reasons, only some of which have to do with their performance. They can be difficult to size correctly, and they place the burden of object management back on the programmer: rather than simply letting an object go out of scope, the programmer must remember to return the object to the pool.
The focus here, though, is on the performance of an object pool, which is subject to the following:
- GC Impact
- As we’ve seen, holding lots of objects reduces (sometimes quite drastically) the efficiency of GC.
- Synchronization
- Pools of objects are inevitably synchronized, and if the objects are frequently removed and replaced, the pool can have a lot of contention. The result: access to the pool can become slower than initializing a new object.
- Throttling
This performance impact of pools can be beneficial: pools allow access to scare resources to be throttled. As discussed in Chapter 2, if you attempt to increase load on a system beyond what that system can handle, performance will decrease. This is one reason thread pools are important. If too many threads run simultaneously, the CPUs will be overwhelmed and performance will degrade (an example of that is shown in Chapter 9.)
This principle applies to remote system access as well, and is frequently seen with JDBC connections. If more JDBC connections are made to a database than it can handle, performance of the database will degrade. In these situations, it is better to throttle the number of resources (e.g., JDBC connections) by capping the size of the pool—even if it means that threads in the application must wait for a free resource.
Thread Local Variables
There are different performance trade-offs when reusing objects by storing them as thread local variables:
- Lifecycle Management
-
Thread local variables are much easier and less-expensive to manage than
objects in a pool. Both techniques require you to obtain the initial object:
you check it out of the pool, or you call the
get()method on the thread local object. But object pools require that you return the object when you are done with it (else no one else can use it); thread local objects are always available within the thread and needn’t be explicitly returned. - Cardinality
Thread local variables usually end up with a one-to-one correspondence between the number of threads and the number of saved (reused) objects. That isn’t strictly the case. The thread’s copy of the variable isn’t created until the first time the thread uses it, so it is possible that there are fewer saved objects than threads. But there cannot be any more saved objects than threads, and much of the time it ends up being the same number.
On the other hand, an object pool may be sized arbitrarily. If a servlet sometimes needs one JDBC connection and sometimes needs two, the JDBC pool can be sized accordingly (with, say, twelve connections for eight threads). Thread-local variables cannot do this effectively; nor can they throttle access to a resource (unless the number of threads itself serves as the throttle).
- Synchronization
-
Thread local variables need no synchronization
since they can only be used within a single thread; the
thread local
get()method is relatively fast.[46]
Synchronization brings up an interesting point, because the performance
benefit of thread local objects is often couched in terms of saving
synchronization costs (rather than in the savings from reusing an object).
For example, Java 7 introduced a
ThreadLocalRandom
class; that class (rather than a single
Random
instance) is used in the sample stock
applications. Otherwise, many of the examples throughout the book would
encounter a synchronization bottleneck on the
next()
method of the single
Random
object. Using a thread local object
is a good way to avoid a synchronization bottlenecks since only one thread
can ever use that object.
However, that synchronization problem would have been solved just as easily if
the examples had simply created a new instance of the
Random
class each time one was needed. Solving the synchronization problem
that way would not have helped the overall performance, though:
it is quite expensive to
initialize a
Random
object, and continually creating instances of that class would have
had worse performance than
the synchronization bottleneck from many threads sharing one instance of
the class.
Better performance comes from using the
ThreadLocalRandom
class, as is shown in Table 7-4.
This example uses the
batching stock application, and either creates a new instance
of a
Random
object or reuses a
ThreadLocalRandom
for each stock:
ThreadLocalRandom on Stock calculations| Number of Stocks | Allocation new Random | Reuse ThreadLocalRandom |
1 | 0.174 seconds | 0.175 seconds |
10 | 0.258 seconds | 0.236 seconds |
100 | 0.564 seconds | 0.49 seconds |
1,000 | 2.308 seconds | 1.916 seconds |
10,000 | 17.32 seconds | 13.55 seconds |
The lesson here—and in general for object reuse—is that when initialization of objects takes a long time, don’t be afraid to explore object pooling or thread local variables to reuse those expensive-to-create objects. As always, though, strike a balance: large object pools of generic classes will most certainly lead to more performance issues than they solve. Leave these techniques to classes that are expensive to initialize, and when the number of the reused objects will be small.
Quick Summary
- Object reuse is discouraged as a general-purpose operation but may be appropriate for small groups of objects that are expensive to initialize.
- There are trade-offs between reusing an object via an object pool or using a thread-local variable. In general, thread local variables are easier to work with, assuming that a one-to-one correspondence between threads and reusable objects is desired.
Weak, Soft, and Other References
Weak and soft references in Java also allow objects to be reused, though
as developers, we don’t always think of it in those terms. These kind of
references—which I will generally refer to as indefinite references—are more frequently used to cache the result of a long calculation
or a database lookup rather than to reuse a simple object. For example, in
the stock servlet, an indirect reference could be used to cache the result
of the
getHistory()
method (which entails either a lengthy calculation or
a long database call). That result is just an object, and when it is cached
via an indefinite reference, we are simply reusing the object because it is
otherwise expensive to initialize.
Still, to many programmers this “feels” different. In fact, even the terminology reflects that: no one speaks of “caching” a thread for reuse, but we will explore the reuse of indefinite references in terms of caching the result of database operations.
The advantage to an indefinite reference over an object pool or a thread local variable is that indefinite references will be (eventually) reclaimed by the garbage collector. If an object pool contains the last 10,000 stock lookups that have been performed and the heap starts running low, the application is out of luck: whatever heap space remains after those 10,000 elements are stored is all the remaining heap the application can use. If those lookups are stored via indefinite references, the JVM can free up some space (depending on the type of reference), giving better GC throughput.
The disadvantage is that indefinite references have a slightly greater effect on the efficiency of the garbage collector. Figure 7-7 shows a side-by-side comparison of the memory used without and with an indefinite reference (in this case, a soft reference).
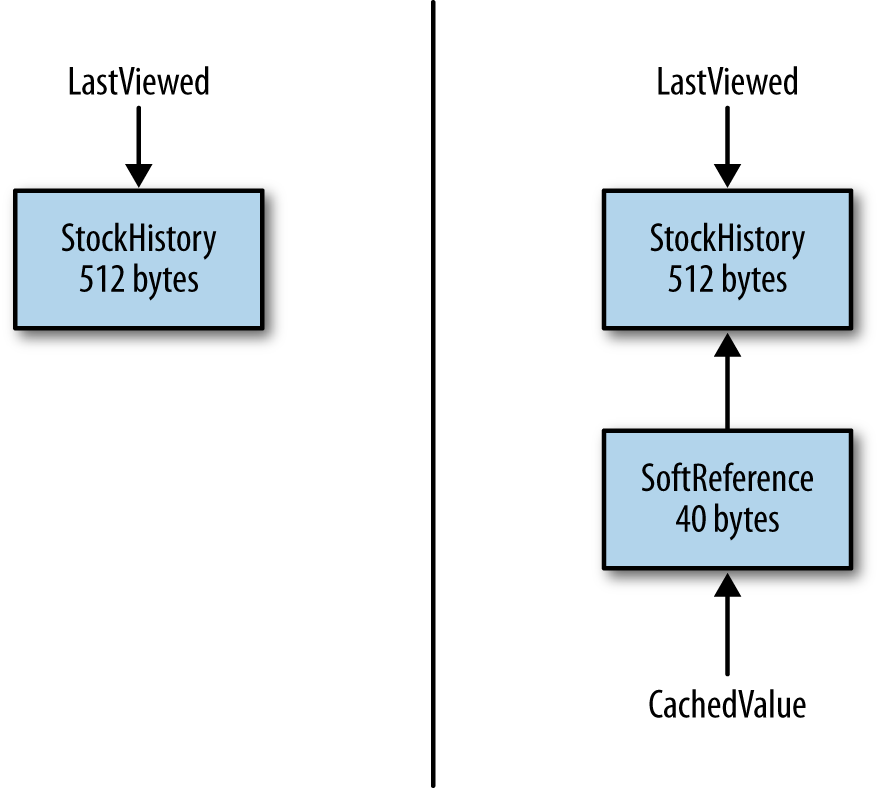
The object being cached occupies 512 bytes. On the left, that’s all the
memory consumed (absent the memory for the instance variable pointing to the
object). On the right, the object is being cached inside a
SoftReference
object, which adds 40 additional
bytes of memory consumption. Indefinite references are just like any other
object: they consume memory, and other things (the
cachedValue
variable on the right-hand side of the diagram)
reference them strongly.
So the first impact on the garbage collector is that indefinite references cause the application to use more memory. A bigger impact on the garbage collector is that it takes at least two GC cycles for the indefinite reference object to be reclaimed by the garbage collector.
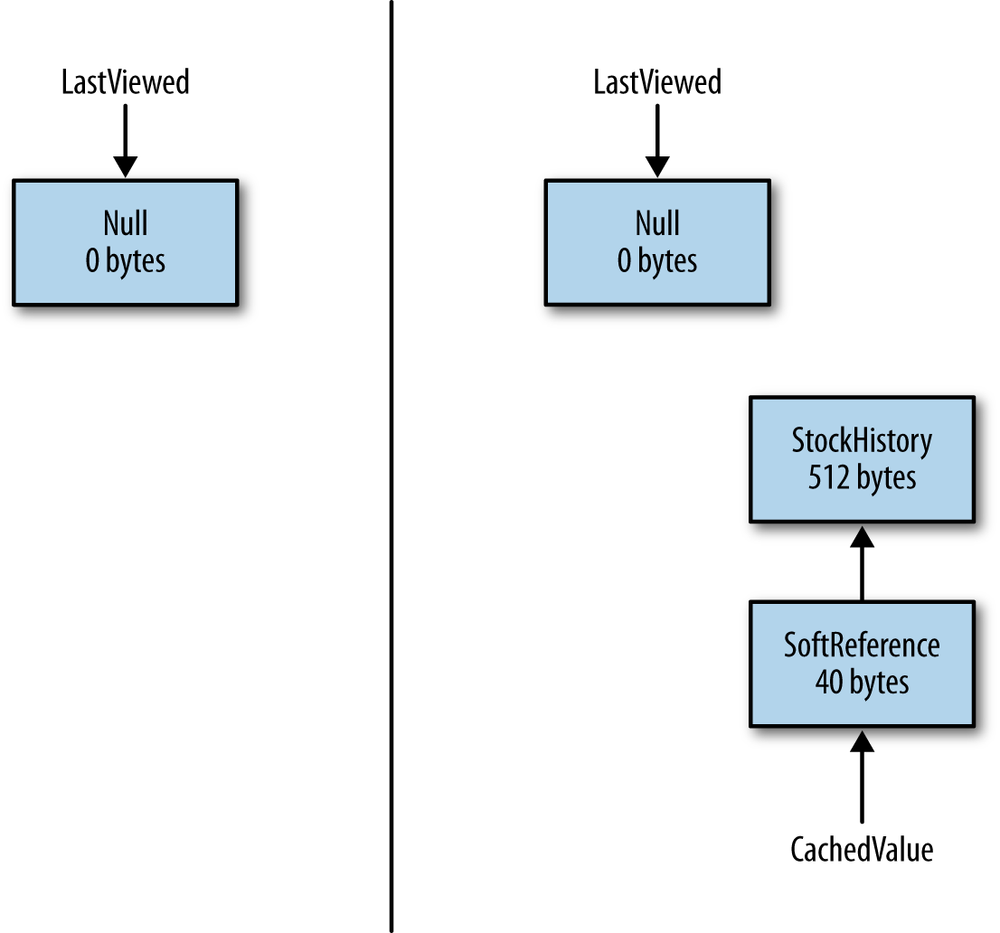
Figure 7-8 shows what happens when referent is no longer strongly
referenced (i.e., the
lastViewed
variable has been set to null). If there are no references
to the stock history object, it is freed during the next garbage collection.
So the left side of the diagram now consumes zero bytes.
On the right-hand side of the diagram, memory is still consumed. The exact point at which the referent gets freed varies by the type of the indefinite reference, but for now let’s take the case of a soft reference. The referent will stick around until the JVM decides that the object has not been used recently enough. When that happens, the first GC cycle frees the referent—but not indefinite reference object itself. The application ends up with the memory state shown in Figure 7-9.
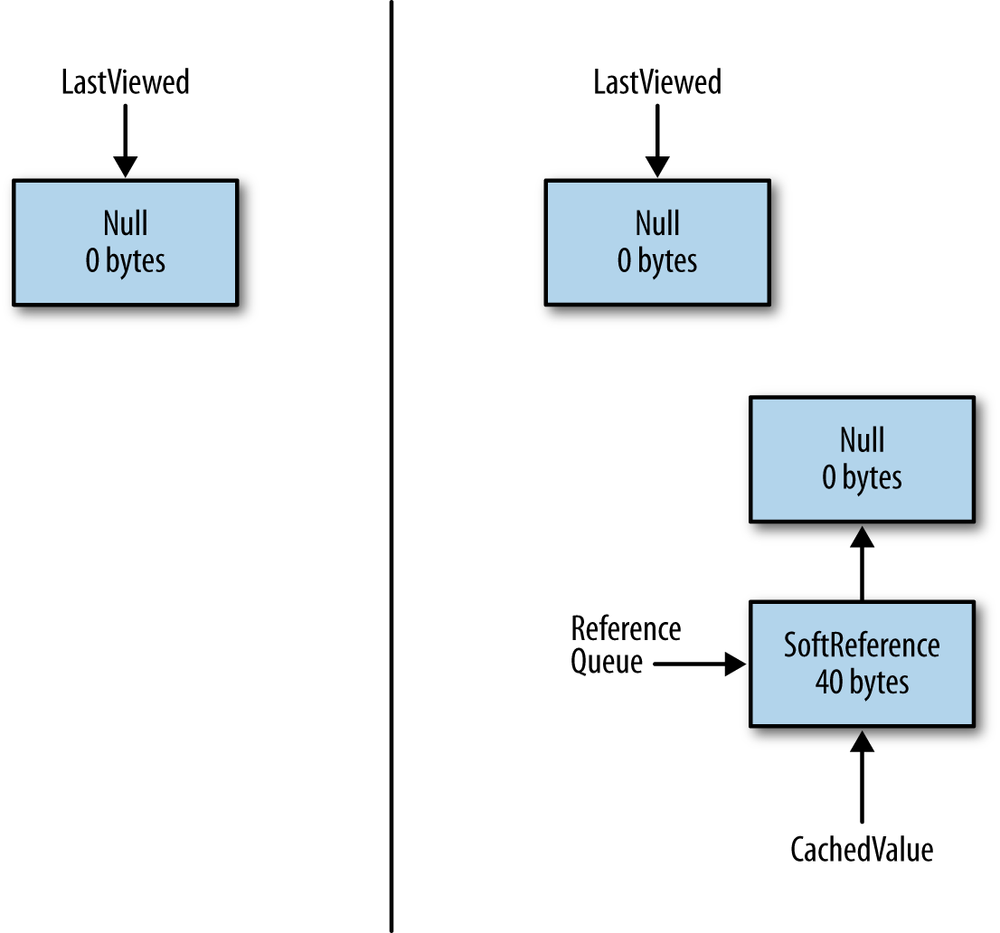
The indefinite reference object itself now has (at least) two strong references to it—the original strong reference(s) created by the application, and a new strong reference (created by the JVM) on a reference queue. All of these strong references must be cleared before the indefinite reference object itself can be reclaimed by the garbage collector.
Typically this cleanup happens by whatever code is processing the reference queue. That code will get notified that there is a new object on the queue and immediately remove all strong references to that object. Then during the next GC cycle, the indefinite reference object will get freed. In the worst case, that reference queue will not be processed immediately, and there can be many GC cycles before everything is cleaned up. Even in the best case, though, the indefinite reference had to go through two GC cycles before it was freed.
Depending on the type of indefinite reference, there are some important variations to this general algorithm, but all indefinite references have this penalty to some degree.
Soft References
Soft references are used when the object in question has a good chance of being reused in the future, but you want to let the garbage collector reclaim the object if it hasn’t been used that recently (a calculation which also takes into consideration how much memory the heap has available). Soft references are essentially one large, least-recently-used (LRU) object pool. The key to getting good performance from them is to make sure that they are cleared on a timely basis.
Here is an example. The stock servlet can set up a global
cache of stock histories keyed by their symbol (or symbol and date). When
a request comes in for the stock history of TPKS from 6/1/13 to 8/31/13,
the cache can be consulted to see if the result from a similar request is
already there.
The reason to cache that data is that requests tend to come in for certain
items more often than for other items. If TPKS is the most requested stock,
it can be expected to remain in the soft reference cache. On the other
hand, a lone request for KENG
will live in the cache for a while, but eventually be reclaimed. This also
accounts for requests over time: a cluster of requests for DNLD can reuse
the result from the first request. As users realize that DNLD is a bad
investment, those cached items will eventually age out of the heap.
When, exactly, is a soft reference freed? First the referent must not be strongly referenced elsewhere. If the soft reference is the only remaining reference to its referent, the referent is freed during the next GC cycle only if the soft reference has not recently been accessed. Specifically, the equation functions like this pseudo-code:
long ms = SoftRefLRUPolicyMSPerMB * AmountOfFreeMemoryInMB;
if (now - last_access_to_reference > ms)
   free the reference
There are two key values here. The first is set by the
-XX:SoftRefLRUPolicyMSPerMB=N
flag, which has a default value of 1000.
The second value is the amount of free memory in the heap (once the GC cycle has completed). Since the heap is sized dynamically, the JVM has two choices when it calculates how much memory in the heap is free: the free memory in the heap at its current size, or the free memory in the heap if it were to expand to its maximum capacity. The choice of those values is determined by the compiler in use. The client compiler bases that value on the available memory in the current heap, while the server compiler uses the maximum possible size of the heap.
So how does that all work?
Take the example of a JVM using the server compiler and a 4 GB heap.
After a full GC (or a concurrent cycle), the heap might be 50% occupied;
the free heap is therefore 2 GB. The default value of
SoftRefLRUPolicyMSPerMB
(1000)
means that any soft
reference which has not been used for the past 2048 seconds
(2048000 milliseconds)
will be cleared: the free heap is 2048 (in MB), which is multiplied by 1000.
   long ms = 2048000; // 1000 * 2048
   if (System.currentTimeMillis() - last_access_to_reference_in_ms > ms)
       free the reference
If the 4 GB heap is 75% occupied, objects not accessed in the last 1024 seconds are reclaimed, and so on.
To reclaim soft references more frequently, decrease
the value of the
SoftRefLRUPolicyMSPerMB
flag. Setting that value to 500 means that a JVM with 4 GB heap which is
75% full will reclaim objects not accessed in the
past 512 seconds.
Tuning this flag is often necessary if the heap fills up quickly with soft references. Say that the heap has 2 GB free and the application starts to create soft references. If it creates 1.7 GB of soft references in less than 2048 seconds (roughly 34 minutes), none of those soft references will be eligible to be reclaimed. There will be only 300 MB of space left in the heap for other objects; GC will occur quite frequently as a result (yielding very bad overall performance).
If the JVM completely runs out of memory
or starts thrashing too severely,
it will clear all soft references, since the alternative would be to throw
an
OutOfMemoryError
Not throwing the out of memory error is good,
but indiscriminately
throwing away all the cached results is probably not ideal.
Hence, another time to lower the
SoftRefLRUPolicyMSPerMB
value is when
the reference processing GC logs indicate that very large number of soft
references are being cleared unexpectedly. As discussed in GC Overhead Limit Reached,
that will only occur after four consecutive full GC cycles (and only if
other factors apply).
On the other side of the spectrum, a long-running application can consider raising that value if two conditions are met:
- There is a lot of free heap available.
- The soft references are infrequently accessed.
That is a quite unusual situation. It is similar to a situation discussed about setting GC policies: you may think that if the soft reference policy value is increased that you are telling the JVM to discard soft references only as a last resort. That is true, but you’ve also told the JVM not to leave any headroom in the heap for normal operations, and you are quite likely to end up spending too much time in GC instead.
The caution, then, is not to use too many soft references, since they can easily fill up the entire heap. This caution is even stronger than the caution against creating an object pool with too many instances: soft references work well when the number of objects is not too large. Otherwise, consider a more traditional object pool with a bounded size, implemented as an LRU cache.
Weak References
Weak references should be used when the referent in question will be used by several threads simultaneously. Otherwise, the weak reference is too likely to be reclaimed by the garbage collector: objects that are only weakly referenced are reclaimed at every GC cycle.
What that means is that weak references never get into the state shown (for soft references) in Figure 7-8. When the strong references are removed, the weak reference is immediately freed. Hence the program state moves directly from Figure 7-7 to Figure 7-9.
The interesting effect here, though, is where the weak reference ends up in the heap. Reference objects are just like other Java objects: they are created in the young generation and eventually promoted to the old generation. If the referent of the weak reference is freed while the weak reference itself is still in the young generation, the weak reference will be freed quickly (at the next minor GC).footnote[This assumes that the reference queue is quickly processed for the object in question.] If the referent remains around long enough for the weak reference to be promoted into the old generation, then the weak reference will not be freed until the next concurrent or full GC cycle.
Using the cache of the stock servlet as an example: let’s say we know that
if a particular user accesses TPKS during her session, she is almost
always likely to access it again. It makes sense to keep the values
for that stock
as a strong reference in the user’s HTTP session: it will always be there
for her,
and as soon as she logs out, the HTTP session is cleared and the memory
reclaimed.
Now when another user comes along and needs data for TPKS, how will they
find it? Since the object is memory somewhere, we don’t want to look it up
again, but the servlet code can’t search the session data for other users
to find it. So
in addition to keeping a strong reference to the TPKS data in the first
user’s HTTP session, it makes sense to keep a weak reference to that data in
a global cache.
Now the second user will be able to find the TPKS data—assuming that the
first user has not logged out and cleared her session.[47]
This is what is meant by simultaneously access. It is as if we are saying to the JVM: “Hey, as long as someone else is interested in this object, let me know where it is, but if they no longer need it, throw it away and I will recreate it myself.” Compare that to a soft reference, which essentially says: “Hey, try and keep this around as long as there is enough memory and as long as it seems that someone is occasionally accessing it.”
Not understanding this distinction is the most frequent performance issue that occurs when using weak references. Don’t make the mistake of thinking that a weak reference is just like a soft reference except that it is freed more quickly: a softly referenced object will be available for (usually) minutes or even hours, but a weakly referenced object will be available only for as long as its referent is still around (subject to the next GC cycle clearing it).
Finalizers and Final References
Every Java class has a
finalize()
method inherited from the
Object
class; that method can used to clean up data once the object is eligible for
garbage collection. That sounds like a nice feature, and it is required in
a few circumstances. In practice, it turns out to be a bad idea, and
you should try very hard not to use
this method.
Finalizers are bad for functional reasons, and
they are also bad for performance. Finalizers are actually a special case of
an indefinite reference: the JVM uses a private reference class
(java.lang.ref.Finalizer
which in turn is a
java.lang.ref.FinalReference)
to keep track of objects
that have defined a
finalize()
method. When an object
that has a
finalize()
method is allocated, the JVM allocates
two objects:
the object itself, and a
Finalizer
reference that uses the object as its
referent.
As with other indefinite references, it takes at least two
GC cycles before the indefinite reference object can be freed. However,
the penalty here is much greater that with other indefinite reference types.
When the referent of a soft or weak reference is eligible for GC, the
referent itself is immediately freed; that lead to the memory use previously
shown in Figure 7-9. The weak or soft reference
is placed on the
reference queue, but the reference object no longer refers to anything
(that is, its
get()
method returns null
rather than the original referent).
In the case of soft and weak references, the two-cycle penalty for
GC applies only to the reference object itself (and not the
referent).
This is not the case for final references. The implementation
of the
Finalizer
class must have access to the referent in
order to call the referent’s
finalize()
method, so the referent cannot be freed when the finalizer reference is
placed on its reference queue. When the referent of a finalizer becomes
eligible
for collection, the program state is reflected by Figure 7-10.
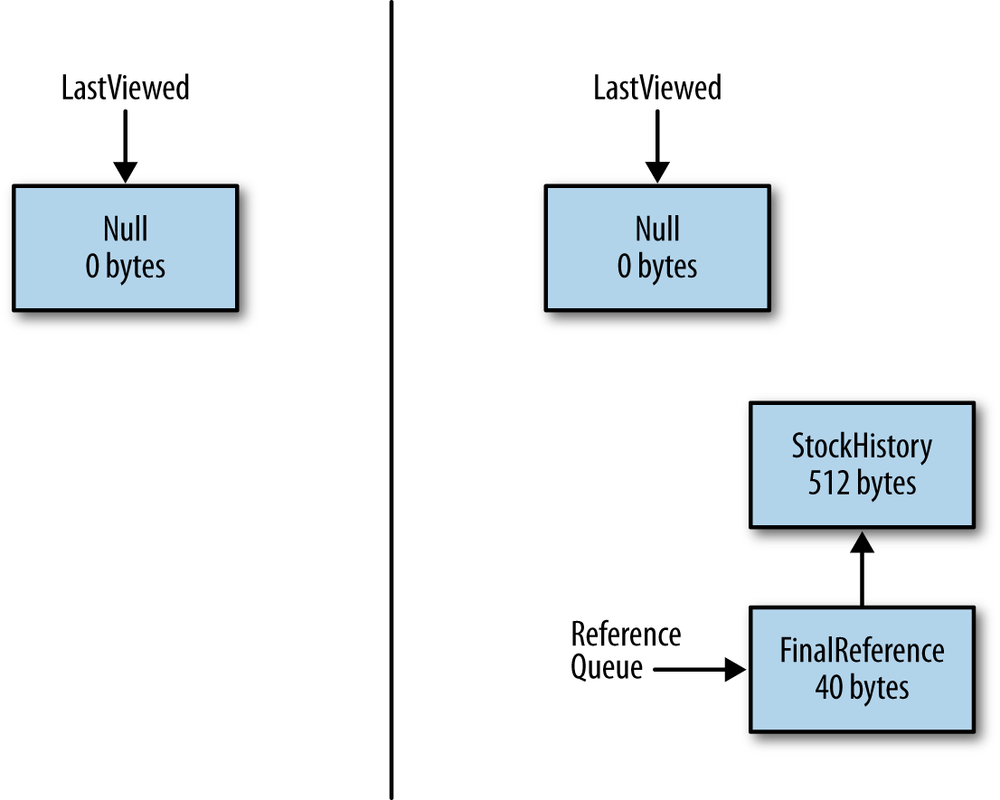
When the reference queue processes the finalizer, the
Finalizer
object (as usual) will be removed from the queue and then eligible for
collection. Only then will the referent also be freed.
This is why finalizers
have a much greater performance effect on GC than
other indefinite references—the memory consumed by the referent can
be much more significant than the memory consumed by the indefinite reference
object.
This leads to the functional problem with finalizers, which is that the
finalize()
method can inadvertently create a new strong reference to the
referent. That again causes a GC performance penalty—now
the referent won’t be freed until it is no longer strongly referenced again.
And
functionally it creates a big problem because the next time the referent is
eligible to be collected, its
finalize()
method won’t be called, and the
expected cleanup of the referent won’t happen. This kind of error is reason
enough why finalizer should be used as seldom as possible.
Unfortunately, finalizers are unavoidable in certain circumstances. The JDK,
for
example, uses a finalizer in its classes that manipulate zip files, because
opening a zip file uses some native code that allocates native memory. That
memory is freed when the zip file is closed, but what happens if the
developer forgets to call the
close()
method?
The finalizer can
ensure that the
close()
method has been called, even if the developer forgets that.
As a rule, then, if you are in a situation where a finalizer is unavoidable, make sure that the memory accessed by the object is kept to a minimum.
There is an alternative to using finalizers that avoids at least some of
these problems—and in particular, it allows
the referent to be
freed during normal GC operations. This is accomplished by
simply using another kind of
indefinite
reference rather than implicitly using a
Finalizer
reference.
It is sometimes recommended to use yet another indefinite reference type
for this: the
PhantomReference
class.
That’s a good choice, because the reference
object will be cleaned up relatively quickly once the referent is no longer
strongly referenced, and while debugging, the purpose of the reference is
clear. Still, the same goal can be achieved also with a weak
reference (plus the weak reference can be used in more places). And in certain
circumstances, a soft reference could be used if the caching
semantics of the soft reference match the need of the application.
To create a substitute finalizer, you must create a subclass of the indefinite
reference
class to hold any information that needs to be cleaned up after the referent
has been collected. Then you perform the cleanup in a method of the reference
object (as opposed to defining a
finalize()
method in the referent class).
privatestaticclassCleanupFinalizerextendsWeakReference{privatestaticReferenceQueue<CleanupFinalizer>finRefQueue;privatestaticHashSet<CleanupFinalizer>pendingRefs=newHashSet<>();privatebooleanclosed=false;publicCleanupFinalizer(Objecto){super(o,finRefQueue);allocateNative();pendingRefs.add(this);}publicvoidsetClosed(){closed=true;doNativeCleanup();}publicvoidcleanup(){if(!closed){doNativeCleanup();}}privatenativevoidallocateNative();privatenativevoiddoNativeCleanup();}
Here is the outline of such a class, which uses a weak reference. The
constructor here allocates some native resource. Under normal usage,
the
setClosed()
method is expected to be called; that will cleanup
the native memory.
However, the weak reference is also placed on a reference queue. When the reference is pulled from the queue, it can check to make sure the native memory has been clean up (and clean it if it has not).
Processing of the reference queue happens in a daemon thread:
static{finRefQueue=newReferenceQueue<>();Runnabler=newRunnable(){publicvoidrun(){CleanupFinalizerfr;while(true){try{fr=(CleanupFinalizer)finRefQueue.remove();fr.cleanup();pendingRefs.remove(fr);}catch(Exceptionex){Logger.getLogger(CleanupFinalizer.class.getName()).log(Level.SEVERE,null,ex);}}}};Threadt=newThread(r);t.setDaemon(true);t.start();}
All of that is in a
private
static
inner class hidden from the developer
using the actual class, which looks like this:
publicclassCleanupExample{privateCleanupFinalizercf;privateHashMapdata=newHashMap();publicCleanupExample(){cf=newCleanupFinalizer(this);}...methodstoputthingsintothehashmap...publicvoidclose(){data=null;cf.setClosed();}}
Developers construct this object just as they would any other object. They
are told to
call the
close()
method, which will clean up the native memory—but if they don’t, it’s okay.
The weak reference still exists behind the scenes, so the
CleanupFinalizer
class
has its own chance to clean up that memory when the inner class processes the
weak reference.
The one tricky part of this example is the need for the
pendingRefs
set
of weak references. Without that, the weak references themselves will be
collected before there is the chance to put them onto the reference queue.
This example overcomes two limitations of the traditional finalizer: it
offers better performance because the memory associated with the referent
object (the
data
hashmap in this case) is released as soon as the referent
is collected (rather than doing that in the
finalizer()
method). And
there is no way for the referent object to be resurrected in the cleanup
code, since it has already been collected.
Still, other objections that apply to the use of finalizers apply to this code as well: you can’t ensure the garbage collector will ever get around to freeing the referent, nor that the reference queue thread will ever process any particular object on the queue. If there are a large number of these objects, processing that reference queue will be quite expensive. Like all indefinite references, this example should still be used sparingly.
Quick Summary
- Indefinite (soft, weak, phantom, final) references alter the ordinary lifecycle of Java objects, allowing them to be reused in ways that may be more GC-friendly than pools or thread local variables.
- Weak references should be used when an application is interested in an object only if that object is strongly-referenced elsewhere in the application.
- Soft references hold onto objects for (possibly) long periods of time, providing a simple GC-friendly LRU cache.
- Indefinite references consume their own memory and hold onto memory of other objects for long periods of time; they should be used sparingly.
Summary
Fast Java programs depend crucially on memory management. Tuning garbage collection is important, but to obtain maximum performance, memory must be utilized effectively within applications.
Current hardware trends tend to dissuade developers from thinking about memory: if my laptop has 16 GB of memory, how concerned need I be with an object that has an extra, unused eight-byte object reference? And we forget that the normal time/space trade-off of programming can swing to a time/space-and-time trade-off: using too much space in the heap can make things slower by requiring more GC. In Java, managing the heap is still important.
Much of that management centers around when and how to use special memory techniques—object pools, thread local variables, and indefinite references. Judicious use of these techniques can vastly improve the performance of an application, but overuse of them can just as easily degrade performance. In limited quantities—when the number of objects in question is small and bounded—the use of these memory techniques can be quite effective.
[37] If you aren’t familiar with this syntax, it comes from the way JNI identifies object types; look at the JNI reference documentation for more details.
[38] Also, the largest retained sizes are often classloaders over which you have little control.
[39] As in Chapter 5, the discussion in this section refers to permgen for simplicity; the same issues can occur with the Java 8 class metaspace if its maximum size is set.
[40] Collection classes are the most frequent cause of a memory leak: the application inserts items into the collection and never frees them.
[41] It is also the case that the hash value for a String is
used quite frequently, and the toString() representation of an object is
often used quite rarely.
[42] Such a bottleneck should still be rare, though; if access to the hash map is that frequent, consider if anything is really saved by initializing it lazily.
[43] And
hopefully it is obvious that you should never create a Boolean object;
you should just use Boolean.TRUE or Boolean.FALSE as necessary.
[44] In that case, though, the code had to call the
canonicalVersion() method of the custom class; this isn’t a simple
replacement for the intern() method.
[45] The symbol table is used to hold some class information. JDK 8 has an experimental flag to adjust the size of that table, but it is not generally tunable.
[46] This wasn’t always the case; in early versions of Java, obtaining a thread local variable was quite expensive. If you shied away from thread local variables because of bad performance in the past, reconsider their use in current versions of Java.
[47] This is the scenario used in the heap analysis section of this chapter where the data had two references and wasn’t easily found by looking objects with the largest retained memory.