Chapter 6. Enterprise Application Operations
In this chapter, we provide an overview of several key tools that are critical to operating your enterprise application. We begin with a discussion of Logstash and Fluentd, which are two popular enterprise-quality tools for performing a centralized log collection for your microservices running distributed across a cluster. We then describe Elasticsearch, which is a log storage repository with advanced knowledge discovery and analysis features. Then, we introduce Kibana, which is a dashboard-based log visualization tool. We complete our discussion of log collection tools with an overview of the log collection support provided by both the IBM Cloud Kubernetes Service and IBM Cloud Private. In the second half of this chapter, we describe the health-management facilities for monitoring enterprise applications. We conclude this chapter with a description of monitoring capabilities provided by both IBM Cloud Kubernetes Service and IBM Cloud Private.
Log Collection and Analysis for Your Microservices
Logs are the universal debugger. When all else fails, check the logs and hope the developer was paying attention to the serviceability of their code.
In all seriousness, logging is a critical component for the operation and service of any Kubernetes-based application. Unlike traditional monolithic applications, developers and operators desire a centralized logging solution that will aggregate logs from their distributed applications to prevent the need to chase down dozens or hundreds of Pods using kubectl logs -f --tail=1000 mypodname.
With microservices, you break down your core functions into smaller building blocks, which means that your logged information is going to be more decentralized. There are several common patterns for collecting logs from containerized platforms.
First, you need a way to collect log information from your containers. Let’s take a look at a couple of tools that can help you with this:
- Logstash
Logstash is a very well-established log aggregator with the capabilities to collect logs, parse, and then transform them to meet your standards.
- Fluentd
Fluentd is an open source data collector that provides an independent and unifying layer between different types of log inputs and outputs. Fluentd was recently contributed to the Cloud Native Computing Foundation (CNCF). Although Fluentd is younger than Logstash, its alignment with the CNCF has driven its increasing popularity.
Both of these options provide a robust way to collect logs from multiple sources—from containers to nodes—and then ship them into a searchable datastore.
After your logs are aggregated, you need a place to store them for discovery and analysis. Elasticsearch is the de facto standard for collecting, indexing, and providing an ongoing store for plain-text or JSON log output. Elasticsearch provides several key features that make it a great option for your log data:
- JSON-based query language, accessible via REST API
You can consume information from Elasticsearch easily for discovery and analysis. Often, Elasticsearch ends up being part of machine learning applications because of its simple but powerful model of querying and updates.
- Log retention policy control
You might need to keep only a week of logs for postmortems when bad things happen. In other cases, compliance or audit requirements might require you to keep logs for months or years. Elasticsearch will automatically age out data that is no longer relevant for your needs.
- Move logs to long-term storage
With Elasticsearch, you can keep a portion of log data where it’s easily accessible and searchable, but then move older logs into a longer-term store.
Finally, now that you have collected the logs and stored them, it’s time to visualize them. Kibana provides a flexible way to visualize your logs with a variety of widgets from tables to graphs. Kibana connects to Elasticsearch and creates Indexer patterns that provide access to data efficiently. With the Kibana dashboard, you can do the following:
- Discover the data available in the system
From the Discover view in the Kibana dashboard, you have access to all of the information in the system for which you have authorization to view. You can define table views for log information and filter based on any log attributes. For example, you might create a filter for kubernetes.namespace: “stock-trader” to see all of the log output for all Pods in the
stock-traderNamespace.- Create reusable widgets to visualize specific aspects
Perhaps you always want to view a table with specific log attributes or you want a line graph of how many logs contain the word “error” in the
stock-traderNamespace. Each visualization is a reusable widget that you can use across one or more dashboards.- Create dashboards
Dashboards allow you to collect visualizations into a single view.
- Create timeline analysis
You can also use Kibana to do time–series analysis from multiple data sources.
IBM Cloud Kubernetes Service Log Analysis Support
IBM Cloud Kubernetes Service uses Fluentd and IBM Cloud Log Analysis service for collecting and analyzing logs. On this platform, there are many logging configuration options outlined in the documentation. Here, you will find a variety of command-line options that you can use to configure very detailed filtering mechanisms. Common options available include filtering to display only error logs and sending logs from different Kubernetes Namespaces to different logging tenants. The simplest process for getting started is through the IBM Cloud Kubernetes Service user interface. Simply choose “enable logging” from the cluster overview page and then select the log sources and destination to get started with a basic logging configuration, as depicted in Figure 6-1.
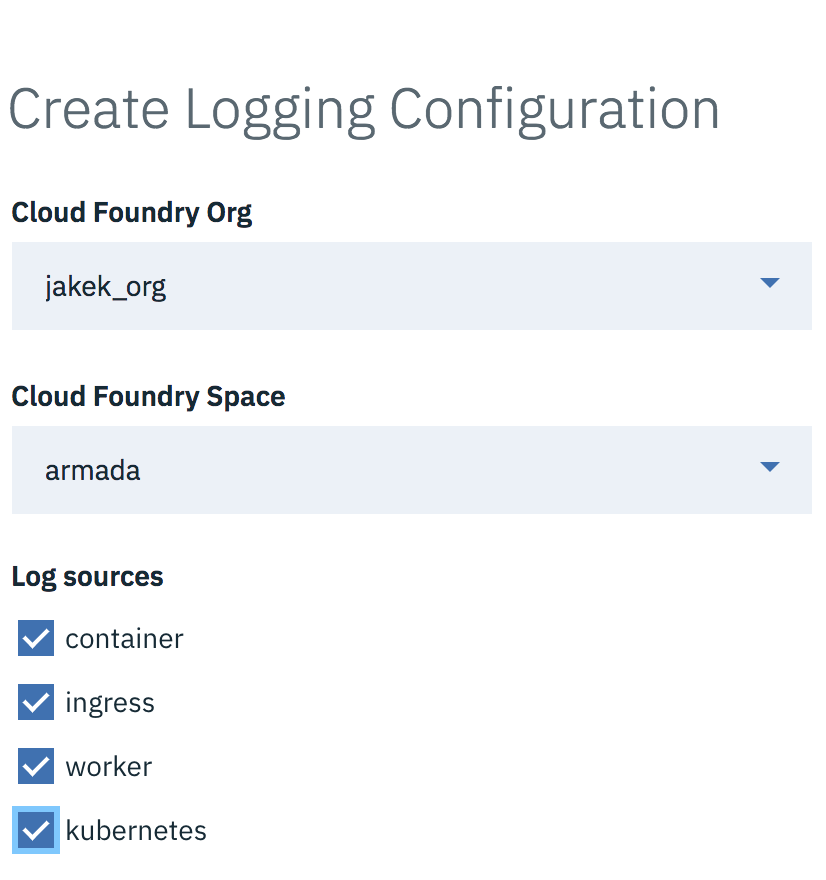
Figure 6-1. Configuring IBM Cloud Kubernetes Service logging.
In addition to container, ingress, worker node, and Kubernetes infrastructure logs, there are other options for logging Kubernetes events via an event-exporter, IBM Cloud Kubernetes Service Activity Tracker events, and Kubernetes audit logs. Figure 6-2 provides an example of IBM Cloud Kubernetes service log data for audit logs.
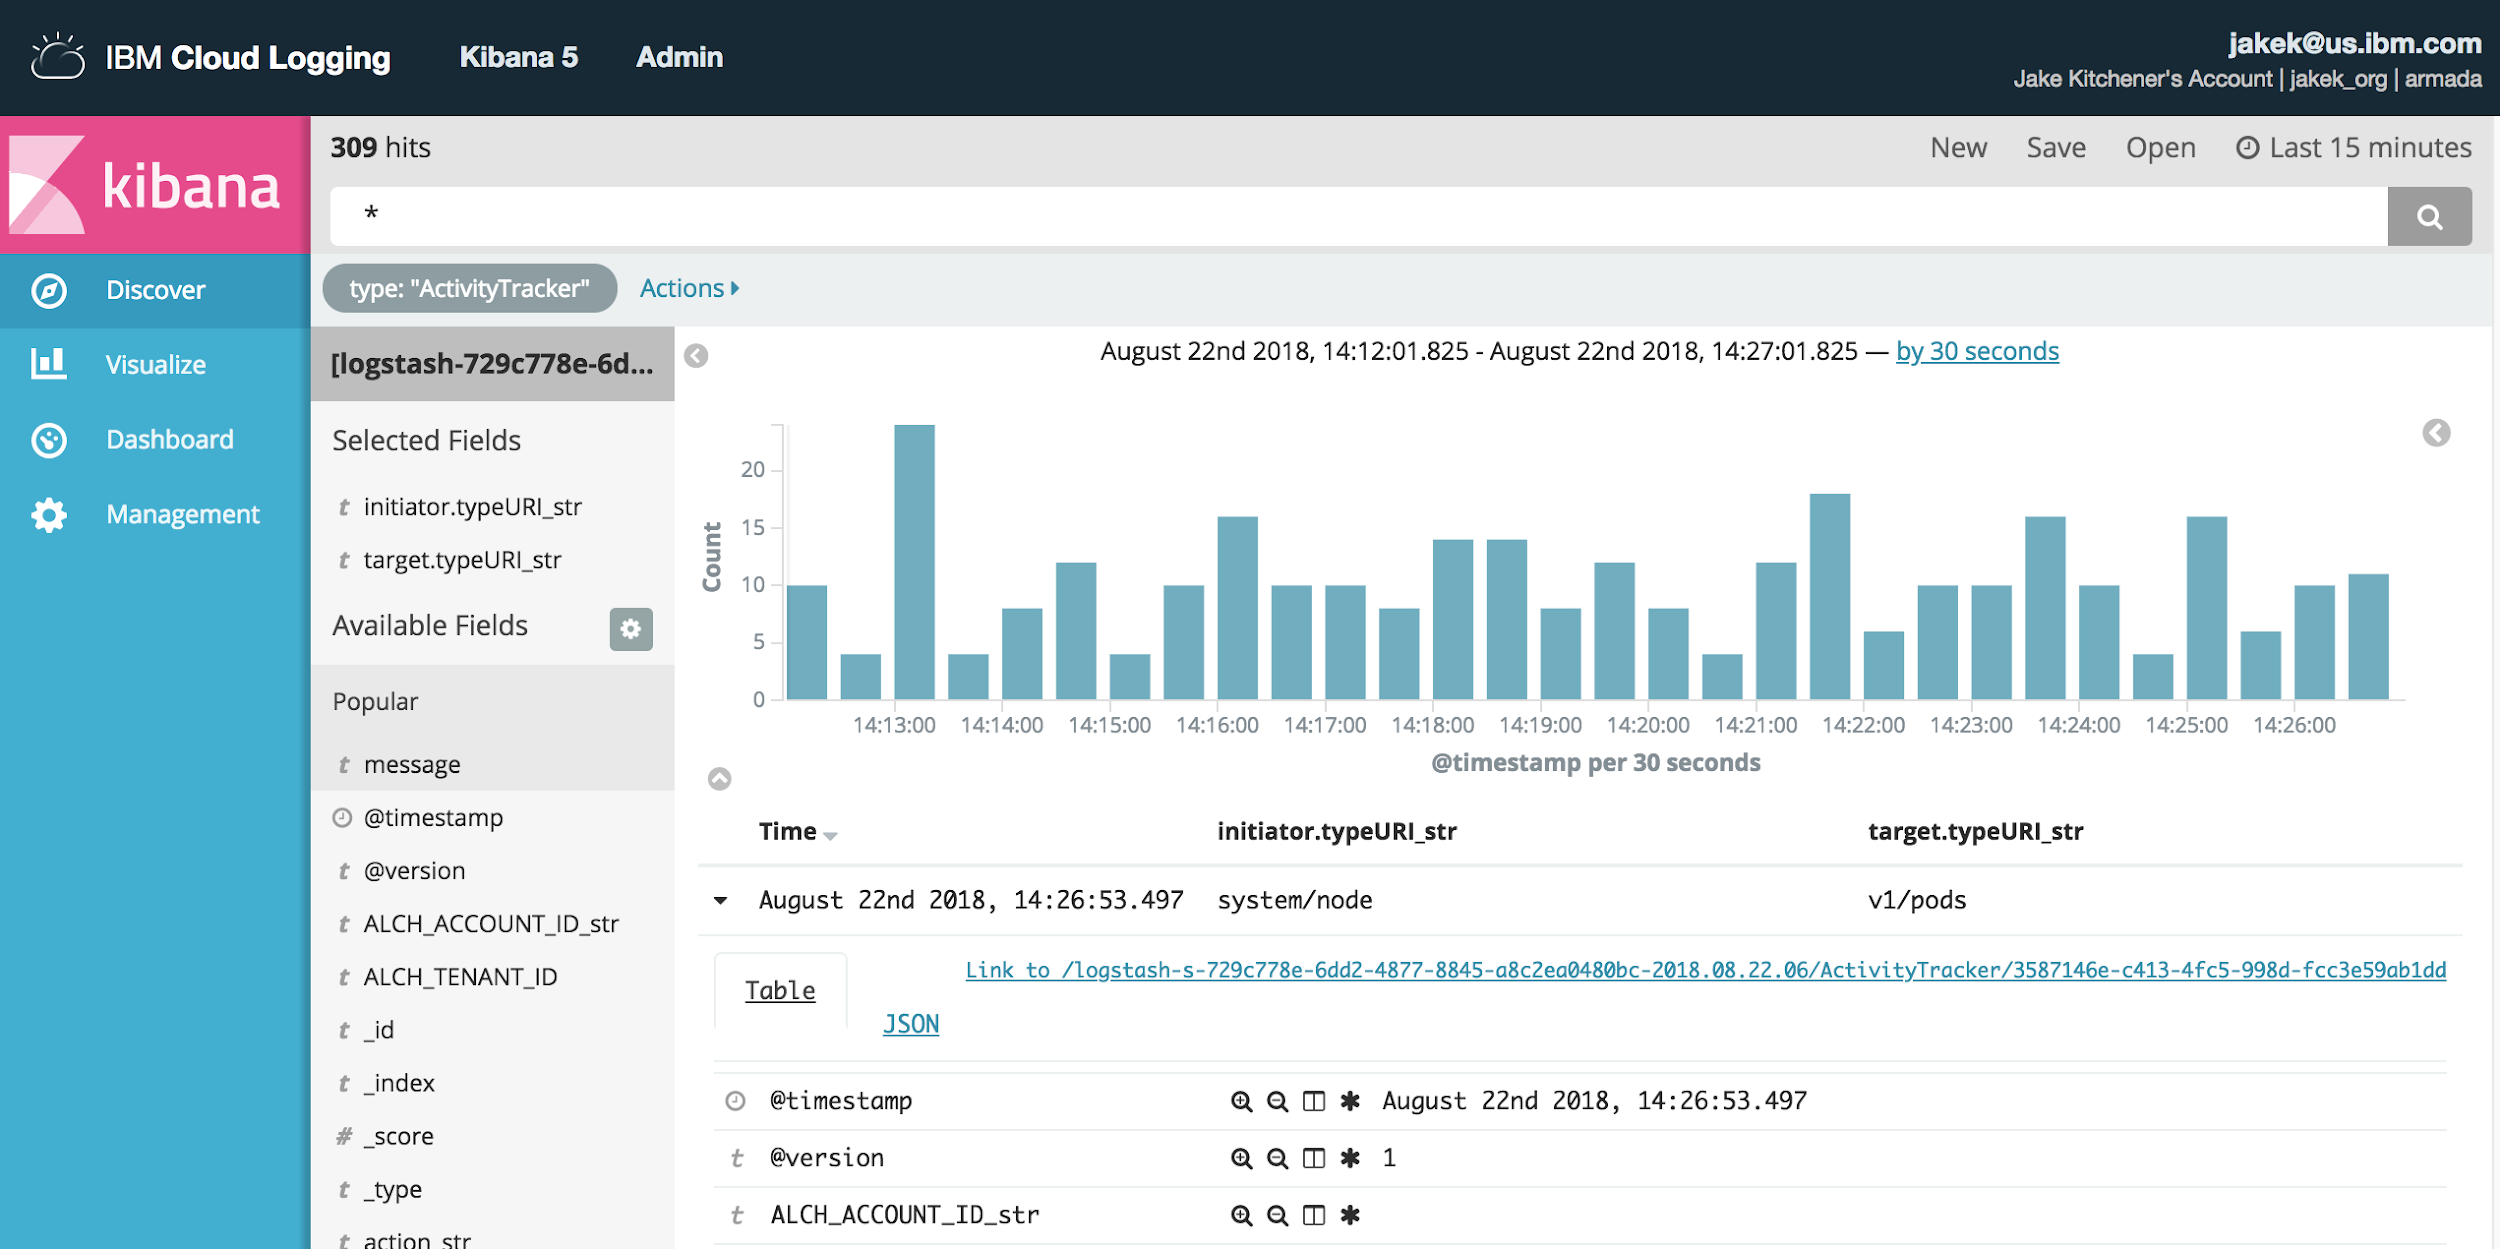
Figure 6-2. Viewing IBM Cloud Log Analysis data for Kubernetes audit log.
IBM Cloud Private Log Analysis Support
IBM Cloud Private uses Elasticsearch-Logstash-Kibana (ELK) to collect log information. You can customize whether these components are installed in the config.yaml file for the installer or add them post-installation from the Catalog.
If you configure these components during installation or update the cluster using the installer’s addon action, you will see references for the Kibana dashboard exposed in the navigation bar on the left, as illustrated in Figure 6-3.

Figure 6-3. Configuring logging in IBM Cloud Private.
A deep dive of the full capabilities of Kibana is beyond the scope of this book, but to get started, try using the Discover view to filter logs by Kubernetes Namespaces. Figure 6-4 illustrates this view filtering option.
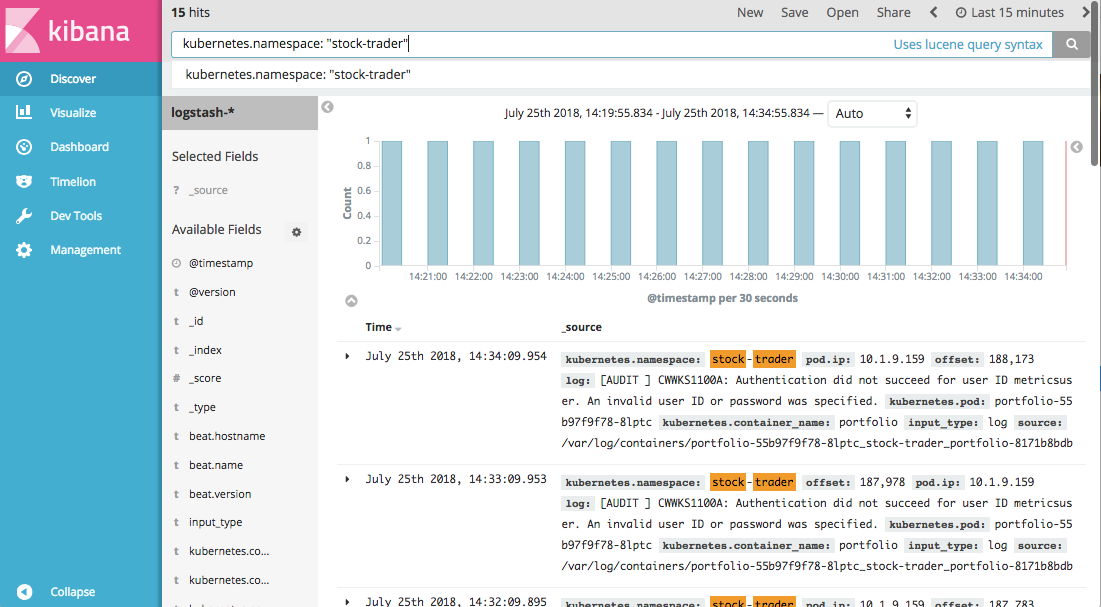
Figure 6-4. Sample display in Kibana of logs filtered by Namespace.
Health Management for Your Microservices
After you’ve deployed your microservice, Kubernetes takes over much of the basic mechanics of application reliability—but you’re not completely off the hook. Managing your application still involves managing its health, investigating issues that arise during an event, performing postmortem analysis, or fulfilling audit compliance.
Fortunately, there are options on how to monitor the health, define alerts, and view an integrated dashboard of logs across all microservices. We will now look at how to consume these management services in one of two modes: deployed on your own cluster or consumed as part of a Software as a Service (SaaS) offering in a public cloud.
Metrics help you to understand the current state of your application. There are many kinds of metrics that provide your application a way to inform observers about its health. You then can use metrics to drive alerts or simply visualize trends on a dashboard.
Prometheus is an open source monitoring and alerting tool. It was contributed to the CNCF in May 2016. Prometheus is one of the CNCF’s more mature projects and was promoted to the status level of “graduated” in August 2018. It is the de facto standard for monitoring when working with Kubernetes. Prometheus makes it easy for any web-based app to expose an additional endpoint, which returns metrics for the application using a simple text-based format.
Prometheus will then scrape the endpoints to collect these metrics and store them. For non-REST-centric workloads (e.g., a database or messaging app), Prometheus supports exporters, which collect information and make it available in the correct format.
Metrics can be kept in memory for a given window of time or saved to long-term storage. You should consider whether long-term trending information is useful for your needs. In many cases, a window of only several hours is kept around in memory.
There are several kinds of metrics supported by Prometheus:
- Counter
A counter is an increasing value that allows you to track the total number of times something has happened. Examples might include the number of requests for your application services, or the total number of widgets that your application programming interface (API) has created.
- Gauge
A gauge provides an arbitrary reading that can go up or down. Think of a gauge as like a thermometer. The temperature reading can go up or down, and prior readings do not have a direct impact on current readings. You might use gauges to track the number of active transactions the system is processing or the total number of active user sessions engaged with your application.
- Histogram
A histogram allows you to capture information that is time–series related. A histogram might declare multiple buckets for grouping observed data. Examples might include the duration of a transaction like a stock trade. Histograms help perform some fundamental heavy lifting for you like calculating the sum of observed values or counting the total number of data points in a given bucket.
- Summary
A summary is similar in behavior to a histogram but automatically calculates quantiles over a sliding time window. Measuring the quantiles can be useful to group metrics like response times (how many responses completed in less than 200 ms? 50%? 95%?).
Kubernetes enables a rich set of metrics out of the box:
- Node Exporter
Captures information about the nodes in your cluster. Metrics such as CPU utilization, disk I/O, network behavior, and filesystem information (nfs, xfs, etc.) are automatically exported.
- cAdvisor
Captures information about containers running on the node. Metrics such as container CPU utilization, filesystem I/O, network behavior, and start time are exported.
- Heapster
Captures specific metrics about Pods and other Kubernetes resources.
Your microservices can also emit Prometheus metrics to provide application-specific details. For instance, our portfolio microservice might emit metrics on the number of trades requested and completed. We can often understand whether the total system is healthy by observing the trends in higher-level metrics such as portfolio trades. Netflix has talked about its use of the stream-starts-per-second (SPS) metric to understand whether the end-to-end system is functioning normally; the rate of video streams started is well understood by the team, and variations from the norm tend to indicate that a problem exists, even if the origin of the problem is not with the service itself.1
Although it’s beyond the scope of this book, enabling metrics for your specific application in Kubernetes is a very straightforward task that we strongly recommend.
IBM Cloud Kubernetes Service Monitoring Capabilities
Monitoring capabilities in IBM Cloud Kubernetes Service are handled via IBM Cloud Monitoring. You will find a link to the monitoring dashboard for IBM Cloud Kubernetes Service from your cluster overview page. This brings you to a Grafana dashboard with basic cluster monitoring information, as demonstrated in Figure 6-5.
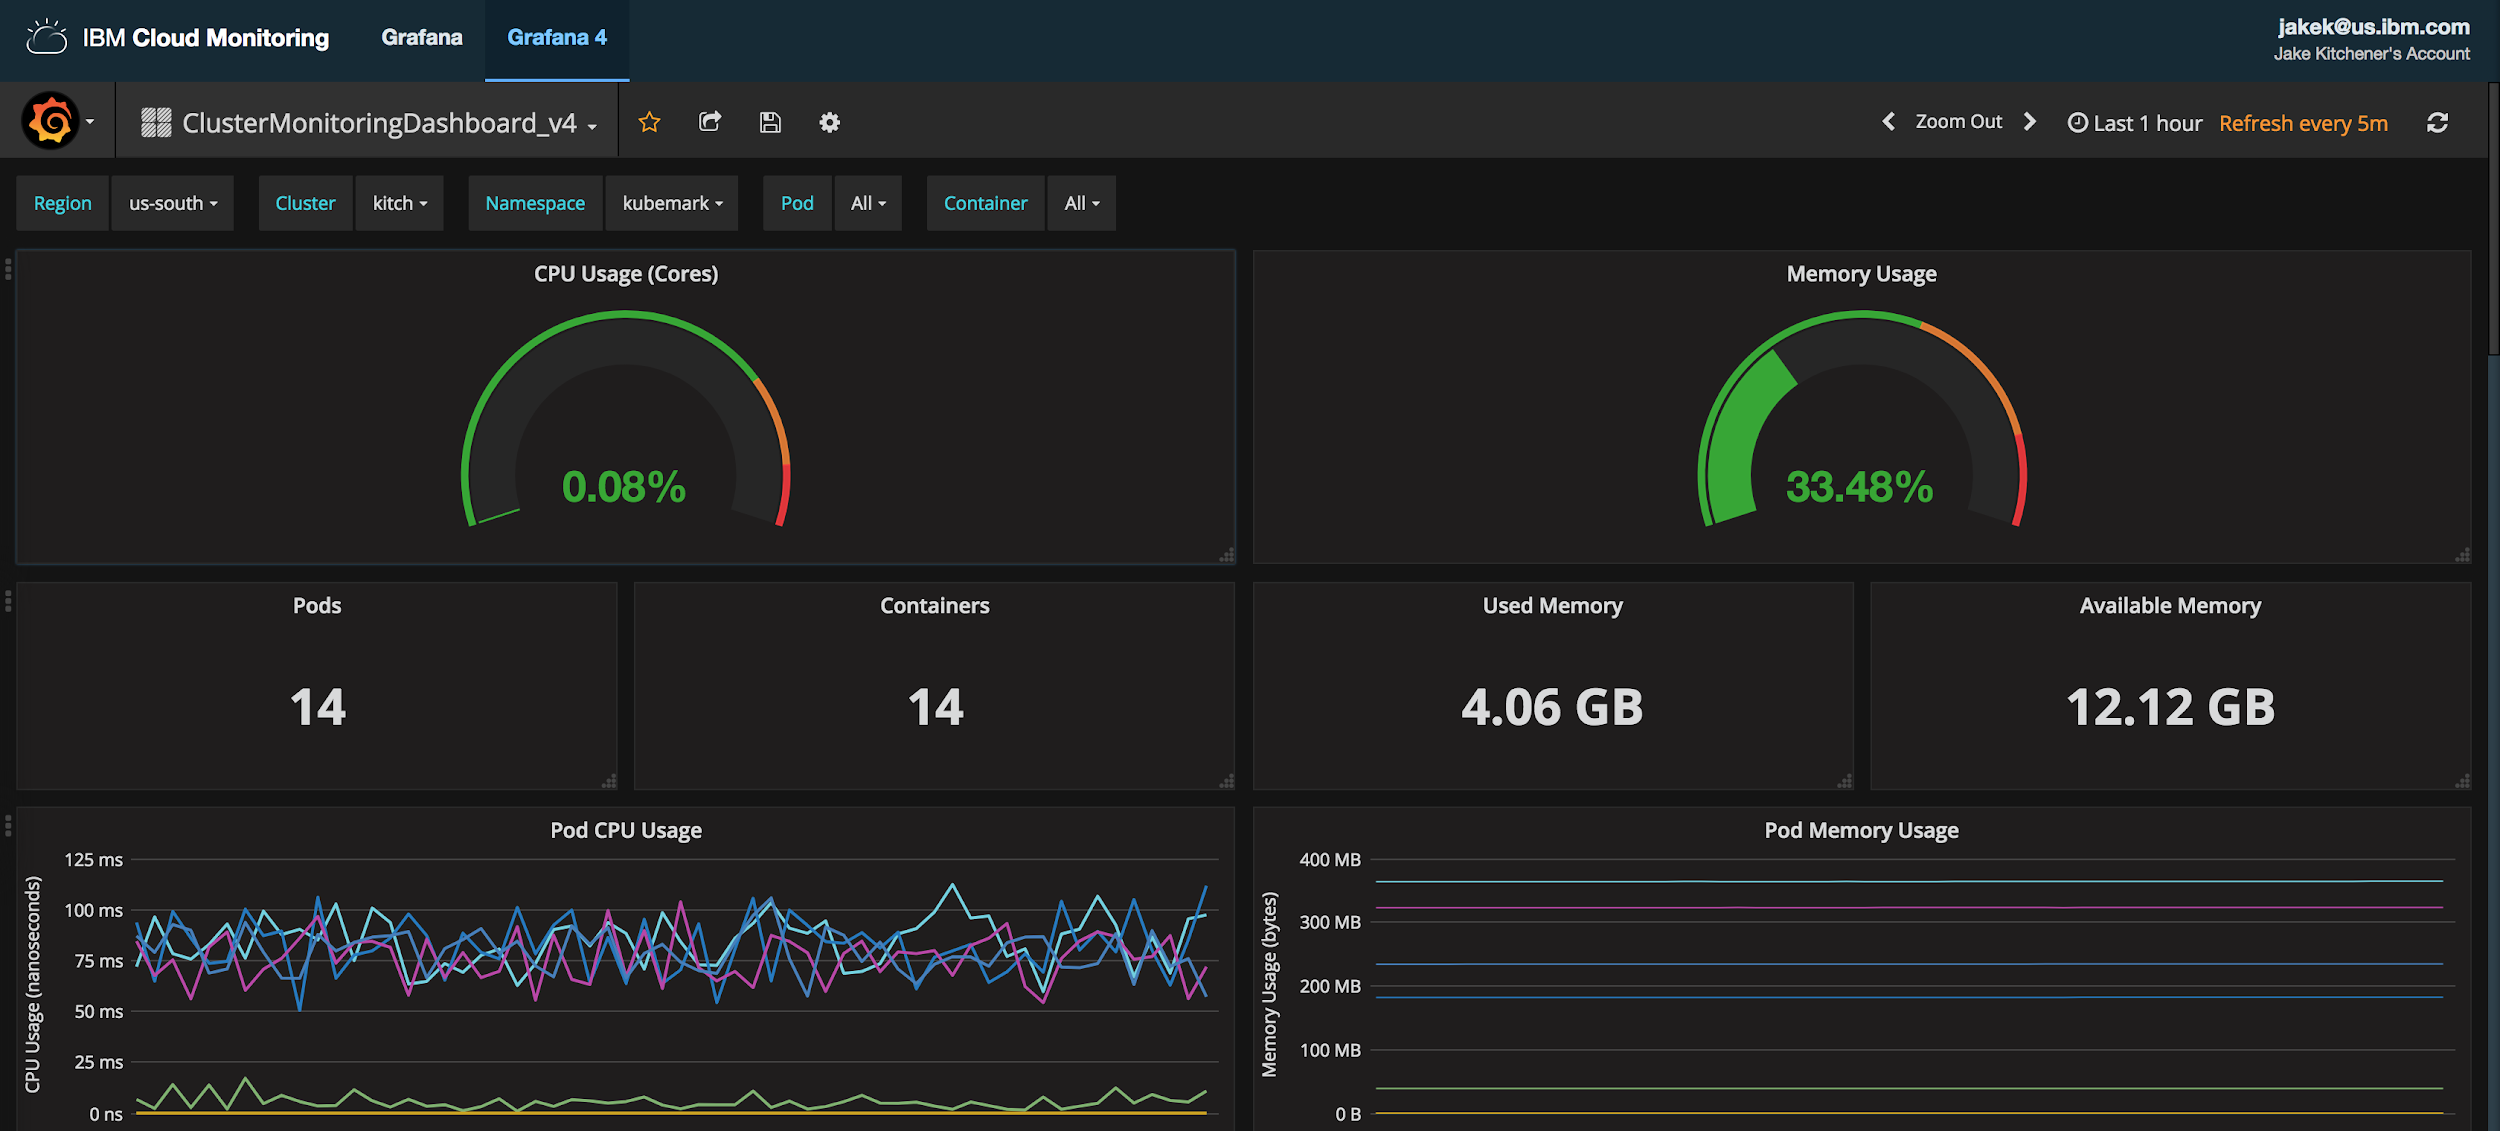
Figure 6-5. Data for IBM Cloud Monitoring is collected via a custom Fluentd plug-in (cAdvisor). No additional configuration or agent is required.
IBM Cloud Private Monitoring Capabilities
IBM Cloud Private includes a built-in Prometheus to collect metrics from the platform and workloads, and a built-in Grafana to visualize those metrics in easy-to-use dashboards.
From the web console, you can launch the Grafana to view, add, or modify dashboards to meet your needs. As shown in Figure 6-6, simply select the Monitoring option from the Platform menu to launch the monitoring dashboards.

Figure 6-6. Clicking the Monitoring option opens the monitoring dashboards.
Several dashboards are available out of the box. You can always browse community dashboards available for Prometheus and add your own. Figure 6-7 demonstrates available dashboards in IBM Cloud Private out of the box. You can create additional dashboards to fit your needs or import them from the community website and customize them as you need.

Figure 6-7. Available dashboards out of the box in IBM Cloud Private 2.1.0.3.
Let’s highlight two of these dashboards:
- Kubernetes cluster monitoring (via Prometheus)
Provides an overview of the entire cluster. As Figure 6-8 illustrates, you can see gauges for cluster memory, CPU, and filesystem usage, followed by information about the containers running across the cluster.
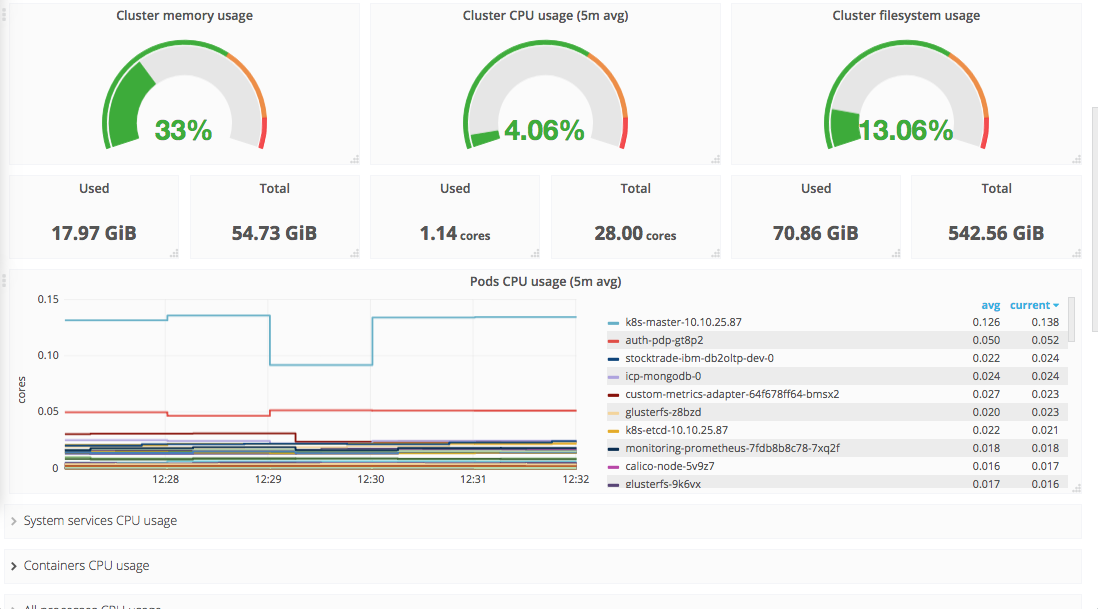
Figure 6-8. Kubernetes cluster monitoring dashboard.
- ICP 2.1 Namespaces Performance IBM Provided 2.5
This dashboard, shown in Figure 6-9, provides information for a specific Namespace. It displays information on container CPU, memory, readiness status, and other details. At the top of the dashboard, you can adjust the selected Namespace to view details about another Namespace.
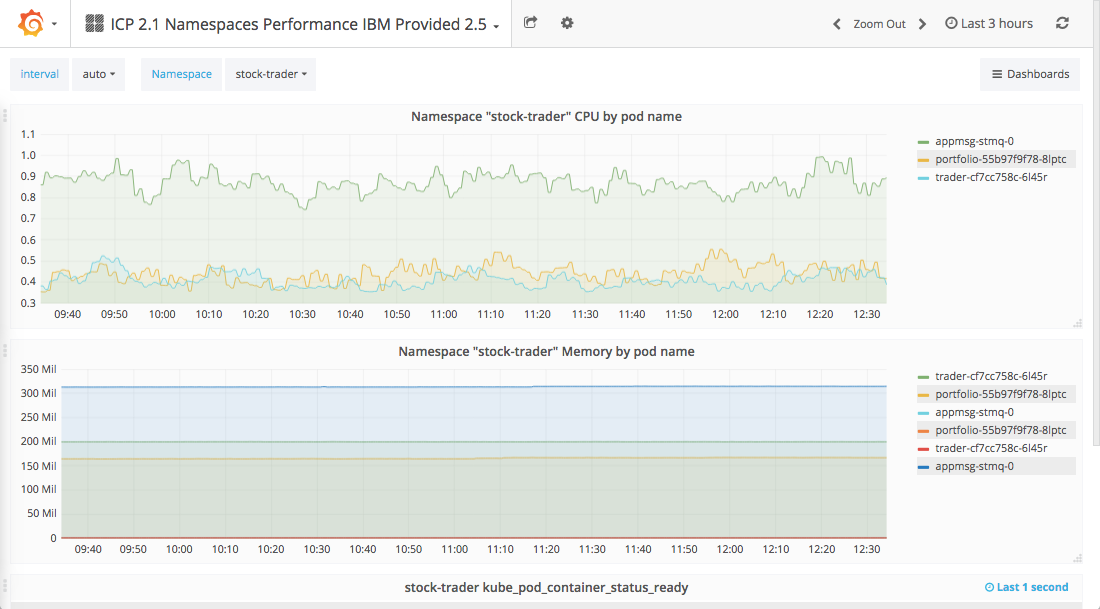
Figure 6-9. Namespace performance dashboard provided by IBM Cloud Private.
Summary
In this chapter, we presented several key tools that are critical to operating your enterprise application. We began with a discussion of popular tool options for the centralized log collection, analysis, and visualization of the data generated by your microservices running across a cluster. We also provided an overview of Prometheus, which is the de facto standard tool for performing monitoring and providing alert information for Kubernetes applications. Also included in this chapter was a discussion of how to utilize these operations-based tools from both IBM Cloud Kubernetes Service and IBM Cloud Private. In Chapter 7, we look at cluster operations issues and key considerations that need to be addressed when running in hybrid cloud environments.
1 Ranjit Mavinkurve, Justin Becker, and Ben Christensen, “Improving Netflix’s Operational Visibility with Real-Time Insight Tools”, Medium.com.