

Fine image quality depends a great deal on having a good lens, but you will find that even good lenses are only intended for a limited range of working conditions. Optics which excel under one set of circumstances can give quite poor results under another. This chapter explains some of the problems faced by lens designers and manufacturers, and shows how every product is a compromise between what today’s technology will allow and what we as photographers will actually buy. It also helps you to understand the lens quality data in manufacturers’ technical literature, and what to look for when buying a lens, new or secondhand. Special types of lenses are discussed too, in terms of practical handling and suitability for different kinds of photography. With the recent increase in popularity of digital still cameras (DSCs), consideration to the requirements of lenses for DSCs is given. The advantages and disadvantages of using existing lenses designed for 35 mm film cameras in digital single lens reflex cameras (SLRs) are examined.
The lens designer’s problems
We all tend to take a modern lens for granted. It is just accepted as an image-forming collection of glass elements, somewhat overpriced and easily damaged. In fact, every good lens is really a skilfully solved set of problems concerning the control of light. Designing a lens means juggling image quality, the picture area covered, consistency over a wide range of subject distances, an acceptably wide aperture – and finally coming up with something which is not too large, heavy or expensive to manufacture.
Glass
The designer’s raw material is optical glass, which starts as a molten mixture of chemicals, including barium, lanthanum and tantalum oxides. According to its chemical content, each type of glass has a particular (1) refractive index (RI) and (2) dispersive power (Abbe number).
RI relates to the light-bending power of a glass. Since the RI of an optical material varies with frequency and hence wavelength, it is normal to measure RI at a specific wavelength. This is done for several well-known emissions, for example, the wavelength of light near the middle of the spectrum (typically, 590nm yellow, see Figure 3.1). The higher the RI, the more steeply oblique light entering the glass is changed in direction.
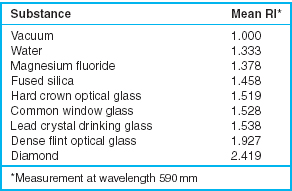
Figure 3.1 Some refractive index values.
The ‘dispersive power’ of the glass is related to the change in the RI of the optical material with respect to the wavelength of the light. The greater the difference between the RIs for red and blue lights, the greater is the dispersion in the glass (see Figure 3.2). Therefore, the higher the dispersion, the more white light is split into a wide spectrum of colours, just as a prism or droplets of rain disperse sunlight into a rainbow. Typically, the RI for all types of glass is greater for blue light than it is for red light. The average dispersion is calculated from a range of wavelengths that include red (656 nm) and blue (486 nm) lights. Dispersion is an important factor in glass for photographic lenses because your subject matter is often multicoloured, and is lit by a white-light mixed-wavelength source.
Mean RI and dispersive power are fairly independent. You can have two glasses which have the same RI but different dispersive power, and glasses which differ in RI but which have identical dispersive power. Figure 3.3 shows how this makes over 150 different kinds of optical glass available for the designer to choose. The Abbe number shown in the figure is defined as the reciprocal of dispersion. Glass used for lenses must also have the right physical properties to be machined and polished to the designer’s chosen shapes without breaking. It must be completely colourless, unlike ordinary window glass, which shows a green tinge when you look through it endon. Other requirements include general stability; freedom from defects such as bubbles, plus resistance to atmospheric conditions and reasonable handling during dayto-day use.
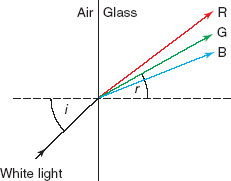
Figure 3.2 Refraction and dispersion. Mean refractive index with this glass is sin i divided by sin r. Dispersion (exaggerated here) is shown by the different RI for red and blue lights. Glass dispersive power is given an Abbe number: the greater the dispersion, the lower the number.
Recently, types of glass that show special dispersion properties or that have a very high RI have been applied in the design of DSCs. These types of glass are more effective at reducing artefacts such as chromatic aberration and can result in smaller, more compact, lenses that improve performance. One type of material with special dispersive properties is fluorite. When used in the manufacture of zoom lenses it can be very effective at correcting chromatic aberration owing to its unusual dispersive properties. However, it requires special care when it is handled since it has a very delicate surface.
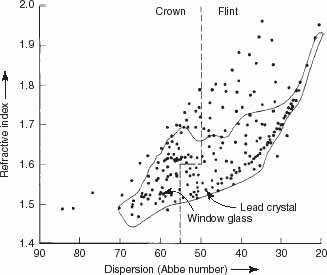
Figure 3.3 The 150 or so optical glass types produced for lenses by Schott, Germany. Glass for windows and lead crystal tableware are included for comparison. Enclosed zone defines the limits to manufacture 70 years ago.
Design and manufacture
A photographic lens is built up from a series of lens elements. The designer works by calculating the necessary front and back surface contours of each element, its appropriate glass and the spacing of one element relative to another in the lens barrel (allowing for the aperture diaphragm and perhaps the shutter). The aim in all this is to correct the mixture of optical errors – ‘aberrations’ – which always occur in images of a scene formed by simple lens elements alone. Broadly speaking, there are two reasons why aberrations in an optical system occur. Firstly, these errors occur due simply to imperfections in the individual optical components and are very difficult to avoid, even when the best components are used. Secondly, errors in fabrication and in the alignment of the individual optical components can result in further aberrations. Closely check the image of a scene formed by a single-element magnifying glass and you will see the slightly fuzzy, distorted, low-contrast picture which is the collective effect of aberrations.
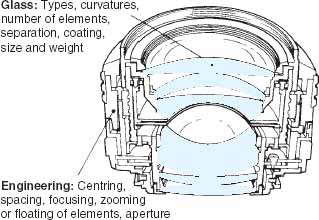
Figure 3.4 Internal structure of a regular f/1.4 50 mm lens for a 35 mm SLR camera. Lens design is a complex, mathematical combination of different lens elements, precisely located in the barrel along with aperture and focusing mechanism.
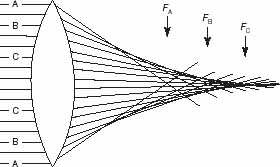
Figure 3.5 Spherical aberration. Rays refracted by outer zones of a spherically shaped lens come to focus (FA) nearer the lens than rays refracted through central zones.
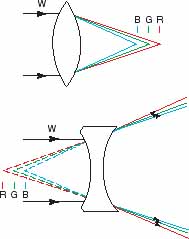
Figure 3.6 Longitudinal (axial) chromatic aberration. Dispersion of white light in simple converging (top) and diverging (bottom) lens elements causes different points of focus for each colour: red (R), green (G) and blue (B).
There exist seven main geometrical aberrations that can occur in an optical system and these are shown in Figures 3.5–3.11. Chromatic aberrations occur when light of more than one wavelength is being imaged. The remaining aberrations are monochromatic and occur when light of only one wavelength is imaged. It is not too difficult to reduce or eliminate each one individually by some means. For example, Figure 3.12 shows how the designer can correct longitudinal chromatic aberration by combining a converging shape lens made in high RI, medium-dispersion glass (the element is usually made from flint glass) with a diverging shape lens of glass having less RI (usually crown glass) but lower dispersion. The dispersion effects of converging and diverging elements then cancel each other out, although together they still converge light and so form an image. This type of lens is known as an achromat doublet lens. Achromatic lenses correct for chromatic aberration exactly in two separate wavelengths. Other wavelengths will have a small shift in focus position. The lens designer can choose the two wavelengths, usually, red and blue, to bring into the same focus plane. An apochromatic lens is a specially designed lens where three wavelengths are brought into focus. The advantage is that colour errors are much less than the colour errors in a similar achromat. A disadvantage with the apochromat is that the required glass is expensive and manufacture of the lens is difficult. Many apochromats have highly curved surfaces and suffer from a type of spherical aberration. Apochromats are used mainly for high-performance long focal length telephoto lenses.
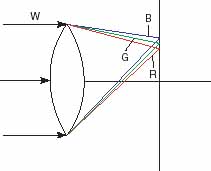
Figure 3.7 Lateral chromatic aberration. Colour fringing occurs due to change in image magnification which occurs as a function of wavelength. It tends to be more visible than longitudinal chromatic aberration and is zero at the centre of the field and increases at the edges.
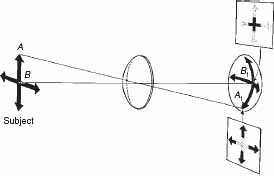
Figure 3.8 Curvature of field. A is farther from the lens centre than B. Therefore, sharp image A1 forms closer to the lens than B1. The focal plane is saucer shaped: centre and edges cannot both be focused on a flat surface at any one setting.
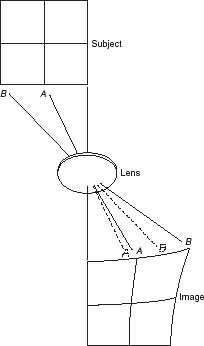
Figure 3.9 Curvilinear distortion. The rays most off-axis make too large an angle with the axis, ‘stretching’ the image of a square into a curved, pincushion shape. When refracted rays make too small an angle the opposite effect, barrel distortion, results (see Figure 3.24).
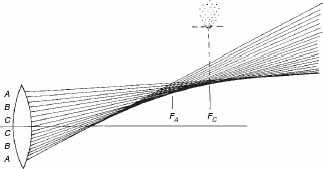
Figure 3.10 Coma. Each circular zone of the lens focuses oblique rays from an off-axis point at a different position relative to lens and lens axis. The patch of light formed (drawn as it appears at point of focus C) is pulled out like a comet. An oblique form of spherical aberration (Figure 3.5).
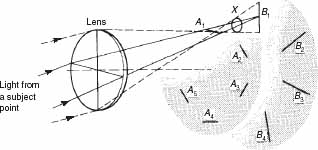
Figure 3.11 Astigmatism. Light from an off-axis subject point is imaged spread out as either a radial line (at focal plane B) or a tangential line (plane A). Best compromise image is at intermediate plane X. Other off-axis points image as lines A2 or B2, etc.
Some aberrations are, at least partially, corrected by similar ‘equal-but-opposite’ combinations, some by stopping down, others by the mathematical ratio of surface curvatures or an equal arrangement of elements in front of and behind the aperture. The handicap every designer faces is that the best way to correct one optical fault often worsens another. Matters can be helped by adding further lens elements (each offers a choice of two further surface curvatures and different glass), or you can fit a smaller aperture, or limit lens coverage to a narrower angle of view to cut out the worst aberrations which always tend to appear away from the centre of the image field. However, as elements are added light scatter builds up at every extra glass surface, and this gradually reduces image brilliance, despite the anti-reflective coating given to all modern optics. The lens also becomes heavy and expensive because of the cost of machining so many elements. Again, photographers want wider, not smaller, aperture lenses and optics which have generous covering power, especially for camera movements.
Using sophisticated computing equipment, the designer calculates the paths of hundreds of light rays from a test target to each part of the picture format the lens is being designed to cover. Compromises have to be made. Ideally, image quality should remain excellent whether the lens is focused for close or for distant subjects, or when it is used at any of its aperture settings. And the image should show no quality differences between the centre and corners of the picture format. At the same time, it is no good the designer pursuing ideal aberration correction if the resulting lens is uneconomic to make.
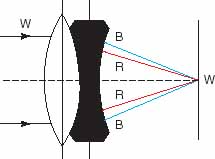
Figure 3.12 Correcting chromatic aberration by combining positive and negative elements of different glass types (see text).
Each advance in lens manufacturing also helps the designer. For example, you can have groups of ‘floating’ elements which mechanically alter their position in the lens barrel as the lens is focused for different distances. Elements can be given ‘aspheric’ instead of spheric surface contours (see Figure 3.13) or, in the case of small elements, be made in glass which has a graduated RI between centre and edges. These developments allow lenses with a better and more consistent performance, using fewer rather than more lens elements. So the trend is towards lighter and more compact lenses, as well as more extreme focal lengths and wider maximum apertures. This is of particular importance in the design of lenses for digital still cameras, where very high RI materials have meant that more compact cameras with smaller sensors can be manufactured.
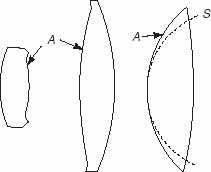
Figure 3.13 Various lens elements, each having one aspheric-shaped surface (A). S shows how one of these contours would be, if given a normal and more easily produced spherical surface.
Anti-reflection coatings are applied to the surfaces of multi-element camera lenses to reduce the level of light that is reflected from the surface of the glass where it meets the air. Multi-coated glass surfaces reduce the level of reflection from about 4% (for an uncoated polished glass surface) to less than 1%. Despite the use of multi-coating in lenses bright light sources such as the sun, light bulbs or specular reflections can give rise to flare, ghosting and a reduction in contrast in the captured image. Before anti-reflection coatings were invented, lens designers would try to design lenses with as few elements as possible to minimize the number of glass to air surfaces. Today, with modern anti-reflection coatings it is common to see lenses with 10 or more elements.
Checking lens image quality
Lens quality is difficult to pin down by something simple such as a number. Sharpness is subjective – clarity judged by human vision – and has to include image contrast as well as how much fine detail is actually present. Look carefully at Figure 3.14, for example. You can do simple practical tests yourself to get an idea of the quality of a lens. This is helpful if you are trying out a secondhand lens before buying. On the other hand, manufacturers do much more sophisticated tests and publish typical performance as figures or graphs for each of their lens range.

Figure 3.14 Image sharpness is subjective, depending on contrast as much as fine detail. Left-hand picture (A) was shot with a lens giving poor resolution but good image contrast. Right-hand picture (B) used a lens corrected to resolve finer detail but giving lower contrast. Viewed carefully from normal reading distance, (B) looks the sharper. But from two metres away (A) seems sharpest – your eyes no longer see the fine detail reproduced in (B) so this factor no longer matters. Courtesy Carl Zeiss.
D-l-Y lens tests
Irrespective of whether the lens is for small-, medium- or large-format photography, try to test it mounted in some larger-format camera which has a fine-etched focusing screen. A 35 mm or rollfilm format lens can be fitted onto a 4 × 5 in. view camera or a 4 × 5 in. camera lens on an 8 × 10 in. (203 × 254 mm) camera. Use bag bellows or a recessed lens panel if necessary to allow the lens close enough to focus. Have the lens axis dead centre and at true right angles to this enlarged focusing screen, which you trace out with the vertical and horizontal outlines of the format your lens must cover. Acceptable image quality outside this area will prove how much you could use the lens off-centre – by shift or swing movements, for example. Have a focusing magnifier to examine the appearance of the image on the screen.
Some image qualities are best checked if you use a large-area, detailed subject. Pin up several sheets of newspaper at right angles to the lens axis at, say 4 metres away (for a general-purpose lens) or any other distance you know you will often use. Have this improvised ‘test chart’ brightly and evenly lit. Then with the lens at widest aperture, focus for the centre of the format and examine image quality over parts of the screen further away from the axis. As you increase this distance the image may look less sharp, due to various off-axis aberrations and curved field. The latter is proved by refocusing – see if the outer zone grows sharper at the expense of the centre.
Slight curved field is a problem with some wide-aperture lenses, but is overcome when stopped down one to two stops. The position of sharp focus for the screen centre should be quite definite. If you have any uncertainty about this position, or see it change as you stop down, this suggests residual spherical aberration (Figure 3.5). You can also check for curvilinear distortion by having straight lines in the subject imaged well out in the image field and comparing these against a ruler laid flat across the screen.
Other faults are best seen using a rear-illuminated pinhole as a subject. Set this up at an appropriate distance and sharply focused centre frame, then slide it sideways, parallel to the screen until imaged well out in the field. A change in the shape of the spot of light and any colour fringing that appears could be the combined effects of astigmatism, coma and lateral colour. Some of this will disappear when you stop down.
Try altering the focusing when the spot is imaged well off the centre. If you see reduced aberration fringes on two parts of the spot’s circumference (in line with a line drawn outwards from the lens axis) at one focusing position, and on parts at right angles to these at another focusing position, astigmatism is probably present. A damaged lens may show no dents but still have one or more elements de-centred. (It only takes a few thousandths of a millimetre misalignment between the axis of some lens elements to produce noticeable loss of image quality.) To check this, image the pinhole centre-format. When you move either lens or screen forwards or backwards through the position for sharp focus the spot of light should widen to a truly symmetrical patch, not any other shape. Tests like this are interesting to do but really require more critical analysis than is possible by just looking at a camera-focusing screen, however fine-grained it may be.
Understanding modulation transfer function
Modern lens manufacturers put their products through far more extensive tests than you can do yourself and publish what they call ‘modulation transfer function’ (MTF) information. Do not be intimidated by this jargon, which comes from electronics rather than photography. Once you know how to read them, MTF data give plenty of practical information to judge lens quality against price. Unfortunately, graphs often appear in technical brochures without much explanation of terms, so it is worth looking at how they are drawn and what they mean.
MTF test procedure is somewhat like checking a hi-fi system, where you feed in signals covering a range of known sound frequencies, then compare each one against its purity of output. However, for lens testing the ‘subject’ is a patchwork chart of grids such as Figure 3.15, each grid having a number of equal-width black and white lines. One black and one white line is considered a pair, so you can quote the number of line pairs per millimetre (lp/mm) to describe the fineness or coarseness of the grid subject. High numbers of lp/mm mean fine detail, which scientists call high spatial frequency. Low lp/mm represent coarse detail or low spatial frequency.
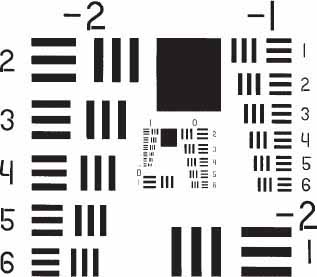
Figure 3.15 Typical test chart pattern for lens testing. The limit of good image sharpness is taken to be the point at which you can no longer tell whether bars are oriented horizontally or vertically (test it with your eyes at various distances).
The next bit of terminology is modulation, which basically means the change between light and dark values. A microscope/computer system scans across the lens’s image of chosen bars and the resulting signals are compared against direct readings off the chart. A perfect lens would image the grid with black lines perfectly black, and white lines white. In practice, because of remaining aberrations and diffraction, black lines become lighter and white lines darker, and original contrasty boundaries between the two appear more graduated when the light from the subject is transferred through the lens. Modulation is therefore always less than 100%, and could even drop to the point where bars are completely indistinguishable from spaces (zero modulation). Mathematically, modulation is defined as:
![]()
where Imax and Imin are the maximum and minimum intensities, respectively, in a test target or a pattern with a sinusoidal variation in intensity, I.
What MTF graphs mean
The usual kind of lens MTF graph (Figure 3.16) shows modulation 0–100% on the left-hand axis. On the baseline it maps out distance across the image patch, from the lens axis (left-hand end) out to some appropriate radius point to the right. For a lens designed to cover 35 mm format without movements this might be 22 mm. For a 60 × 60 mm format lens the equivalent would be 40 mm, and for 4 × 5 in. (102 × 127 mm) format about 80 mm. However, if your camera offers movements which shift or tilt the lens axis away from the centre of the film, it is important to have information ‘further out’ than a circle only just covering the format. For example, Figure 3.16, for a 4 × 5 in. view camera lens, shows performance out to a radius of 177 mm, with a marker showing the acceptable limit of off-axis use as about 155 mm.
Lens performance is plotted for a particular frequency of patterns perhaps 20 lp/mm. As you move further from the lens axis towards corners of the picture, performance (percentage modulation) drops. The better the lens, the less this drop-off will be. You also find that the plot line splits into two. One is marked S for sagittal, meaning response when the grid has its lines parallel to a radial line drawn outwards from the axis. The other, T for tangential, is for when the grid pattern is turned 90°. Any remaining aberrations such as astigmatism (Figure 3.17) cause differences in the two results. Again, the less they differ, the better the lens.
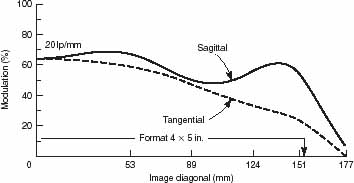
Figure 3.16 Basic elements of an MTF graph for a camera lens designed to cover a 4 5 in. negative, allowing ample movements. The higher and straighter the plots, the more consistent the image quality (note that image diagonal distances from the centre are in log values, which expand central area data relative to edges).
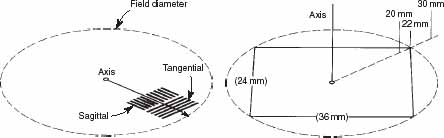
Figure 3.17 Left: MTF graphs separately plot patterns running parallel to a radial line running from the lens axis, and others at right angles to these. Right: performance over an image field at least 22 mm radius must be shown for a lens intended to cover 35 mm format.
Plots for 35 mm format lenses are usually shown for 40 lp/mm. This figure is related to the resolution assumed necessary for the final image you view. For example, a 24 × 36 mm format picture shot with a 50 mm lens, then enlarged onto 8 × 10 in. paper 25 cm wide (magnification 7 × ) and seen from 30 cm typical normal viewing distance, looks natural in subject scale and perspective (see Langford’s Basic Photography). However, at this reading distance the human eye can resolve, at best, about 5–6 lp/mm. Try it yourself looking at a ruler. (It is a stark reminder that limited eye ability forms the whole basis of depth of field.) So referring back to 35 mm format, eye resolution 7 × gives about 40 lp/mm necessary in the camera for the final image to look sharp.
On larger formats this is different again – an 8 × 10 in. print from a 4 × 5 in. negative is enlarged 2 ×. About 20 lp/mm on the film will give a result which looks sharp to the eye. So MTF graphs for large format lenses seldom show plots for spatial frequency finer than about 20 lp/mm. Clearly, these taking and viewing assumptions can be upset if you are to enlarge from only a part of the negative or make giant enlargements to be seen in close-up. The brightness of the illumination the final print receives when displayed also greatly influences eye resolution.
The performance of lenses designed for digital SLR (DSLR) cameras can be different from the performance needed for the 35 mm format and is governed by the size of the camera sensor. For example, the sensor used in the Nikon D70s digital camera is 23.7 mm × 15.6 mm. To make an 8 × 10 in. print from this sensor would require that the recorded image be magnified by approximately 11 times. For the final image to look sharp, the camera must be able to resolve about 56 lp/mm on the sensor. MTF graphs for lenses designed for digital cameras often show plots for spatial frequencies up to 60 lp/mm.
Most MTF graphs plot extra lines showing performance at 30 or 20 lp/mm, or even (large-format lenses) 10 and 5 lp/mm. Do not ignore them. With a good lens it is important that broad detail also maintains contrast across the image. Some of the finer detail is lost by the graininess of the light-sensitive material you expose it on (page 90) or the dot pattern of a halftone screen (page 330).In these instances it is the lower frequencies that communicate most of your image. When comparing MTF graphs for different lens brands remember too that manufacturers tend to present performance in the most favourable way. Compare carefully the scaling of graphs, such as spacings between figures on the modulation axis relative to those on the image field axis. Some manufacturers label the latter as ‘image height’.
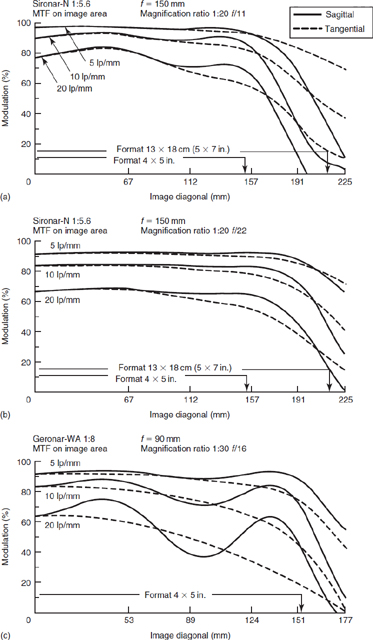
Figure 3.18 MTF graphs for two large-format camera lenses. The Sironar-N is a high-quality six-element lens. Graphs show changes when lens is at f/11 (top) and f/22 (middle graph). Image quality across the film becomes more consistent as stopping down reduces aberrations. However, the general level deteriorates slightly due to diffraction from the smaller aperture. The Geronar lens (bottom graph) is a budget-priced four-element wide angle (courtesy Rodenstock).
Checking the small print
Alongside the graph should be the f-number used during testing. Often this is f/5.6 or f/22 for 35 mm and large-format lenses, respectively. If an MTF curve is shown for the widest aperture it will show poorer performance because of more pronounced aberrations; at smallest aperture it will again deteriorate mostly due to diffraction. In the case of a large-format camera lens, comparing graphs at different apertures tells you how the limits of coverage change. For example, stopped down appropriately, a normal lens for 4 × 5 in. format might well cover 5 × 7 in. or even 8 × 10 in. (both as a wide-angle lens), provided you do not use movements. Alternatively, the same graphs show how far movements on a 4 × 5 in. camera can bring the lens off-centre on the film before image quality suffers on one side of your picture. Establishing the f-number used during testing for digital camera lenses is especially important particularly if the magnification factor required for enlarging the image recorded on the sensor is high. Image degradations resulting from aberrations or diffraction will be more noticeable in the final enlargement if the magnification factor is very high.
Graphs should also state the distance of the subject test chart, usually as a ratio (typically, 20:1 for a 4 × 5 in. format lens, but for a macro lens 1:1 and for a 35 mm format enlarging lens 1:10). You should expect to see a macro lens giving best performance at around 1:1, whereas a general-purpose lens image would deteriorate when used so close. Enlarging lenses need characteristics similar to macro lenses (see page 61). However, do not expect any lens to give 100% modulation, even with a coarse frequency subject like 10 lp/mm, imaged on-axis and at optimum f-number. This is because the aperture always creates some diffraction, varying with different lens designs. Often plots for 40 lp/mm start on-axis at less than 50% modulation and then get worse.
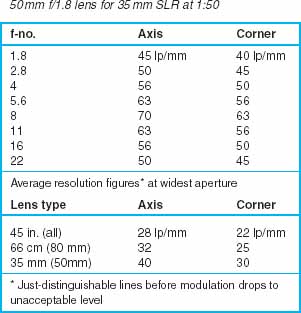
Figure 3.19 Lines per mm resolution performance of typical camera lenses. The top table shows how image quality peaks at f-numbers about the middle of the range.
Other MTF graphs
Another type of MTF graph (Figure 3.20) allows you to compare two lenses in a different way, plotting percentage modulation against a wide range of lp/mm. It does not tell you anything about image quality across the image field, but makes it easy to see how response worsens as detail becomes finer. As with previous MTF graphs, the greater the area shown under the plot line, the better the lens. One lens plotted in Figure 3.20 has its aberration corrections biased in such a way that the most contrasty, best-quality image occurs with broad detail, then it rapidly deteriorates with finer detail. A lens designed with these priorities is ideal for a video camera, where the limitations of the television medium (traditionally, 625 or 525 lines) are so crude that anything finer would be lost in the system. The other lens is designed for regular photography. Priority here has been given to corrections which give generally lower but more consistent percentage modulation down to much finer patterns, because silver halide systems are more able to record such detail. Still higher performance needs to be met in lenses intended for use with high-end charge-coupled device (CCD) digital camera backs. The graph proves again how lenses can be closely designed for a set function.
MTF graphs scaled in the same way are also published for different kinds of photographic films. As explained in Chapter 5, the resolving power limits of films range between about 200 and 25 lp/mm according to speed, grain, level of exposure and type of development. So you can combine the performance of your camera lens and your film to get one graph plot representing the complete imaging system from subject to processed result. This is about the closest anyone can get to representing photographic image quality through diagrams or figures (see page 94).
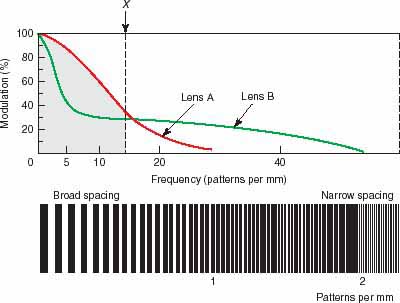
Figure 3.20 Modulation transfer function plotted (axial image) from two lenses, for different fineness of detail. Lens A is most suitable for a video camera – X denotes the cut-off frequency of 625-line television systems (see text). Lens B is more suitable for silver halide film photography, where acceptable modulation is needed down to about 40–50 lp/mm. Bottom: type of test chart used. For photographs of a subject taken with these lenses see Figure 3.14.
Resolution and frequency response
The resolution of a camera is related to its ability to distinguish fine details in a scene. The higher the resolution of the camera, the finer the level of detail that can be recorded. Several factors contribute to determining the resolution. These include lens quality, aperture setting on the lens, the type of film or, in the case of a digital still camera, the number and size of pixels in the sensor and any associated electronics in the camera. A test chart is prepared that contains a pattern comprising an alternating series of black and white lines (or bars) that decrease in width (increase in frequency) to some predetermined limit. The chart is photographed and the result can be either viewed on photographic film, a print can be made or it can be viewed on an electronic display, such as a monitor. The point on the pattern where the black and white lines can no longer be distinguished is that defined as visual resolution. The resolution in this case corresponds to the highest frequency pattern that the system can capture. Resolution is usually measured in both the vertical and horizontal directions. One metric used to report resolution is line pairs/mm. This corresponds to the number of black and white pairs per millimetre that can be visually resolved. The International Organization for Standardization (ISO) define a test chart as part of standard ISO 12233 that is designed for the purpose of testing digital still cameras (see Figure 3.21).
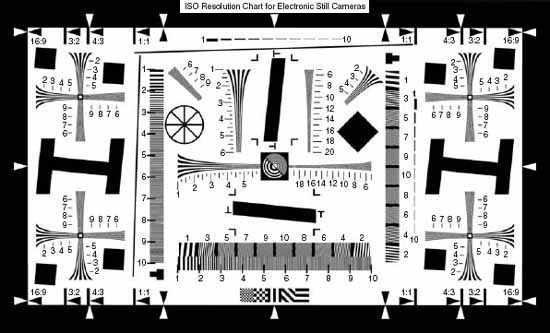
Figure 3.21 The ISO 12233 resolution test chart shown here can be used to measure the resolution and spatial frequency response (SFR) of a digital camera. ‘The terms and definitions taken from ISO 12233:2000 Photography – Electronic still-picture cameras – Resolution measurements, Figure 1, are reproduced with permission of the International Organization for Standardization, ISO. This standard can be obtained from any ISO member and from the Website of ISO Central Secretariat at the following address: www.iso.org. Copyright remains with ISO.’
The chart includes hyperbolic test wedges that are optimized for the measurement of visual resolution. The units reported on the chart are in line widths per picture height (LW/PH). The hyperbolic wedges shown in Figure 3.21 are alternating black and white curved-line patterns that converge gradually (increase in frequency) thereby giving the appearance of a wedge. They can show moiré patterns and are especially suited for measuring visual resolution.
There is a close relationship between resolution and frequency response of an imaging system. Unlike resolution, frequency describes the way that an imaging system responds to a wide range of input frequencies. Note that frequency response and MTF are almost the same. The ISO 12233 test chart contains targets that can be used to measure the spatial frequency response (SFR) which is essentially the frequency response of the system. Consider two camera systems that have the same visual resolution but different frequency responses. One system exhibits a higher frequency response for mid-range frequencies than the other. Although the two systems have the same visual resolution, the images captured by the first system will appear sharper than those captured by the second. The higher level of contrast in the former results in images that are perceptibly sharper than the latter. An example of an image shot with a lens of poor resolution but good image contrast (which corresponds to a good MTF) compared to an image shot with a lens corrected to resolve a finer level of detail but lower contrast is shown in Figure 3.14.
Buying lenses
Each manufacturer sets its own minimum quality image acceptance standards, but every lens – even though one of the hundreds of the same design – is also an individual product. Glasses, shaping, spacing and centering can differ in minute ways as lenses come off the production line. So, although quality control should ensure that no lens giving less than a minimum standard gets through, some lenses may in fact be considerably better. You will also find two manufacturers offering lenses of similar specification at quite different prices. One significant reason may be that the cheaper manufacturer sets slightly lower standards and operates less-strict quality control. The result is more of a ‘lucky dip’ from which you may (or may not) draw a good lens.
Understanding some of the lens designer’s problems shows you the importance of using a lens only within its intended performance range. A telephoto lens fitted with an extension tube may focus close enough for 1:1 copying, but your results will probably be of poor quality. (This is not the same as a lens, such as a zoom, designed to offer ‘macro mode’ which shifts internal floating elements to correct for working at one close distance.) Again, some true macro lenses give indifferent results when focused for distant landscapes.
Most lenses give their best image quality stopped down to about the middle of their f-number range. The wider you open up, the less certain aberrations are corrected; but too much stopping down begins to lose quality because of diffraction (Figure 3.19). So the upper and lower ends of the f-number scale are limited by lens design and what the manufacturers regard as the limits of acceptable image quality. Sometimes two lenses of the same brand and with identical focal lengths are radically different in structure and price, because one opens up an additional stop or covers a larger area (allowing camera movements) without worsening quality.
Lenses for specialized purposes have their aberration corrections biased in a particular direction. For example, a lens for an aerial survey camera must give optimum quality for distant subjects and avoid any distortion of shape because results are used for measurement purposes. A lens for enlarging or copying has its corrections balanced to give best quality when subjects are close. A shift lens, or any lens for a camera offering shift movements, needs generous covering power (and to achieve this will probably not have a very wide maximum aperture). A lens for 35 mm press photography or surveillance work may only just cover its format, because all the design emphasis is directed towards widest possible aperture.
New lenses designed for digital backs outputting large files (page 37) give higher resolution than is needed for silver halide film. (Circles of confusion should not exceed in diameter the ‘pitch’ or distance between each of the millions of elements in a CCD matrix). And a lens designed for the curtailed resolution requirements of video cannot be expected to perform well while taking silver halide photographs.
When choosing a lens decide too the handiest size and weight for your expected shooting conditions. This is especially important with long focal length lenses to be used on difficult locations. Do not go for maximum apertures wider than you will ever need – it only increases bulk and cost. Lens condition is especially important if you are buying secondhand. Elements with scratches (perhaps from excessive cleaning?) will more seriously affect image quality than a speck of black or even a bubble in the glass. A lens which has been dropped may show no obvious external sign of damage yet have internal elements miscentred, giving general deterioration of image quality. So if you are buying an expensive secondhand lens always try it out first under your own typical working conditions or invest in a professional test (available from most major camera repairers).
Special lens types
Zoom lenses
New optical glasses with novel combinations of RI and dispersive properties, plus better lens design, mean that the best modern zoom lenses give really good image quality. To understand how a zoom lens works, remember that the focal length of a complete lens depends on the focal lengths of its component elements and the distances by which they are separated (affecting their ‘throw’). In a zoom lens, groups of elements move within the lens barrel when you alter the focal length control. This zooming action therefore ‘restructures’ the lens – for example, from inverted telephoto through to telephoto (shown schematically in Figure 3.23).
Zooming should alter focal length and therefore image magnification, without disturbing focus. At the same time, the designer has to ensure that aberration corrections also adjust to keep pace with your focal length changes as well as your focusing. It is particularly difficult to hold corrections for curvilinear distortion (Figure 3.9). The tendency in a poor-quality zoom is for square-shaped subjects to be imaged pincushion-shaped at one end of the zoom range and barrel-shaped at the other (see Figure 3.24).
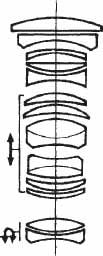
Figure 3.22 A zoom lens design showing groups of ‘floating elements’ which are repositioned during zooming to alter focal length and maintain best correction of aberrations.
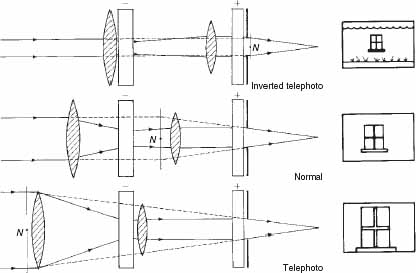
Figure 3.23 One basic form of zoom lens construction in which two sets of components are movable. Top: movement backwards to give inverted telephoto setting. Bottom: movement forwards for the telephoto setting. Rear nodal point (N) becomes progressively further from the focal plane, giving longer focal length and larger image detail. Converging components ( ) and diverging ( ) components remain static (see also Figure 3.33).
Ideally, a zoom should also maintain the f-number you set throughout its zooming range. In practice, to reduce cost and size, many zooms slightly alter how much light they pass at widest aperture (see Figure 3.32). The widest setting when used at longest focal length becomes up to one stop wider when you change to shortest focal length setting. Automatic through-the-lens (TTL) camera exposure metering takes care of any changes as you zoom. However, if you use manual through-the-lens metering, a non-dedicated flashgun or a separate exposure meter, be prepared to re-adjust for the new widest aperture at different zoom settings.
Because of their complexity, and a very competitive market, zoom lenses vary more in image quality than any other lens type. Some zooms fully match the standards of fixed focal length lenses. Others are much worse. It is true to say that the greater the zoom range (ratio of shortest to longest focal length), the less likely image quality generally will match that of a fixed focal length lens. A zoom with a 5 × or 6 × range, for example, is unlikely to be as good as one of 3 or 4. Similar reservations apply to the quality of zooms when set to macro mode. Unlike a good fixed macro lens, sharpness often deteriorates towards the corners of the picture. The answer is to tread warily, read the technical specifications and, when possible, make practical tests to check whether a particular zoom gives you good enough results.
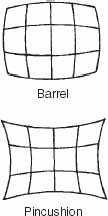
Figure 3.24 Barrel and pincushion image distortion, shown here in exaggerated form.
Zoom lenses designed for compact 35 mm film cameras generally cannot be transferred directly for use in digital still cameras. The imaging sensor in a DSC is fitted with an array of microlenses, one for each pixel, in order to ensure that the light reaching a pixel is sufficiently bright. When the focal length of a zoom lens changes, the angle with which light exits from the imaging side of the lens is altered. If light enters the microlens at an oblique angle, then problems such as vignetting can occur resulting in dark edges or poor colour reproduction in the final image. Film, on the other hand, can tolerate light falling on it over a wide range of angles without any significant loss in brightness. Zoom lenses for DSCs need to be designed so that there is little difference in the angle of light exiting the lens between its wide-angle setting and telephoto setting. The angle of light is almost always very nearly parallel to the optical axis of the lens in this case. This type of lens is known as a telecentric lens. With digital SLRs the distance between the imaging sensor and lens is generally greater to accommodate the hinged mirror and the hence the light rays are by design almost telecentric. Generally, you can use a zoom lens designed for a 35 mm film system with digital SLR without significant problems, but bear in mind that you may experience some loss in brightness colour distortion or fringing, especially at wide angle settings.
Mirror lens designs
A photographic lens can be combination of glass elements and curved mirrors. Figure 3.25 shows a typical mirror lens layout; it has a characteristic squat drum shape and an opaque circular patch in the centre of the front lens (the back of the inward-facing second mirror). The advantage of mirrors is that a long focal length lens becomes physically much shorter – its optics are ‘folded up’. Mirrors do not suffer from chromatic aberration because they reflect instead of refract light. So the designer needs fewer correcting elements and this, plus the lightweight mirrors, makes the complete lens far less heavy than the same focal length in conventional optics.
However, a mirror lens has three disadvantages:
1. It cannot be stopped down – having a diaphragm would vignette corners of the picture. So you cannot alter depth of field, and exposure has to be controlled by fitting grey neutral density filters or by relying on the shutter alone. Mirror lenses do not therefore suit auto-exposure cameras using shutter priority or programme modes – only aperture priority or manual modes will work.
2. Any bright out-of-focus highlights spread into doughnut-ring shapes instead of the usual discs of light we accept as similar to eyesight. The dark central shape is due to the front mirror.
3. Aberrations increase to unacceptable levels away from the lens axis, so mirror designs are limited to narrow angle, long focal lengths. Typically, they come as 500 mm, or 1000 mm lenses for 35 mm format, with a fixed aperture of about f/8 or f/11.
Relatively few mirror lenses are available (they are described as ‘catadioptric’ or ‘reflex’ types in some brochures). Nevertheless, their lightweight and handy shape make them convenient to use, especially for natural history or sports photography on location.
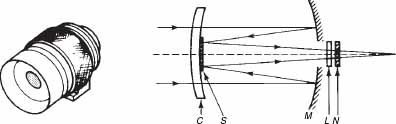
Figure 3.25 Typical 500 mm mirror lens and internal structure. C: corrector plate. M: primary converging mirror. S: secondary mirror. L: weak secondary correctors for aberration control. N: neutral density filter (changeable) for exposure control.
Fisheye lens designs
Fisheyes are special wide-angle lenses in which correction of curvilinear (barrel) distortion is sacrificed in order to give extreme angle of view. Angles of 180° or 220° are quite common, but to achieve this, image magnification varies greatly across the picture, producing strange fishbowl results (see Figure 3.26). In all other respects a good fisheye gives excellent image quality.
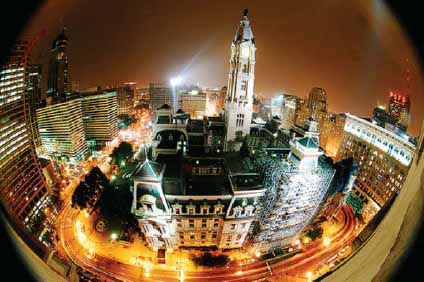
Figure 3.26 Extreme fisheye lenses produce circular pictures but, together with the distortion of shapes they give, this can suit some subjects.
The lens has wide-diameter, bulbous front elements, which diverge light – similar in principle to a normal type lens looking through a concave window. You cannot add a lens hood or external filters because they cut into the angle of view, so light-shading tabs and ‘dial-in’ filters are built into the barrel itself.
Depth of field is phenomenal, typically stretching from 30 cm to infinity at f/8. Maximum aperture is often about f/5.6. A few wider aperture (f/2.8) fisheye lenses have also been marketed, using front elements 20 cm or more in diameter, which makes them extremely heavy and expensive. Another unusual variation is the fisheye zoom, such as the Pentax 17–28 mm. Most fisheyes are designed for 35 mm format cameras, and one or two for rollfilm types. You can also fit a ‘fisheye converter’ over the front of a regular lens. The best of these give excellent quality results, provided your camera lens is stopped down.

Figure 3.27 Wide-angles, unlike fisheyes, are formally corrected for distortion. But extreme wide angles still ‘pull’ shapes farthest from the picture centre. This is especially obvious with shots of human figures, least with plain areas such as floor or sky (by Ilkay Mehmet).
Development of modern extreme wide-angle lenses such as the 47 mm Super Angulon (covering formats up to 4 5 in.) put fisheyes into second place for record photography of confined interiors, etc. Fisheyes should always be used sparingly, perhaps to make spectacular industrial, advertising or editorial shots. They give novel geometry but you soon find that this dominates each and every subject you shoot, giving repetitive results. Some fisheyes are intended for special purposes such as surveillance work, photographs inside architectural models or all-sky photography for meteorology.
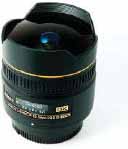
Figure 3.28 A 10.5 mm f/2.8 fisheye lens.
Soft-focus lens designs
When you focus a soft-focus lens, it images any point of light from the subject as a sharp core overlaid with a ‘halo’ of spread illumination. The resulting softness of outline works well for atmospheric landscapes, portraits (weddings, children, etc.), especially in colour. The effect is most noticeable with contrasty subject lighting. Large tonal areas appear less softened than fine detail. In portraits, for example, skin blemish detail is suppressed and yet facial features in general remain much clearer than an image that is out of focus (see also Figure 3.29).
Soft-focus lenses differ in detail, but all tend to be highly corrected for optical errors with the exception of spherical aberration. As Figure 3.5 showed, retaining this error gives the mixture of sharp and unsharp characteristics of a soft-focus image.
You must be able to control the degree of ‘softness’, to suit your subject. With some lenses this is crudely achieved by stopping down – the aperture ring shows symbols for softest focus at widest setting, down to sharpest focus fully stopped down. Better designs have floating elements which shift to increase or decrease spherical aberration when you turn an extra control ring. You can then control softness independently of depth of field.
A few soft-focus lenses, undercorrected for spherical aberration, accept interchangeable multi-perforated aperture discs (Figure 3.30).Each disc increases dispersion and also makes image points consisting of a hard core (central aperture) surrounded by overlapping smaller patches of light which form a halo effect. For different effects you change discs. One disadvantage of this system is that, like a mirror lens, every bright unsharp subject highlight takes on the frontal appearance of the lens – a central patch surrounded by smaller patches. Each disc is marked with an ‘equivalent f-number’ for exposure purposes.
It is advisable to focus a soft-focus lens at the actual aperture to be used for shooting. If possible, use a plain matt focusing screen so you can then judge precise effects. Split-screen SLR manual focus aids and autofocus may not function. Where possible, measure exposure through the lens using the camera in manual or aperture priority mode.
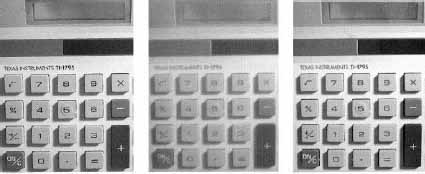
Figure 3.29 Left to right: normal lens in focus; soft focus lens; normal lens out of focus. Soft focus gives a combination of sharp and unsharp detail, and lowered contrast (see also Figure 5.7).
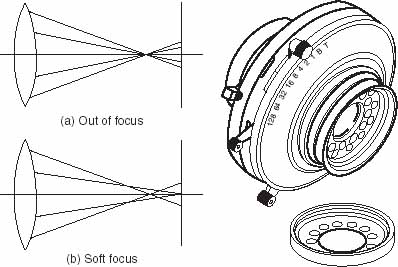
Figure 3.30 Left: (a) regular lens, image out of focus; (b) soft-focus lens image – each point on the subject records as a nebulous halo with a hard core. Right: soft-focus lens for a large-format camera, using interchangeable perforated discs to give different amounts of dispersion and light patches.
You can produce superficially similar soft-focus results using a diffusing attachment over a regular lens. (A finely etched ‘anti-Newton’s rings’ transparency cover glass is the cheapest.) However, close comparison of results from an attachment against a good soft-focus lens will soon convince you of the subtleties of the latter. As an alternative technique, you can shoot on reversal film with a normal lens and enlarge this onto reversal printing material (such as Ilfochrome) using a soft-focus lens or attachment on the enlarger. Do not try this when printing from negatives, because the lens will then spread shadows rather than highlights, giving a very different atmospheric effect. It is also possible to imitate the effect of a soft-focus filter or lens in a digital image using an image-editing software package such as Adobe Photoshop or Corel Paintshop Pro. This can be done either by using a combination of digital blurring filters and masks or by using a dedicated soft-focus filter or ‘plug-in’ application. These can be run from within the image editing application.
Macro lenses
The aberration corrections in a macro lens are balanced to give optimum image quality when the subject is relatively close. Focal length is usually normal or slightly long for the format it covers, for example, 50 mm or 100 mm for 35 mm cameras. The lens is designed to have a relatively modest maximum aperture such as f/3.5 or f/4, but often stops down as far as f/32. A working range of f/5.6–f/64 is common with macros for larger formats. Macro lenses are corrected for these smaller apertures, which are helpful to improve the shallow depth of field when working close and/or using a large-format outfit.
Most macros for 35 mm and rollfilm cameras have extended focusing barrels so that you can continuously focus out from infinity setting to image close subjects 0.5 (half-size). As Figure 3.31 shows, the focusing ring has an extra scale of ‘macro’ numbers, typically from 10 down to 2. These are handy for precise record photography – by noting the number you are using for a particular shot the subject size and magnification can be accurately calculated later for captioning your picture. You can also use the scale to set a predetermined ratio, then move the camera nearer or farther until the image is sharp.
Of course, any macro lens will focus still closer subjects if you add on extension tubes or bellows between lens and camera body. However, at magnifications greater than about 2.0 × you may find image quality gradually deteriorating, because you are outside the design limits of aberration corrections. For finest quality you can then change to a more expensive ‘true’ macro (or ‘macro bellows’) lens, each one corrected for optimum results at a particular magnification (for example, 5 ×, 10 × , etc.). Such lenses come without a focusing mount, because they are intended for use with adjustable bellows. Scientific photographers often work with sets of these true macros, changing them in the same way as microscope objectives.
Always remember that TTL metering is the most accurate way of measuring exposure when shooting in close-up, using extended lens-to-film distances. Image brightness dims considerably, and is not automatically taken into account if you are using a separate meter or a non-dedicated flashgun. It is easy to overlook this when working with studio flash and a separate flash meter (see page 163).
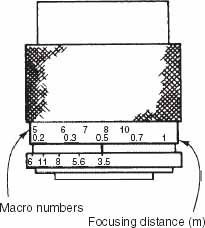
Figure 3.31 Macro lens, showing extra macro numbers on focusing scale relating to magnification. To find your subject magnification on film, divide the macro number into 1 (e.g. 10 means magnification of 0.1 × ).
Close-up lenses
Close-up attachment lenses are an inexpensive alternative to macro lenses for macro photography. They are worth considering if you are trying out macro photography for the first time. A close-up lens is a single element lens that you add to the front of your camera lens as a filter attachment. The attachment enables a camera with limited focusing capability to focus on objects that are closer in distance that would be possible without the attachment lens. Close-up lenses are specified according to their power in dioptres instead of focal length. Lenses in the range 0.5–3.0 dioptres are normally used with standard focal length or telephoto lenses. Should a higher level of magnification be required, close-up lens attachments can be stacked one on top of the other. There is normally a compromise in the quality of a macro image obtained when a close-up attachment is used compared with when a true macro lens is used.
Converter lens attachments
You can buy attachments containing multi-lens elements to add to your main lens and convert its focal length. The most common types are teleconverters, containing predominantly diverging lens elements and designed to fit behind one or more specified, moderately long focal length lenses – usually by the same manufacturer. Typically, a 2 × teleconverter doubles the prime lens’s focal length, recorrecting aberrations so that the same image performance is maintained. Such a convertor reduces the effective aperture by two stops, and if used with a zoom lens in macro mode it doubles previous magnification. Similarly, a 1.4 converter multiplies focal length, macro magnification and f-number by 1.4 (in other words, aperture is reduced one stop). Teleconverters are most often made for particular 35 mm format camera lenses of between 100 and 300 mm or zoom equivalents, and effectively give you two lenses from one. However, do not mix brands or try to use them on a main lens of the wrong focal length. Beware of converters claimed to be ‘universal’.
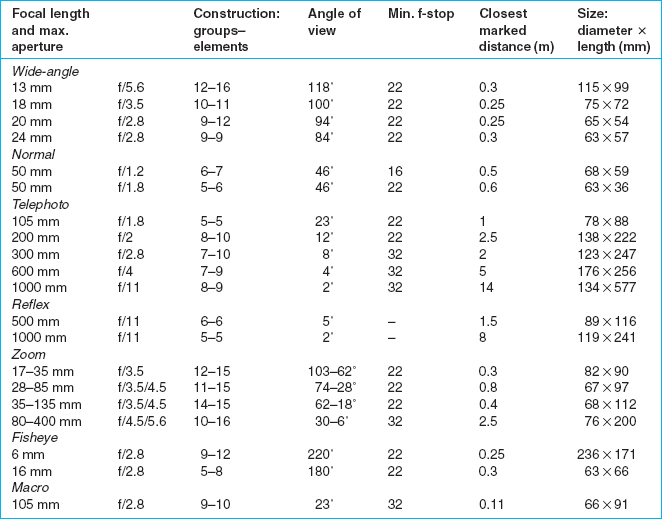
Figure 3.32 Specifications for a range of 35 mm format lenses. Notice the greater complexity of construction in wide-angle and zoom lens types. Also maximum apertures quoted for zooms often alter according to whether shortest or longest focal length setting is used. Long focal lengths are less able to focus close subjects (macro lenses excepted). The table also shows how telephoto lens size increases greatly with focal length, and many are heavy and costly.
A few converters are designed to fit over the front of a normal focal length lens. They form shorter focal length inverted telephoto lenses, giving a wide angle of view yet keeping the lens-to-film distance unchanged. A typical wide-angle converter changes a 50 mm lens to 30 mm, or a 35 mm lens to 21 mm. Often image quality deteriorates and in no way matches a fully corrected wide-angle lens of this focal length. An exception is some front-fitting converters designed to transform normal angle lenses into fisheyes (page 58).
A completely different type of converter, which fits between lens and camera body, adapts a manually focused lens to autofocus (AF), provided that the body contains autofocus drive. You leave the regular lens set for infinity. The camera’s autofocus mechanism engages with the converter and then moves focusing elements within it until a sharp image is sensed. The result is a fully autofocused system, although not as fast acting as one designed for AF.
Influences on image sharpness
Good lens quality is of vital importance, but for the best possible sharpness in your final print you have to take care at every key stage on the way. The following checklist contains all the main influences on image detail:
1. Lens quality. Use the highest-quality modern lens you can afford. Its covering power must match or exceed your camera’s picture format. The correction of aberrations must suit your typical subject distance. The lens should be multicoated to minimize scattered light.
2. Lens condition. Do not use a lens with scratches, grease, dust, condensation or misalignment of elements (e.g., due to physical mishandling). Avoid inferior filters, converters or close-up lenses.
3. Camera. Focusing must be completely accurate on the film – beware of non-registration of focusing screen, and also autofocus errors. Do not overuse movements (especially view camera shift movements which can position the picture format excessively off-axis). Sometimes the focus or zoom control slips when the camera is pointed vertically. Mechanical faults include SLR mirror movement vibration, shutter bounce or film starting to wind-on before the shutter has fully reclosed, etc.
4. Shooting conditions. The atmosphere may contain dust, ripples of warm air, pollution and moisture particles. Avoid shooting through glass windows, however clear looking, especially with a long focal length lens. Prevent vibration or movement of camera or subject during exposure.
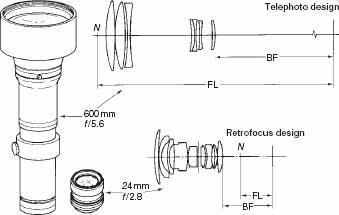
Figure 3.33 Bulk and weight increase with focal length. However, differences are made less by telephoto and retrofocus (inverted telephoto) designs. Rear diverging elements give a telephoto a greater focal length than its back focus. Front diverging elements give retrofocus designs shorter focal length than back focus. Without this the larger lens here would be 25 times longer than the wide-angle.
5. The light-recording material. Its ability to resolve fine detail. With silver halide material this means film speed, grain and emulsion thickness; degree of exposure and development; also the type of developer. With digital capture it means the number and pitch of elements in the CCD; also whether it is a static one- or three-shot matrix or scanning array (see page 37).
6. Enlarging. With film image magnification, type of light source, quality and condition of enlarging lens; the flatness of the film in the carrier and accuracy of focusing; movement during exposure; and the contrast and surface texture of your printing paper.
7. Finally, there are the conditions under which you view your result, especially the brightness of the lighting and your viewing distance.
No one can control all these factors all the time, of course, but at least try to use equipment and routines which minimize the pitfalls if optimum sharpness is important in your work.
Using lenses created for 35 mm systems on DSLRs
One of the advantages of digital SLR cameras is their ability to accept interchangeable lenses from existing 35 mm film SLR systems. If you currently own a 35 mm SLR film camera and are considering upgrading to a digital SLR system (or have already done so) you may be wondering if your existing collection of lenses can be effectively used on your digital SLR system. Manufacturers of DSLR systems, will fit lens mounts to their cameras that accept older lenses for film based 35 mm cameras in an effort to persuade existing users to stay with the brand. In most cases lenses designed for 35 mm cameras can be interchanged with DSLR camera systems, however, the following issues need to be considered.
Advantages
Most DSLRs use a sensor with smaller dimensions than the size of a 35 mm frame. The ratio of the sensor format relative to a 35 mm frame is known as the ‘crop factor’. The smaller the sensor, the higher the crop factor. For example, the Nikon D70s has a crop factor of 1.5 and the Four Thirds System used in Olympus DSLRs has a crop factor of 2 ×. When a lens designed for a 35 mm film camera is used on a DSLR, its apparent focal length is increased by a multiplier equal to the ‘crop factor’. This happens because the angle of view is reduced due to the smaller sensor. For example, a 50 mm lens on the Nikon D70s provides the same field of view as a 75 mm lens on a 35 mm system. Smaller and lighter lenses can be used. For example, a 400 mm f/5.6 lens of a 35 mm system becomes a 600 mm f/5.6 lens on a Nikon D70s, yet the lens is smaller lighter and cheaper.
The effective depth of field (DOF) on a DSLR is greater than on a 35 mm camera when a lens of equivalent focal length is used at the same aperture. For example, if the 50 mm lens on the Nikon was set at f/5.6 then the DOF on the Nikon would be greater than the DOF on the 35 mm camera when a 75 mm lens at f/5.6 was used even though the field of view was equivalent. Shorter exposures for the same DOF are therefore possible resulting in less chance of image blur due to camera-shake.
The image captured by a sensor in a DSLR comes from the centre of the lens. Most lenses suffer from some degree of distortion and this is generally higher at the outer edges of the lens. Cropping from the central portion means that most of the distortion present will have been cropped out of the final image.
Disadvantages
Very wide-angle lenses are more difficult to obtain. For example an OM Zuiko 21 mm f/3.5 lens on an Olympus DSLR using the Four Thirds System is equivalent to a 42 mm f/3.5 lens on an OM system.
The greater DOF that is obtained in a digital system may not be so good if, for example, very shallow DOF is required for artistic purposes.
As mentioned earlier with very wide-angle lenses designed for a 35 mm camera, the light exiting the lens can strike the surface of the sensor at an oblique angle. This can affect the sharpness and contrast of the resulting image.
The resolution of a lens designed for a 35 mm may not be adequate. Recall, that due to the smaller sensors used in DSLRs the lens will have to resolve more lines per millimetre on the sensor than on 35 mm film if the same size print is made from both systems. Some loss in sharpness may result in this case.
Sensors used in digital cameras are highly reflective as compared with film and this can result in higher levels of stray light bouncing around inside the camera when the shutter is open. This can degrade image quality if a lens with a poor anti-reflection coating is used. The coatings used on older lenses will have been designed to reduce flare to an acceptable level for a film-based camera system. They may not be so effective at reducing light levels when used on a DSLR. Some loss in contrast may be observed. Newer lenses designed for digital systems have improved multi-coatings that are optimized for use with the highly reflective sensors used in digital cameras.
SUMMARY
![]() Lenses begin with optical glasses, manufactured with precise RI and dispersive qualities (Abbe number). Glass should be colourless, offer the right machining qualities, yet be tough and stable.
Lenses begin with optical glasses, manufactured with precise RI and dispersive qualities (Abbe number). Glass should be colourless, offer the right machining qualities, yet be tough and stable.
![]() The designer works to satisfy a given lens specification (focal length, coverage, maximum aperture, focusing range, etc.). The challenge is to avoid optical aberrations by combining elements of different glasses, deciding their shapes and spacing. Developments such as new glasses with extreme combinations of RI and dispersion, aspheric shaping and ‘floating elements’ extend design possibilities, but a balance always has to be found between optimum performance and economic price.
The designer works to satisfy a given lens specification (focal length, coverage, maximum aperture, focusing range, etc.). The challenge is to avoid optical aberrations by combining elements of different glasses, deciding their shapes and spacing. Developments such as new glasses with extreme combinations of RI and dispersion, aspheric shaping and ‘floating elements’ extend design possibilities, but a balance always has to be found between optimum performance and economic price.
![]() Lens image quality is difficult to express, depending on contrast as well as detail. Do your own test of performance using fine print or a pinhole light source as subjects, comparing their appearance on-axis and in outer-zone parts of the image. Manufacturers publish modulation transfer graphs, plotting percentage modulation against position in lens field (millimetres from axis) for a particular spatial frequency (fineness of detail) in lp/mm.
Lens image quality is difficult to express, depending on contrast as well as detail. Do your own test of performance using fine print or a pinhole light source as subjects, comparing their appearance on-axis and in outer-zone parts of the image. Manufacturers publish modulation transfer graphs, plotting percentage modulation against position in lens field (millimetres from axis) for a particular spatial frequency (fineness of detail) in lp/mm.
![]() MTF curves show you how far acceptable coverage extends – therefore size of format covered. They show the changes in performance to expect when you stop down; come closer; use movements or a larger film; or accept lower standards. Plots are often made
for 60 lp/mm (for digital SLR formats), 40 lp/mm (relevant for 35 mm format), 20 lp/mm (for large format) and 10 lp/mm. In practice, much also depends on the film or sensor format used and your final viewing distance.
MTF curves show you how far acceptable coverage extends – therefore size of format covered. They show the changes in performance to expect when you stop down; come closer; use movements or a larger film; or accept lower standards. Plots are often made
for 60 lp/mm (for digital SLR formats), 40 lp/mm (relevant for 35 mm format), 20 lp/mm (for large format) and 10 lp/mm. In practice, much also depends on the film or sensor format used and your final viewing distance.
![]() A different form of MTF graph plots percentage modulation against a wide range of frequencies for one given point in the format (e.g., on-axis). This is helpful when comparing lenses against each other and the known frequency range limits of your recording medium.
A different form of MTF graph plots percentage modulation against a wide range of frequencies for one given point in the format (e.g., on-axis). This is helpful when comparing lenses against each other and the known frequency range limits of your recording medium.
![]() The visual resolution shows how well detail in the scene can be resolved. It is measured by visually observing the point where individual black and white lines on a test chart can no longer be distinguished. It is normally reported in lp/mm or LW/PH. Remember that two lenses with the same resolution may differ in sharpness depending on their MTF.
The visual resolution shows how well detail in the scene can be resolved. It is measured by visually observing the point where individual black and white lines on a test chart can no longer be distinguished. It is normally reported in lp/mm or LW/PH. Remember that two lenses with the same resolution may differ in sharpness depending on their MTF.
![]() When buying a lens read the manufacturer’s technical information and comparative reviews in the photographic press. Focal length and maximum aperture are important, but ensure that corrections are designed for your kind of work, the lens gives sufficient coverage, and weight and size are acceptable. Carefully check the physical condition and optical performance of used lenses before purchase.
When buying a lens read the manufacturer’s technical information and comparative reviews in the photographic press. Focal length and maximum aperture are important, but ensure that corrections are designed for your kind of work, the lens gives sufficient coverage, and weight and size are acceptable. Carefully check the physical condition and optical performance of used lenses before purchase.
![]() Zoom lenses use floating elements to change focal length and adjust aberration corrections without disturbing focus. Zooms with variable maximum apertures can give inaccurate exposure when you alter focal length, if you use a separate meter or flashgun. Image standards vary – the best lenses (often having more limited zoom range) are excellent.
Zoom lenses use floating elements to change focal length and adjust aberration corrections without disturbing focus. Zooms with variable maximum apertures can give inaccurate exposure when you alter focal length, if you use a separate meter or flashgun. Image standards vary – the best lenses (often having more limited zoom range) are excellent.
![]() Mirror (catadioptric) type long focal-length lenses are compact and lightweight, and very easy to handle. However, fixed aperture limits your auto-exposure modes, and off-focus highlights have assertive shapes.
Mirror (catadioptric) type long focal-length lenses are compact and lightweight, and very easy to handle. However, fixed aperture limits your auto-exposure modes, and off-focus highlights have assertive shapes.
![]() Fisheyes – extreme wide-angle lenses with curvilinear distortion – give results very unlike human vision. Use them with restraint for dramatic effects, recording wide expanses of surroundings, and for their extreme depth of field. Filters and lens hood are built in.
Fisheyes – extreme wide-angle lenses with curvilinear distortion – give results very unlike human vision. Use them with restraint for dramatic effects, recording wide expanses of surroundings, and for their extreme depth of field. Filters and lens hood are built in.
![]() ‘Soft focus’ gives a more subtle suppression of fine detail than out of focus or general diffusion. Soft-focus lenses allow fine control of the effect by internal movement of floating elements, changing perforated discs or just stopping down. Focus, and view, at your working aperture. Soft focus spreads highlights of positive images, spreads shadows when used in enlarging negatives.
‘Soft focus’ gives a more subtle suppression of fine detail than out of focus or general diffusion. Soft-focus lenses allow fine control of the effect by internal movement of floating elements, changing perforated discs or just stopping down. Focus, and view, at your working aperture. Soft focus spreads highlights of positive images, spreads shadows when used in enlarging negatives.
![]() Macro lenses are corrected to perform best at close subject distances. Most have an extended focusing movement and scale of (reciprocal) magnification numbers. For still closer technical work, use bellows and ‘true’ macros, each designed for a narrow band of distances. Remember to recalculate exposure, unless you measure light through the lens.
Macro lenses are corrected to perform best at close subject distances. Most have an extended focusing movement and scale of (reciprocal) magnification numbers. For still closer technical work, use bellows and ‘true’ macros, each designed for a narrow band of distances. Remember to recalculate exposure, unless you measure light through the lens.
![]() A good teleconverter – designed to fit specific, same-brand, moderately long focal length lenses – gives you a still longer focal length option without loss of quality. Aperture, however, is reduced. Other kinds of lens converter change normal lenses to wide-angle or fisheye, or adapt manual lenses to autofocus.
A good teleconverter – designed to fit specific, same-brand, moderately long focal length lenses – gives you a still longer focal length option without loss of quality. Aperture, however, is reduced. Other kinds of lens converter change normal lenses to wide-angle or fisheye, or adapt manual lenses to autofocus.
![]() Main factors affecting image sharpness are lens quality and condition; the camera’s mechanical accuracy; movement, subject and lighting; characteristics of your light-sensitive material and its exposure and processing; enlarging and final viewing conditions.
Main factors affecting image sharpness are lens quality and condition; the camera’s mechanical accuracy; movement, subject and lighting; characteristics of your light-sensitive material and its exposure and processing; enlarging and final viewing conditions.
![]() In most cases lenses designed for use in 35 mm film cameras can be successfully used in newer DSLRs often resulting in advantages such as longer effective focal lengths and greater depth of field. But differences in the design of digital and film camera systems may mean that the image quality obtained may be compromised. Newer lenses designed for digital systems provide optimal performance and image quality. These lenses provide higher resolution, and improved sharpness, contrast and colour reproduction in a DSLR compared to lenses designed for film camera systems.
In most cases lenses designed for use in 35 mm film cameras can be successfully used in newer DSLRs often resulting in advantages such as longer effective focal lengths and greater depth of field. But differences in the design of digital and film camera systems may mean that the image quality obtained may be compromised. Newer lenses designed for digital systems provide optimal performance and image quality. These lenses provide higher resolution, and improved sharpness, contrast and colour reproduction in a DSLR compared to lenses designed for film camera systems.
PROJECTS
1 Arrange to photograph a target containing fine detail using a lens with normal field of view, such as 50 mm lens on a 35 mm camera. Make sure the focus is accurately set. Then take several exposures of the scene starting with the aperture set wide open, all the time ensuring that the exposure is maintained normally by adjusting the shutter speed as necessary. Verify that the depth of field is higher for small apertures than it is for larger apertures. Experiment with selective focusing using depth of field as a technique to isolate a subject from the background.
2 Using a digital camera fitted with a sensor of known ‘crop’ factor capture a scene using a medium or wide angle lens setting. Determine the focal length used and then using a film camera capture the same scene with a lens whose focal length is as close as possible to the equivalent focal length for a 35 mm system. A digital SLR with a 35 mm sensor size can be used instead of a film camera. In this example the focal length would be the focal length used in the digital camera multiplied by the ‘crop’ factor. Verify that the field of view in the 35 mm camera system and the digital camera is equivalent.
3 Fit a wide-angle lens designed for a 35 mm film SLR system to a digital SLR camera. Capture a high contrast scene at aperture values ranging from the maximum to the minimum settings. Then replace the lens with a lens of the same focal length that is designed specifically for use in a digital SLR. Capture the same scene with the digital lens. Observe the overall sharpness of the images obtained from each experiment. Compare the levels of chromatic aberration in images captured with the film lens with those captured with the digital lens. Chromatic aberration is usually noticeable in high contrast areas (e.g., tree branches against a brightly lit sky or cloud) and is normally worse at the periphery of the image.