Chapter 5
Bringing It All Together
In Chapter 2, we discussed in-database processing and its value of applying analytics where the data reside. In Chapter 3, we explained in-memory analytics and how data could be lifted in-memory for game-changing results. In Chapter 4, we introduced Hadoop and how it can fit into the data management and analytical landscape. Each of the previous chapters combined is like a running a relay, and we tie it all together in this chapter to help you through the stages—crawl, walk, and sprint. Now, let's bring all of the components together (in-database, in-memory, Hadoop) into what I call a collaborative data architecture so that your organization can effectively run a seamless relay to conquering big data management and analytics.
This chapter will cover the following topics:
- How in-database analytics, in-memory analytics, and Hadoop are complementary in a collaborative data architecture
- Use cases and customer success stories
- The benefits of an integrated data management and analytic architecture
BACKGROUND
Historically, many companies have adopted one data management system to store all their data in the form of an enterprise data warehouse or departmental data mart. This single-system architecture may have met the business requirements when it is mainly structured data. The analytics and reporting applications can access the data and analyze and deliver results to management when requested. As time progressed, three things have evolved:
- Data volumes are growing and organizations are purchasing new hardware/software to accommodate the growth.
- Business analytics and reporting are generated in near real time, which puts an extreme burden on querying performance.
- Analytics are becoming more complex with more data to analyze, variables to consider, and data models to execute for data-driven decisions.
The analytics workloads involve extensive calculations and are both compute-intensive and read-intensive, which can place a heavy burden on the data warehouse. The process normally requires retrieving the entire data sets and not just a subset. Most analytic workloads are executed in a batch mode, and the results from these workloads are fed to various downstream applications such as business intelligence, reporting, and/or visualization.
As the analytic workloads grow bigger with more complex computations and many more variables to consider, organizations are stretching their single data warehouse environment to its capacity. Businesses have three options:
- Purchase additional servers or hardware to expand the use of the data warehouse.
- Add workload-specific hardware that is tied to the data warehouse such as a data mart.
- Decide what data to keep in the data warehouse and offload nonessential data to other platforms.
Combining these options will give you the optimal environment for existing use cases as well as new use cases to meet the business requirements for data-intensive analytical projects. However, having one data management system might not be the best fit to manage the structured data and semi-structured data.
COLLABORATIVE DATA ARCHITECTURE
Your current data warehouse may scale well to support complex analytics and data models and access from hundreds of users with varying workloads in a rigorously controlled, highly governed, and managed environment, but there are classes or data types that are not likely going to benefit from having that data residing in the data warehouse. You may need to recognize that the enterprise data warehouse may not always be the ideal place for certain classes of data. For example, your data warehouse might support semi-structured data, log files, or streaming sensor outputs to be stored in the form of binary large object (BLOBs), but placing them there might not provide any analytic lift for the statisticians or data scientists. Data types like BLOBs are very capable of storing virtually any random content, but if your end goal is to support parsing, text analytics, and keyword lookups, then perhaps storing them in another platform may be more suitable and preferable for optimal use.
To accommodate the various classes and types of data, the collaborative data architecture is ideal for integrating data management and analytics within a unified platform, as shown in Figure 5.1. Most likely, your data sources come from your ERP, CRM, images, audio, visual, logs, text, web, and social media. As the data sources are captured, they can be stored in any or all of the three platforms shown.

Figure 5.1 Collaborative data architecture
Collaborative Data Architecture provides three distinct, purpose-built data management platforms, each integrated with the others, intended for specialized needs for your data.
Staging Warehouse
The staging warehouse platform is intended to be an economical platform to capture and store all your data types. This data may not be fully structured, and do not yet need to be accessed for operational reporting across the enterprise. Frequently, the platform is used to collect sets of enormous files, like web logs, machine sensor outputs, or even web log outputs, all of which have some analytic value to them, and semi-structured data. Most importantly, it just needs to be stored in a large clustered file system.
This platform is ideal for supporting highly flexible data capture and staging for all data sources, including structured and semi-structured. For example, you can leverage the Hadoop technology for pre-processing of large volumes of data and preparing the data to be stored in the data warehouse or data mart, or be used by any of the applications such as analytics, business intelligence, or marketing.
Fit for Purpose Data Mart
This platform is a subset of the data warehouse that is usually purposely built for a specific department, group, business team, or line of business. Because it is a subset of the data warehouse, the data mart improves end-user response time by allowing users to have access to the specific type of data they need.
The fit for purpose data mart could be intended for specific analytic processing, but organized into functional areas such as marketing, operations research, sales operations, and so on. In this case, there's a trade-off, where we are dropping some of the user concurrency requirements in exchange for high levels of analytic flexibility.
For example, customers leverage a data mart for just demand forecasting. All of the data residing in this data mart can be used for a selected group of data modelers and data scientists who build statistical data models to anticipate supply and demand for products and services. Another example is in the pharmaceutical industry where a data mart is created for a specific drug development analysis. There are many variables and data points for analysis to bring a product to market. In the pharmaceutical industry, strict standards and regulations are in place and must be followed before a drug is available to the consumers. Thus, this data mart is highly governed and only accessible by a small group of data scientists for analytics and modeling purposes.
Enterprise Data Warehouse
This platform is for delivering strategic and operational analytics throughout your organization, so users from across the company can access a single source of consistent, centralized, and integrated data.
The enterprise data warehouse is targeted at rigorous, highly structured, “ready for prime time” data that can be used by business and analytic users across all departments or enterprise. The data warehouse addresses enterprise data readiness concerns, not only with the ability to scale to support more users, wider range of user applications, or larger volumes of data, but also to anticipate potential failures, keep running in the state of problems, and provide management and monitoring environment to ensure that the environment continually supports data access from around the business. It is ideally suited for modeled and integrated data to support end-to-end optimization and operationalization.
Many customers already utilize an enterprise data warehouse to gather data from multiple operational data sources that integrate together to provide a “single version of the truth.” The integrated data in the data warehouse possibly feeds hundreds of downstream applications and thousands of business users. However, much if not all of the data are generally relational; organized into tables, rows, and columns; and accessible by SQL. Depending on the data maturity that you may be working with, other platforms may be better suited, such as the staging warehouse or the fit for purpose data mart.
For larger companies, they may utilize the different aspects of the collaborative data architecture side by side, each with a special purpose perspective on the end-to-end data life cycle, evolving and maturing data from its “staged” landing area on Hadoop, right up to the “ready for action” enterprise data warehouse environment.
The ultimate goal for the collaborative data architecture is to enable organizations to access and analyze all their data to make smarter decisions and develop a new, data-driven approach to improving their business and the bottom line. The ability to apply analytics and to deliver deeper insights about your customers, operations, and services can deliver a unique competitive advantage. Let's examine in the next section how data and analytics can be managed in the different scenarios.
SCENARIOS FOR THE COLLABORATIVE DATA ARCHITECTURE
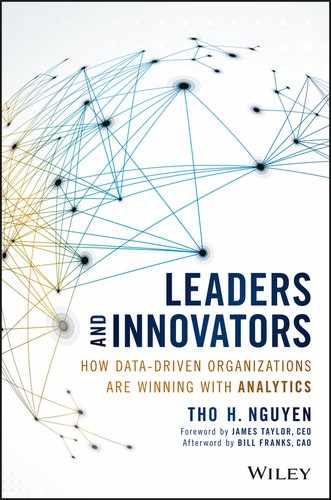
In Chapter 4, I illustrated the basic architecture of how structured data can be stored in the data warehouse and semi-structured data can be stored in Hadoop. Let's expand on the use and tie it to the collaborative data architecture.
In our first scenario, we use Hadoop as a staging platform for your enterprise data warehouse, as shown in Figure 5.2.

Figure 5.2 Hadoop as a staging warehouse for your structured data
If your organization is just collecting structured data, this scenario can be ideal for you. In this setup, it is a simple case of capturing and managing structured data and integrating with Hadoop. Hadoop can be used as a data staging warehouse or platform to load data into your enterprise data warehouse. Instead of staging the data at the data warehouse level, you can apply the data integration process at the Hadoop platform. According to The Data Warehousing Institute (TDWI) “Best Practices Report” on Hadoop, 39 percent of the participants surveyed indicated that they use Hadoop for their data staging area for data warehousing and data integration.1
As mentioned in Chapter 4, Hadoop comes with Hadoop Distributed File System (HDFS) and MapReduce. You can leverage MapReduce by writing some code to bring the data into HDFS, transform it, and then load the integrated data into the enterprise data warehouse. In this situation, you can choose the data that you want to transform and load into the data warehouse, and the remaining data can be kept in Hadoop until it is ready to be transformed. This approach has several benefits:
- Distribute the processing power
It can be challenging to get all of your ETL (Extraction, Transformation, and Load) jobs to complete in a timely manner with higher volumes of data. If that is your case, you may want to consider leveraging Hadoop to offload some of this tedious work to the Hadoop platform. Typically, you process the data by applying the ETL functions at the data warehouse platform. With Hadoop in the mix, it can handle some of the data manipulation and preparation for you. Hadoop can be the staging platform and can free up the resources from your enterprise data warehouse. Data can be processed, transformed, and then loaded into the enterprise data warehouse quicker so that the downstream applications can access and analyze the data. - Cost
Over the years, the cost of storage has dropped significantly, and Hadoop can be a great medium for this purpose. All your raw data can be stored and kept in one place. You can easily manage the data, process it when ready, and load it into the enterprise data warehouse for analysis. Since Hadoop keeps a copy of the raw and transformed data, having an alternative low-cost option is valuable for managing data growth.
If your company is capturing semi-structured data sources and you want to integrate them with your structured data, then Hadoop can help to manage all your data sources. In Figure 5.3, consider Hadoop to be your data lake for all your data sources as they are captured.
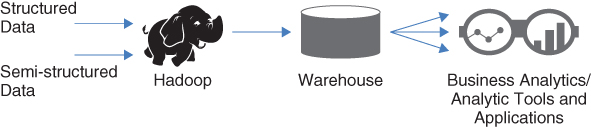
Figure 5.3 Hadoop as a data lake
The infrastructure in Figure 5.3 is very similar to Figure 5.2, but in this instance, you are incorporating semi-structured data into the mix. Hadoop can act as your data lake—a temporary data storage for all your data sources. In this circumstance, you can integrate the data that is not currently available in your enterprise data warehouse. For example, some of your structured data sources coming into Hadoop may not be integrated into your enterprise data warehouse. In addition, you can now include the semi-structured data to provide additional insight about your customers, products, and services. Because Hadoop can store any data source, it can be complementary to the enterprise data warehouse. According to the TDWI “Best Practices Report,” 46 percent of the respondents indicate that they use Hadoop as a complementary extension of a data warehouse.2 In the same report, 36 percent of the participants say that they use Hadoop as a data lake. You should consider this architecture if you want to integrate structured and semi-structured data in one location.
In this situation, your enterprise data warehouse is the center of your universe and the key component for your analytics applications and business intelligence tools to access for analysis. This arrangement is geared toward organizations that want to keep the enterprise data warehouse as the de facto system of data. Hadoop is used as the data lake to capture all data sources and process and integrate them before they get loaded into the enterprise data warehouse.
Benefits for this scenario include the following:
- Data lake advantage
The data lake can capture all of your data sources at a lower cost. Your data warehouse can be used for critical mission analysis while the data lake can store all noncritical data. You can keep what data you want and flush what you do not want to keep, while the data warehouse is for cleansed and integrated data for your enterprise. - Complementary use of Hadoop
Hadoop extends traditional data warehouse infrastructure to support more data and offload some of the work from the data warehouse to be more efficient. - Highly governed environment
Because all of your data are stored in one place and leverage the enterprise data warehouse for all analyses, data governance is at its highest. All users access the data from the warehouse to apply analytics or reporting for the business needs.
In our next scenario, the environment gets a bit more complex to provide you the flexibility for the enterprise and departmental needs, as shown in Figure 5.4.
Figure 5.4 Hadoop for data exploration and discovery
Let's expand the setup to include a data mart for data exploration and discovery. In this scenario, you can use Hadoop as the landing/staging platform and exploit the strengths of Hadoop and the data warehouse. The concept of the data warehouse has existed for over 30 years and this infrastructure shifts the data management paradigm is a major way. As organizations have spent years in resources and financial support to build their enterprise data warehouse, Hadoop literally pops up as this emerging technology and disrupts the way data management has been conducted. This scenario focuses on the strengths of each technology and utilizes the strengths of Hadoop and the data warehouse so that organizations can further take advantage of their data.
Figure 5.4 illustrates step-by-step how it could work for your organization:
- All of your data—structured and semi-structured—are processed and integrated in Hadoop. Hadoop is now the central hub to load cleansed and integrated data into the enterprise data warehouse. Because the strength of Hadoop is to store all data in their raw and native state, it can be formatted upon request. While the traditional data warehouse requires some sort of data integration upfront, the Hadoop architecture does not. It promotes late-binding concept, a process of formatting the data at the time of the query is requested. In addition, business users do not have to wait for the data warehousing team perform the ETL process and model the data. This process can take days or weeks.
- In this step, it can get a bit complex, depending on your business needs. The intent for this step is to leverage a data mart for quick analytical analysis for a line of business or department that needs near-real-time analysis. For example, you can load some of your data (whether structured or semi-structured) into your data mart from Hadoop and the traditional data from the warehouse. Once loaded, use your analytical tools to develop the data models or compute intensive advanced analytics processes. Once it is completed, the results can be loaded back into the data warehouse or Hadoop. The purpose for this data mart is exploratory analysis, data-intensive processing of analytic models, and high volume, low-latency, near-real-time workloads.
- Deciding what to load into your data warehouse is essential for this step in this scenario. Not all data should be loaded into the data warehouse. The purpose of this data warehouse is an efficient and scalable platform for managing core business data and information. The enterprise data warehouse supports many use cases and addresses 95 percent of business intelligence, dashboards, and scorecards to monitor performance management.
- Once the data are loaded from Hadoop and/or the data mart, you now have a holistic view of the data in your enterprise data warehouse. By incorporating the structured and semi-structured data and analyses, the data warehouse is ideal for storing important data, and for delivery of information to the enterprise.
In Figure 5.4, benefits include the following:
- Raw data in low-cost storage
The strength and advantage of Hadoop is to store raw data in its native state. Once the data are captured, they do not need to be formatted immediately. The data can be formatted at the time of the request from the user. - Ability to explore and discover the data
The ability to explore and discover the data can be very advantageous. It allows you to know what you have or don't have so that you can better assess the data situation. You can also discover the relationship of the data and know the correlation of the data (big and small) with analytical tools. In addition, business analysts can determine the state of the data and ensure its validity. - Added flexibility
Not everything is dependent on the data warehouse. By absorbing the costs of data integration up front, the costs of extracting insights decrease downstream. Now that the processing is distributed among the Hadoop and data mart platform, the data warehouse is not overly burdened with queries. The Hadoop platform enhances the data lake concept and the data warehouse enables the enterprise focus.
Keep in mind that these three scenarios are just a subset of all the combinations possible when integrating analytics and data management with Hadoop, enterprise data warehouse, and data mart. In each of the setups, it is enabling companies to become more data and analytic focused:
- Harness and explore all of your data for definitive business value.
- Enhance agility and accelerate the time to value for data-driven decisions.
- Reduce the cost and complexity by eliminating the silos of application-centric approach.
Now that the architecture is explained and laid out, let's examine how in-database, in-memory, and Hadoop can coexist and be complementary.
HOW IN-DATABASE, IN-MEMORY, AND HADOOP ARE COMPLEMENTARY IN A COLLABORATIVE DATA ARCHITECTURE
Vendors offer in-database, in-memory, and Hadoop technologies. The sophistication and level of integration varies, depending on the vendors. For example, SAS and Teradata offer the end-to-end suite of technologies to enable in-database, in-memory, and Hadoop technologies for analytics and data management needs.
Let's start with in-database processing. In-database processing is offered at all stages of the analytical data life cycle. More technologies have been developed in this area because it is the most mature and offers the most bang for the buck. In reference to the collaborative data architecture, in-database processing can be enabled in all of the three platforms: staging, warehouse, and data mart.
As the name suggests, in-database technology is most used with a data warehouse environment. In Figure 5.5, vendors offer in-database software to help streamline the analytical process.

Figure 5.5 In-database processing
If your organization relies heavily on the data warehouse as the data universe, then applying the in-database processing where the data are makes logical and economic sense.
Some of the analytical vendors have partnered with the database vendors to integrate the analytical capabilities inside the database. These analytical vendors have tailored their software to run directly on the database system so you can process the data faster. For example, you can explore the data, prepare the data, develop the data model, and deploy the data model directly at the database level. Rather than having to extract a massive data set from your enterprise data warehouse and move it to an analytical server for analysis, now you can run and optimize these capabilities directly within the database. Your data are secured and the results are less error prone because you do not have to pull, copy, and analyze outside the database. Because your data warehouse has the most current data available, you can trust the results of your analysis.
You may recall that Figure 5.5 is the analytical data life cycle from Chapter 1. In-database processing can be applied to all stages of the life cycle. The processes include the following:
- Data preparation: There are in-database functions to prepare the data for analytics such as format, frequency, summary, and rank.
- Data exploration: You can apply in-database data quality at this stage to ensure that your data are accurate. For example, your abbreviations might need to be standardized or you might have to ensure gender analysis is correct.
- Model development: Once the data are in the right format and integrated, you can start to build a data model. Model development can be very complex and often include many variables and data.
- Model deployment: The data model can then be scored inside the database as well. By deploying the model logic directly within the database engine, it reduces rework time, leverage the power of the database for speed and performance, and deliver the information faster.
If your company has or is considering Hadoop as part of the mix, you can prepare the data in Hadoop. In this case, your data warehouse workload can be offloaded and shares the processing power with Hadoop.
In Figure 5.6, Hadoop can capture all of your data, and the data can be explored directly. There are a number of vendors in the market that offer tools to explore data, both structured and semi-structured. Once you decide what data you want to load into the data warehouse, you can then prepare the data and develop and deploy your data model—all inside the database.

Figure 5.6 Hadoop for data exploration
To further spread the workload away from the warehouse, you can add in-memory processing on a dedicated appliance.
In Figure 5.7, Hadoop is not part of the architecture. Although Hadoop's popularity is attractive, many customers are concerned about including it in the production environment. In this scenario, you can:
- Apply in-memory analytics to visualize and explore your data.
- Apply in-database processing to prepare the data.
- Build your model using in-memory analytics.
- Deploy or score your model in-database.

Figure 5.7 No Hadoop
In-memory analytics is very powerful, as described in Chapter 3. If your organization has large data volumes to be considered in a complex data model, in-memory analytics can quickly display all of your data sources within a user interface. As illustrated in Figure 5.7, data are lifted into memory for visualization and analysis. The same is true as you develop complex data models. The appliance that is connected to the data warehouse is dedicated to processing it in-memory to achieve super-fast performance. The combination of in-database and in-memory can provide end-to-end data management and analytics within an integrated environment (such as the collaborative data architecture).
Not all functions are available using in-database, in-memory, or Hadoop, exclusively, so you may need to combine these technologies along with your current infrastructure to make them work and complement each other for your data management and analytic needs.
The scenario in Figure 5.8 includes all of the technologies to help you:
- Explore data in Hadoop where all of your data sources are captured.
- Prepare the data using in-database processing.
- Develop your complex data models using in-memory analytics.
- Push the results from the models to score in-database.

Figure 5.8 Integrating Hadoop, in-database, and in-memory
Scenarios shown in Figures 5.5 to 5.8 have been implemented by customers in various industries. Let's examine some of these scenarios with use cases and customer stories.
USE CASES AND CUSTOMER SUCCESS STORIES
I want to share with you three use cases and customer success stories that adopt one of the three configurations using in-database, in-memory, and/or Hadoop. As you can see, each customer success story comes from a different industry with a common thread, which is optimizing analytics and data management in an integrated platform.
Large U.S. Retailer: In-Database and In-Memory with No Hadoop
The first success story is a large retailer based in the United States. This customer is a pioneer of the one-stop shopping concept. This retailer has hundreds of stores across the United States with thousands of employees committed to excellent customer service, low prices, quality products, and broad selection of brands. Many of its stores are now open 24 hours a day and most stores are open 364 days a year. It offers brick-and-mortar and online services to enhance the customer experience of shopping.
In recent years, the retail industry has evolved and gone through some of the most dramatic changes. This brick-and-mortar business is competing with many channels, especially with other large e-commerce businesses. Today, consumers have so many choices to buy products and services across dozens of retail channels such as drugstores, dollar stores, limited assortment chains, and local mom-and-pop boutique shops.
This one-stop shop sees some top trends that are changing the ways it does business:
- Consumers have many choices
According to Deloitte's 2015 American Pantry Study, consumers shop at five different types of stores to fulfill their needs.3 With so many choices, consumers are buying food and groceries across multiple channels that include supermarkets, supercenters, discount, convenience, membership club, and e-commerce stores. The reason for shopping at multiple stores is mainly due to the variety of value, quality, and brands that consumers are looking to purchase. They can no longer find what they want in one place. With so many choices, there is a need for retail businesses to differentiate themselves to attract consumers. - Price and quality of private labels are appealing
Sales of private labels are growing in popularity mainly due to their attractive pricing compared to more popular and national brands. According to a Packaged Facts survey, sales of private-label groceries are projected to grow 62 percent to $133 billion in 2016. The reason for the dramatic increase can be attributed to the economy and recession since private labels are typically less expensive. In addition, consumers believe that private label products offer the same quality as their counterparts. According to a report from IRI, a market research company providing clients with consumer, shopper, and retail market intelligence and analysis, more than 90 percent of consumers believe private-label solutions offer the same or better value versus their national brand counterparts, and more than 80 percent believe that the quality of these products is the same or better.4 - Fresh products attract consumers
Surprisingly, fresh produce is a primary driver for consumers in deciding where to shop. According to a Packaged Facts survey, 75 percent of consumers say the produce department is the most important, followed by fresh meat, poultry, and seafood (60 percent); store brand products (36 percent); local farm foods/produce (35 percent); and the in-store bakery (29 percent). As a consumer, I find this statistic to be very surprising and unexpected, as I thought price would be the main attraction for consumers. Growing up in a large family, my parents would look for the best or lowest prices for produce, meats, and other grocery merchandises.
Background
A study conducted by A.T. Kearney found that nearly 40 percent of retailers with loyalty programs fail to use all of the data to fully understand their customers.5 Even when they do, some retailers who gained that insight failed to ever translate it to action.
With changing times in an evolving market, this customer created an initiative to evaluate data mining tools and advanced analytics to meet the business needs. Specifically, the project focuses on the ability to analyze customers and household purchasing data at the granular level. The project has five goals:
- Effectively manage and analyze the growing data volumes
With the increasing number of stores opening and an expanding customer base, the volume of data being collected is growing at a much faster pace. The stores are also adding more merchandise to their shelves to attract buyers with national and private brands. In addition, they want to expand their loyalty customer program with specific offers and incentives for shopping at their stores. Not only has the volume of the data for their data warehouse increased, the types of data collected has grown as well. The size of their enterprise data warehouse has expanded by 25 percent. Thus, a new way of managing the volume growth is needed. In addition, the enterprise data warehouse system is overburdened with queries and analysis that it is taking the retailer longer than expected to execute its analytical processes and reporting needs. With the current infrastructure, the data are not managed effectively to enable a data-driven organization. - Streamline the analytic workflow
The current analytic workflow is too complex. Out of the five goals, the customer is laser focused on this one because it is the most important area for the company. The current analytic approach is very elementary, and the retailer wants to widely adopt analytics across the enterprise to deliver data-driven decisions. This one-stop shop wants to evolve from basic reporting and analysis to advanced analytics that include data model development, deployment, and data visualization by using all of its data that reside in the enterprise data warehouse. The current analytics process is too cumbersome, and they can only analyze a subset of the data because of the analytic application. In addition, the analytic team consists of data scientists and statisticians who are spending too much time manipulating the data and not really doing the core of analytics. For example, it takes several days for the team to extract the data from the data warehouse to the user's personal computer for analysis. During this process, the data scientists and statisticians are having to preparing the data in a form that is compatible for analytics. Preparing the data includes standardizing the data sources, integrating all data sources for consistency, and formatting the data for analytical purposes. The analytical team is spending about 80 percent of its time dealing with these mundane tasks while it should be focusing on the analytics side. Transforming the business into a data-driven company with advanced analytics is the ultimate goal for this retailer. - Improve scalability and performance
The amount of data stored in a database has a great impact on its performance. As mentioned earlier, the enterprise data warehouse is the system that stores all of the data for this customer. It is, however, no surprise that the queries get slower when the data volume grows. All analytics, reporting, and analysis rely on the enterprise data warehouse, and there are many users that touch this system through the day, weeks, and year. Since many of its stores operate 24 hours a day and 364 days in a year (with only Christmas off), the scalability and performance for the data analysis is an issue. Moving the data through the network from the data warehouse to their personal computer is a common practice that creates many headaches for the company. Not only does it create bottlenecks in the network but also analyses of the data can take weeks and days to complete. The personal computer has very limited memory and applications to do what is needed. Concurrent users are querying the data warehouse and constantly fighting for the same resources from the data warehouse. Now that the company wants to embark on advanced analytics, it will require more computations and data-intensive models to accurate analyze the customer base and loyalty program. The current infrastructure is struggling to scale and perform, and the executive team acknowledges that it needs to be improved if the company wants to adopt advanced analytics. - Enhance the need for data consistency
It is common to expect that the data sources come from multiple systems. Once extracted, data should be integrated and loaded in the data warehouse. For this retailer, it is not a standard process. Staff members spend a lot of time extracting data from the warehouse and then manually manipulating it in an effort to meet the reporting and analytics requirements. However, the data source may not be structured to support current analytics and reporting needs. It may not be consistent and formatted in a way that it can be consumed by the business analyst or statistician. More often than not, the condition and granularity of the data are inadequate to support downstream applications if data are not proactively handled properly at the data source. Once the data are extracted and circulated throughout the organization, it is challenging to manage the considerable amount of complexity, and meaningful analyses and reports are eroded. In addition, this customer admits that data quality is not at the forefront and is likely at the back burner (as mentioned in Chapter 2). To enhance data integrity and consistency, data must be cleansed, standardized, and integrated with other data sources. During the data cleansing process, missing values are determined and bad data are corrected. Only after all of these processes are executed should the data be uploaded into the data warehouse to enhance the data consistency. Because this customer has endured the data quality and inconsistency issue, it has impacted the performance of the marketing and sales campaigns and wasted the organization's money, time, and resources. - Invest in human capital
While working with this customer, this is an unexpected initiative that many companies tend to overlook because the bottom line and profitability tend to overshadow everything else. Many organizations say that their employees are their most strategic asset, but this company truly means it and stand behinds this initiative. The investment behind human capital extends across its thousands of employees. In its corporate office, IT and analytical team members were leaving for other companies. One of the reasons is that they were not really doing what they were hired to do. The IT team was not really focused on strategic tasks—instead, it was maintaining the ailing infrastructure and outdated systems. More attrition was endured from their analytical team. The staff spent more time doing data preparation and manipulation than analytics. These data scientists and statisticians were not applying their skills to develop and fine-tune the data models. Instead, they were forced to format the data sets, scrub the data, and prepare the data. These tedious and boring tasks were wearing them out, to the point that they wanted more exciting careers elsewhere. This effect trickled down to the business analysts, marketing, and other departments because many of their marketing and sales campaigns were ineffective. Losing good talent and personnel to competitors and other local businesses left a big void at this retailer. It was suffering from having to hire new employees and train them on what needed to be done. The executive sponsor for this analytical project decided that it was time to invest in human capital to keep employees challenged and on board with the company so that they could execute its long-term plans. The analytical team got more involved with the IT architecture so that whatever tools and technology the company adopted, it would meet their needs to support the company's vision. The transformation from just analytics and reporting is now shifted to more predictive analytics for this company.
Overview
The competitive nature of the business and the evolution of the retail industry have directed this customer to expand its reliance and use of analytics for insights that provide a competitive edge.
As the company yearns to adopt advanced analytics with the focus of predictive analytics, it needed a new, modern architecture and innovative technologies to support it. The process and journey led to the adoption of in-database and in-memory processing. It has been several years of evaluating and exploring different technologies and vendors.
In the traditional environment, all of the business analysts, data scientists, and statisticians have to do all of their analytics at their desk. There are a number of challenges with this process:
- Moving or copying the data from the data warehouse to the desktop can be very time consuming.
- Only a subset or small data set can be analyzed due to the capacity of the desktop.
- Everyone has a copy of the data that persists on desktops, which creates data silos.
- The analytical applications that are available on the desktops have limited functionality.
- Data models cannot be developed and scored in a timely manner.
Figure 5.9 shows the process. As illustrated, there are many steps that consume both time and resources. The customer can only transfer a sample of the data set from the data warehouse to the desktop to explore, develop models, and score. By analyzing a sample of the data, it does give you the big, holistic picture of the customer data and profile. In addition, data-driven decisions are executed partially due to the analysis from a small segment. Having a partial view of their customer data is not effective when it comes to executing marketing and sales campaigns of their customer loyalty program. With this current architecture, the team can only develop less than five data models and score them per week. This customer wants to expand its analytical capabilities to develop and score tens of models and eventually increase to hundreds of models.

Figure 5.9 Retail traditional process for analytics
New Architecture with In-Database and In-Memory
By working closely with the customer and understanding their goals, the direction was to explore and adopt a combination of in-database and in-memory technologies, as shown in Figure 5.10.
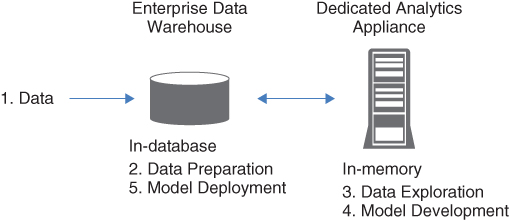
Figure 5.10 Integrating in-database and in-memory
The shift for this organization is going from just doing analytics to more descriptive and predictive analytics. This retailer wants to leverage descriptive analytics to answer questions such as:
- What happened?
- How many, how often? And where?
- What exactly is the problem?
- What is happening?
Descriptive analytics assess the past performance and comprehend that performance by mining the historical data to look for the reasons behind past success or failure of a decision. In this case, this one-stop shop wants to use descriptive analytics for business and management reporting—such as sales, marketing, operations, and finance.
Predictive analytics takes a leap beyond descriptive analytics. As the name suggests, it is an attempt to forecast an outcome based on the data analysis. It is using a combination of historical performances from descriptive analytics with rules, algorithm, and various external data sources to determine the probable outcome of an event or the likelihood of a situation going to occur. Like descriptive analytics, organizations apply predictive analytics to answer complex questions such as:
- Why is this happening?
- What if these trends continue?
- What will happen next?
- What's the best that can happen?
Predictive analytics is more sophisticated and requires involvement from statisticians and/or data scientists who can develop algorithms or data models to answer such difficult questions. As previously mentioned, this customer has dabbled in mode development but with limited scope and data to truly call it predictive analytics.
With that objective in mind, the customer wanted an analytical tool that is capable of delivering descriptive and predictive analytics and well integrated with the data warehouse. In Figure 5.10, it got just that. In this success story, the details will be around a specific focus, which is their loyalty program.
Most retailers, especially grocers, offer loyalty programs. Any loyalty program generates more data and, it hopes, more insights from consumers. The loyalty programs provide a win-win and reward both for the retailer (data) and consumers (in-store discounts). However, it is all about translating this data to understand “individual” purchase behaviors and behaviors outside of the purchase to gain the true meaning of the word loyalty.
Let's examine the process in detail to see how this retailer uses advanced analytics to improve its loyalty program by providing personalized offers and rewards to their customers:
- For the loyalty program from this retailer, the data sources going into the enterprise data warehouse include customer relationship management system, market basket, product, and group data. For example, customer data include first name, last name, email address, zip code, and phone number. Product data span a wide range because this is a one-stop shop where customers can buy literally anything they need from food to electronics to sporting goods. As this retailer expands, the data continue to grow in volumes and variety.
- As the data are collected and get loaded in the data warehouse, the data preparation process begins. A combination of in-database functions are applied as well as the traditional methods. Because not all the data processes can be enabled in-database, this retailer needs to maintain some of its traditional processes and complements them with what functions are available in-database. Let's focus on what this customer does in-database to prepare the data for analytics as illustrated in Figure 5.10, step 2.
When preparing the data for analytics, the analysts do the following:
- Sort the data: For example, you can sort the data by products or customers.
- Summarize the data: For example, summarize the number of customers shopping at a specific store.
- Rank the product: For example, rank the top five products sold from the weekly ad.
- Standardize the data: For example, standardize the first and last name of the customer by removing variations.
- Determine the gender: For example, classify the gender of the customer in categories, such as female, male, and other.
- Analyze the frequency: For example, deliver a count of coupons used per trip to the store.
- Deliver the right format: For example, ensure that the data set is in the right format for analytics.
The end result of this data preparation process provides the statistician and data scientist an analytical data set (ADS). Refer to Chapter 2 for more details about ADS. The streamlined process with the new architecture from Figure 5.10 shows the technologies adopted and what tasks are performed with the complemented and integrated environment.
- Data exploration (as shown in Figure 5.10, step 3) is executed in-memory using a data visualization tool. This visualization tool helps to further explore the data set for any correlation or relationship between variables. For example, the visualization tool can provide a graphical depiction of average money spent per trip by customer and store. This retailer explores the data in many ways:
- Examine the most busy stores and peak hours.
- Show what offers are used by customer.
- Determine the number of trips made by a customer at a specific store.
- Uncover what store generates the most revenue.
- Reveal what products need to be stocked.
In this scenario, data exploration allows the business analysts to keep what data they want to include in the data model development process.
- Model development (as shown in Figure 5.10, step 4) is the most critical process in this architecture. It is the science that delivers critical results for this retailer. The data model is used to predict the likelihood that a “household” will make a purchase within a specified sub-category/brand combination. This requires complex algorithm and many data points to support the model. There are two types of data model:
- Current customer model: Retain customers in the loyalty program.
- Potential buyer model: Expand market basket size by incenting customers to purchase in sub-categories they normally do not purchase within.
The data development is executed on a dedicated analytics appliance. This appliance's primary purpose is to develop complex data models with large volumes of data and many variables. With a dedicated analytics appliance, this retailer is able to develop many more data models compared to the traditional architecture. Currently, it is producing hundreds of models for its loyalty program. All of the power inside this appliance is dedicated to processing the analytics. The advantage of this setup is that it alleviates some of the burden from the enterprise data warehouse because the model development process is on a separate hardware. The team of statisticians and data scientists is able to test their hypothesis and instantly know whether the data models are working or failing. It is a way to easily test a combination of variables and data.
Compared to how the analytical data models were developed, it was taking days and weeks to complete due to the cumbersome process. Now that it is greatly streamlined, model development only takes minutes and hours to complete, depending on the complexity of the model. In addition, this architecture enables a highly governed environment because all of the data used to build the model come from the data warehouse.
- Once the model development is complete, the model can be scored inside the data warehouse (as shown in Figure 5.10, step 5). For this retailer, the results from scoring the model provide:
- Personalized offers for a specific customer. For instance, customer A is likely to use a coupon for diapers based on past purchases of baby items.
- Rewards for their loyalty customer for meeting certain conditions. For example, customer B receives a reward if the total purchase is over a certain amount based on five previous trips.
- Predictions for the propensity that a customer responds to a specific campaign by purchasing a product solicited in a marketing campaign. In this case,
- The customer has shopped and bought merchandise identified as solicited items within the allocated response period OR
- The customer has shopped and bought any items within the allocated response period.
- Predict those customers that are likely to respond to a specific campaign regardless of the season such as summer or winter. Thus, the score will select a population to receive the winter campaign since the holiday season is the busiest season for this retailer.
The ability to execute many of the functions in the database and have a dedicated analytic appliance has truly streamlined the end-to-end process for this retailer.
Summary of Benefits and Future
- Achieve faster and more robust analytic insights in less time.
- Accommodate additional workload with existing staff.
- Become more strategic instead of tactical with analytics.
- Execute models within minutes and hours versus days and weeks.
- Develop data models much quicker against large data sets.
- Enable fail-fast capability of the data models.
This retailer has made significant human investment. The plan is to hire more data scientists and statisticians to expand the support for enterprise analytics. With the expanded staff, it intends to develop many more data models, beyond hundreds of models to ultimately deliver superior customer experience through its loyalty program.
International IT Company: In-Memory with Hadoop as an Extension to the Data Warehouse
The next success story uses Hadoop as an extension to the data warehouse and uses in-memory analytics for exploring data to detect fraud for the government.
Background
Information systems for governance and public administration have been a high-priority concern in almost all countries. Governance and public administration cannot be productive, effective, and efficient without the support of modern data management and analytic technology. The use of analytics to analyze data and distribute information has been an absolute requirement for public administration and management development. Governments tend to partner with local agencies to provide advisory services and technical assistance in this important area. In practice, however, effective use of information technology and successful development of analytical systems in public sector are not simple. This is substantiated by the numerous government digitization and information systems projects that have failed across the world.
The tremendous speed with which information technology is changing causes misperception, delays, and false expectations for these solutions by many decision makers and government officers. Like the private sector, the public sector has similar issues:
- Confusions about the capabilities and limitations of technologies
- Incorrect development strategies
- Vague development priorities
- Insufficient resource planning
- Inadequate cost estimates
- Misinterpreted user needs
- Selection of wrong products
All of the above often cause information projects to fail. At the heart of the failure is the combination of the technical and management side of the government. Understanding what is the purpose of a government information system and how to develop it successfully is fundamental to government decision makers and managers responsible for their critical areas. The critical issues include: appreciation and understanding of the advanced analytics and data management, awareness of the trends of modern information technologies and their impacts on development strategies, and cognizance of government information infrastructure and information systems development. Similar to the private sector, the public sector is recognizing the value and role of promoting information technology to be used in public administration. In particular, analyzing data to detect fraud is a major focus in the public sector, particular for government agencies to reduce costs and waste of taxpayer's money.
Government programs and operations are vulnerable to a wide variety of criminal activities. Fraud has been a major issue if left unchecked and undetected and can seriously undermine the public's perception and confidence in their government. Taxpayers rightly mandate that public officials wisely use and preserve the money and power entrusted in their government. Social benefit programs such as health care, government loans, and grant programs are all exposed to false claims fraud. Individual acts of fraud and organized ones all add up to huge losses for the government.
Unfortunately, government officials and investigators are largely in reactive mode, chasing the money and the fraudsters after the act has been executed. The need for governments to do a much better job in protecting the integrity of these social programs is essential by proactively stopping the frauds before the money exits the account and before they become widespread and organized. Too often, too many programs are constrained by antiquated or archaic information technology systems. Modernization of these systems should include sophisticated data management and analytics that can enable better, faster detection, and fraud prevention controls to regain the public's faith and trust.
Overview
This customer is an international information and communication technology company for the ministry of economy and finance located in Europe. With more than 30 years of service, it is committed to ensuring the modernization of the public sector by simplifying administrative procedures and increasing integration between public administrations. This IT company promotes the development and innovation through technology to ensure unity and effectiveness of strategic data-driven actions for the government. With thousands of employees, it has designed and built information systems for taxation, self-service analytics, and applications for government departments. This company has cutting-edge technology infrastructure and network to support nearly 100,000 workstations and direct connection with external entities, citizens, businesses, and professionals. Through their efforts, it has created advanced decision-making tools supporting economic and financial policy from a centralized but complex database system. This innovative company cooperates with its customers to ensure high standards of quality and safety and invests heavily in technology, training, and research and development to prepare for the digital age of big data. Its focus in data management and analytics delivers concrete opportunities for growth and rationalization of spending to enhance efficiency of the public information systems.
The customer collaborates with the local authorities for assistance in developing a system to better identify where, when, and how fraud occurs. Working side-by-side, the agency identifies the issues and challenges with the current infrastructure:
- Need of insights and timely responses
The government agencies are not getting information that yield to insights in order to respond to critical issues in the tax office, customs office, state property, and minister of finance in a timely manner. Much of their responses to prevent fraud, for example, are weeks if not months after the fraudulent act is complete. - Lack of predictive analytics and self-service capabilities
Business analysts and power users of analytics are limited to what they can analyze. The current tools and technology allow them to analyze only what has happened, and they need the tools and technology to analyze what is likely to happen. Predictive analytics strengthen the ability to detect fraud. In addition, the government agencies lack the self-service capabilities to run reports and share information across different organizations. - Unable to detect anomalies in transactions
The first step to detecting fraud is the ability to report anomalies or strange behavior of the person or business applying for the relevant service or benefit. This process often involves collecting and analyzing the data effectively by using the right tools and technology to alert officials of suspicious claims such as social care, improper health benefits, housing entitlement, and so on. - Dynamically explore large volumes of data
There are many data points to consider when analyzing for fraud that amalgamate to large volumes of data. Considering a sample or partial data sets, which provide a limited perspective of the activities, will not give you a holistic view of the transactions. The ability to explore data dynamically and generate a series of reports will help to find, verify, and investigate people or businesses before fraud can occur. - Centralize analytics and reporting across agencies
Standardizing and centralizing analytics can deliver consistent views of information. It is often an unfortunate case where different analytics and reporting tools are used from silo data and create inconsistent results. Preventing fraud requires a robust process that delivers reliable and dependable information and will alleviate budgetary and resource pressures within the public sector.
Let's examine how this international IT company is helping the local government to improve its process with cutting-edge technology and innovation.
Driving Innovation with In-Memory Analytics, Hadoop, and Enterprise Data Warehouse
The goal of the IT company is to promote and consolidate a culture of transparency and integrity for the public administration. By understanding their needs, it is architecting a system to conduct activities to improve performance, economics, and governance by identifying the areas that are most at risk and providing support for acquiring a growing awareness around fraud. This company is taking strong measures to prevent and repress criminal acts in the public administration around fraudulent activities. The development of advanced technological solutions will help to achieve its goal (see Figure 5.11).

Figure 5.11 Public administration architecture for fraud
Data sources for this government agency are structured, more on the traditional side with rows and columns. The data warehouse is the definitive place for all of the data. The enterprise data warehouse has been developed with all kinds of data for decades. Data in the warehouse include census information, household, income, tax collection, and health status, for example. Instead of placing all of the analytical functions and processes on the data warehouse, it has adopted Hadoop to help alleviate some of the workload and performance augmentation. During peak hours of operations, hundreds of users are accessing the data warehouse for various queries and analysis. Hadoop in this scenario is used to extend the value and purpose of the data warehouse for storing data used for fraud-specific analysis. The data from the data warehouse are copied into Hadoop to prepare for in-memory analytics data exploration. This is where predictive analytics come into play. The data are lifted into memory to do the following:
- Provide hundreds of users technology to quickly explore and visualize data for trends and deeper analysis.
- Identify anomalies, irregularities, and fraud in health, gaming, and tax declarations for corporations and individuals.
- Generate reports on fiscal activities, tax collection, health care economics, billing, and use of IT resources by applying predictive and descriptive analytics.
Selecting the right technology and consulting services to integrate data management and analytics with the enterprise data warehouse, Hadoop and in-memory data exploration have allowed the public administration process to be streamlined and effective. The agency is now able to capture anomalies for fraud detection. It is able to do a cost comparison between generic drug and standard product for best and worst behavioral analysis to improve the health care program. It has developed an external web application for all types of users within the government agency to gather more information and define an outlier or anomaly to identify housing tenancy fraud, procurement fraud, payroll fraud, and pension fraud. More applications are being built as they adopt a vision for deeper analytical approach.
Best Practices and Lessons Learned
When the government was considering options in consulting services and technology, a proof of concept was conducted using the resources from the agency. It also leveraged the agency's network and expertise to advise on a standard practice and technology for data management and analytics. The need to centralize and standardize the process and analytics help the hundreds of users to look at the same data and decipher the same results across the government departments. The proof of concept consisted of hardware, software, and services.
Once the government selected the IT company to develop the architecture with bundled software, hardware, and services, it quickly learned that it needed to build the process from the ground up. Many of the users across the government agency were not used to exploring and visualizing the data that they had. They simply took what was there and applied basic analytics to it. Of course, it was often not integrated and/or had missing values in the data to make the analysis effective. In recent years, many customers have leveraged the data exploration process to summarize the characteristics of the data and extract knowledge from the data. They often use newer technologies such as data visualization tools with easy-to-use interfaces at their fingertips to quickly reveal trends and correlations. Visualization tools not only offer users the flexibility of the click-drag-drop user interface, they also have analytical functions for deep analysis of the data.
Building a strong foundation is key. Once you know what data you have to work with, you can use it to build a strong footing for any applications, such as fraud. Basic fraud-detection rules were needed to build an effective system, and the old infrastructure and process did not have it. A comprehensive fraud solution is complex, and many business rules need to be considered to detect the anomalies. Focus on a specific fraud case such as benefit overpayment so that you can show success in one area before expanding.
Let's examine another success story with all three components: in-database, in-memory, and Hadoop centered on an enterprise data warehouse.
National Railroad Company: In-Database, In-Memory, with Hadoop
The next success story is based in the United States and serves more than 10,000 customers by transporting goods and commodities that enhance our daily lives. Being one of the largest freight railroad companies, it employs over 40,000 people and operates across many regions and provinces.
With thousands of miles of track and locomotives, the company has more than 1,500 trains running per day and over 10 million carloads shipped annually. This company has developed one of the most advanced rail networks in the world by optimizing existing rail capacity and making record investments in new infrastructure and equipment directly connected to its operations. The reinvestment into the company sets high standards to improve safety and reliability.
This railroad company is paving its path to the future with analytics. It needs to make sense of all the data that they are collecting. It is applying predictive analytics to enable data-driven decisions to reduce delays and proactively identify issues.
Background
The railroad is a critical element that fuels the economy. No technology, grain for food, or automobile is worth a thing if it cannot move from the manufacturing floor to the consumer's hand. According to the most recent statistic from Commodity Flow Survey, railroads carry more than 40 percent of freight volume in the United States—more than any other mode of transportation—and provide the most fuel- and cost-efficient means for moving freight over land. To support this finding, this customer is able to move a ton of freight almost 500 miles on a single gallon of fuel. This is possible thanks to the technological advancements and innovative sensors in locomotives.
Today, the U.S. freight rail network is widely considered one of the most dynamic transportation systems in the world. The multibillion-dollar industry consists of 140,000 rail miles operated by national, regional, and local railroads. Not only does the railroad system move more freight and goods nationwide, it also offers numerous public benefits including reductions in road congestion, highway fatalities, fuel consumption and greenhouse gasses, logistics costs, and public infrastructure maintenance costs.
The U.S. freight railroads are private organizations that are responsible for their own maintenance and improvement projects. Compared with other major industries, they invest one of the highest percentages of revenues to maintain and add capacity to their system with technological advances. In general, bulk freight such as grain and coal ships in rail cars, while consumer goods such as products found at a neighborhood grocery or department store ship in containers or trailers called intermodal traffic. Intermodal traffic refers to the transport of goods on trains before and/or after transfers from other modes of transportation, such as planes, vessels, or trucks.
Almost anything can be shipped by rail. Bulk commodities products such as agriculture and energy products, automobiles and it components, construction materials, chemicals, coal, equipment, food, metals, minerals, and pulp and paper make up over 90 percent of the rail freight business. Intermodal traffic is less than 10 percent, which consists of consumer goods and other miscellaneous products. Compared to other modes of transportation, the rail option offers many benefits. It is efficient at moving heavy freight over long distances. While the trucking industry excels in providing time-sensitive delivery services for high-value goods being transported over medium- and short-haul distances, the rail industry delivers goods and commodities across the country. Raw materials and heavy freight going long distances are likely to continue their journey by rail, or some combination of truck, rail, and water. With the future growth in freight, it is anticipated that freight rail will continue to make investments in technology to increase capacity for long-distance shipments.
Similar to other industries, the rail sector is going through some significant changes and challenges to meet customers' demands. This company wants to offer multiple transportation solutions in a constant effort to be competitive. One area where it sees growth is intermodal transportation, which allows for containers consisting of all types of goods to be placed on rail and redeployed across the country to facilities where they are transferred to other forms of transportations (such as truck, ship, airplanes, etc.) to their final destination. The efficiencies gained from intermodal transportation are even greater with the emergence of double-stacked containers on railcars. With improvements in service and facilities, rail intermodal will become more competitive and absorb the projected increases in freight movement caused by population growth and the growth of the intermodal movement of goods into the future.
To compete in the global marketplace and to enhance quality of life, this customer has made significant investments in technology specifically in analytics.
Use of Advanced and Predictive Analytics
Preparing for growth and the future, this rail company is using advanced analytics to help drive data-driven decisions made by management and the leadership team. With a network of thousands of miles of rail tracks and tens of thousands of locomotive movements to transport millions of containers and products, there is an enormous amount of data to analyze and make sense of data. Advanced analytics can transform data into insights that the business leaders can use to determine how they can increase efficiency and expand the business.
Advanced analytics have become an essential and integral part of the business in the decision-making process. This company is using predictive analytics to uncover the most efficient and safest routes for their trains, adequately staff train crews, proactively order parts and equipment, inspect the trains for preventive maintenance, and so much more. Because the railroad operations can be very complex with so many moving parts, this freight company uses all its data and applies the science to help solve problems. It is also leveraging data to anticipate the changing needs of the business and adhere to government regulations. Another use of advanced analytics is analyzing the shipments of merchandise trains. These trains carry containers of mixed commodities such as lumber, paper, machinery, industrial parts, and various types of chemicals used in manufacturing. By using advanced analytics, the company is able to facilitate efficient movements of these shipments by grouping them based on their final destinations to minimize costs and sorting. In addition, it is able to improve the flow of the products, reduce the amount of time it takes to its final destination, and enhance their customer experience.
Analytics is also used in crew assignment and planning. Like any industry, labor costs are the biggest expense and it continues to grow. For many years, crew planning has been a manual task that takes a lot of time, energy, and resources. Planning and assigning a train crew is a complicated process that involves the consideration of many factors in a short amount of time. The train crew planner has to assign crews located across a large geography in the most efficient and cost-effective manner possible so trains are not delayed or canceled by any means.
This task becomes even more complicated with all the rules and regulations imposed by the government to observe and maintain safe rail operations. An analytical algorithm was developed to assign crew planning in real time in an effort to reduce the overall cost of positioning crews to operate trains within a territory. Once the appropriate resource is assigned, it is also using predictive analytics to accurately predict the arrival times of its trains. This information is shared with customers to track their shipments of products in real time. Customers can now know when the train has left the station, when it is in route, and when it will arrive to the final destination.
Timing is everything. In an industry of transporting goods, their customers are heavily relying on the railroad to get their shipments on time so that they can provide these products to us, the consumers.
Big Data Architecture with In-Memory Analytics and Hadoop
Even though this company is already using advanced and predictive analytics for many of its operations, it is continuously exploring innovative technologies and approaches to analyzing new data sources. Managing big data is nothing new for this company. It has been analyzing large amounts of data for years and relies on advanced and predictive analytics to strengthen data-driven decisions. For example, this company is gathering months of weather data and correlating it to track conditions and/or to track volume to forecast expected conditions. It also leverages video data sources to assess any number of conditions, such as missing or misplaced signs or vegetation growth to alert its field teams where to focus its efforts. To meet regulations or pursue its own continuous improvement objectives, many railroads are combining technology, processes, and shipper training—along with expertise from field-based damage prevention managers—to reduce cargo damage or loss. Rail safety begins with the quality of the underlying rail infrastructure. Maintaining and investing in tracks and equipment is key to preventing accidents. As they move more and more to real-time collection and analysis of critical data, big data technologies allow us to be even more responsive to our business and, in turn, our customers.
In today's data-diverse environment, everything in the rail industry can create an electronic trail of data about its operations and logistics. The analytics team utilizes the mounds of data to generate better inputs for its complex data models and improve its daily operations. New data sources come from sensors that monitor and assist in determining when would be the best time to schedule railcars and locomotives for inspections and maintenance. In addition, it uses data from GPS tools to help track the exact location of their assets. These data sources are detail-rich in nature and can help the company to create effective solutions and positively impact the profitability and its bottom line. Figure 5.12 illustrates the new architecture to support additional data sources.

Figure 5.12 Integrating Hadoop, in-database, and in-memory
In this scenario, this customer has invested in Hadoop, in-database, and in-memory technologies to modernized its architecture for the twenty-first century.
- The data has two paths: Depending on the type, the data can go into the enterprise data warehouse if it is structured data. If it is semi-structured data such as detectors and sensors, they go into Hadoop that acts as a data lake to collect a sample of the following sources of data:
- Wayside detectors: These sensors spot defects such as overheated bearings and damaged wheels, dragging hoses, deteriorating bearings, cracked wheels, and excessively high or wide load on passing rail cars.
- Acoustic detector systems: These trackside systems use acoustic signatures to gauge the sound and condition of internal bearings and identify those nearing failure. They supplement or replace systems that measure the heat that bearings generate to identify those in the process of deteriorating.
- Track geometry cars: These technology-rich cars utilize sophis-ticated electronic and optical devices to inspect track alignment, gauge, curvature, and so on. A new vehicle track interaction system is also used to locate difficult-to-find track geometry defects. This information helps railroads determine when track needs maintenance.
- Ground-penetrating radar: This technology assists in isolating below-ground problems—such as excessive water penetration that hampers track stability.
- If the data go directly into the data warehouse, the in-database process is used to prepare the data for analytics such as joining, merging, and creating the right format. In addition, this customer is taking advantage of the massively parallel processing of the data warehouse to enable bulk load, update, and export large data sets.
- The data development process combines the data from Hadoop and data warehouse. The data models consist of data from detectors, sensors, shipments, routes, time, crew, and so on. Statisticians look at many variables and situations to develop a comprehensive view of the business. Much of the focus is on detectors and sensors since this provides real-time perspective of the operations.
- In this situation, scoring the data and models is taking place in Hadoop. Scoring of sensors and detectors data creates alerts for the crews to proactively react to scenarios that can save the company money for outages and issues.
The rail and freight industry uses detectors and sensors to help to improve safety and service, and it is an area of technology with significant investment with high expectation on return of investment. These detectors and sensors generate a lot of data for this company. Detectors are installed under, alongside, above, and attached to the track to find defects in passing equipment, which adds another layer of safety to prevent unplanned incidents. The primary purpose of these detectors is to see, hear, or feel locomotives and railcars as they pass and determine if there are defects. Detector technologies also look for missing, damaged, or defective components from wheels to bearings.
These detectors are generating large data sets daily. There are five types of detection technology, and this company has more than 2,000 detectors collect data 24 hours a day and seven days a week across the system. The data collected from these detectors are analyzed along with other data sources, and the analytics team takes these inputs to develop a data model for predicting patterns and the likelihood of an issue happening to one of its trains. The analysis will help to tweak procedures and business rules criteria for operational improvements. In conjunction with detectors, sensors are the cutting-edge technology that produces many important data points to better manage and identify potential track and equipment defects. By integrating with existing and other types of data, the analysis can provide crucial and critical information about the rail network. By leveraging predictive analytics patterns can be revealed and derailments and outages can be prevented.
Collecting and analyzing detector data is another step toward proactive rather than reactive maintenance. Of course, being proactive can tremendously decrease the unplanned set outs of equipment that can impact velocity and improve safety of responders without increasing risk of derailment. The data from these detectors can augment manual inspections. The inspectors now have additional data points on what to look for and where to look. Ultimately, these detectors focus on derailment prevention and improved safety for the employees and our communities.
The data from the detectors and sensor are helping this company to manage its network to be more on the proactive stance instead of on the reactive position. In addition, it collects a vast array of fixed and mobile sensors to get a real-time view of its assets' condition and usage. Condition-based maintenance and engineering inspection systems will drive reliability in track and equipment, further optimizing maintenance practices. With advanced analytics by using in-memory technology, they will have the ability to model and predict the network impact of day-to-day decisions such as holding or rerouting a train.
The setup in Figure 5.12 serves many purposes for this organization and its customers. For the organization, it will be able to get the information from wherever with any device that includes dashboard and mobile devices. Manual inputs have been replaced with automation. Carrying paper documents and using outdated information is a thing of the past. Documents are automated, smart, and accessible to data and information from any time, anywhere, and any place. Instead of entering lots of data, information is distributed to line of business, managers, and executives. Systems will provide insight to what tomorrow will look like by integrating many different sources for more precise and accurate day-to-day decision making. Touch-, speech-, and gesture-driven applications are in use to better manage the operations. The result of all of this effort behind predictive analytics is that our network should hit new records for safety, velocity, and on-time performance. Working with its customers and partners, it continues to work not only hard but also smart to provide a safe, reliable freight delivery service for our customers.
In addition to organizational benefits, the customers of this freight company are also reaping advantages from predictive analytics. For the customers, data from GPS systems can be analyzed to identify real-time shipment status and more accurate estimated time of arrival. The end goal is to capture customers' needs and proactively know any potential concerns and issues as well as opportunities to enhance customer experience.
INVESTMENT AND COSTS
The blend of in-database, in-memory, and Hadoop requires the most extensive investment. As expected, this combination delivers the highest competitive advantage because of its comprehensive ability to analyze all data sources and deliver greater performance at each stage of the analytical data life cycle.
In most cases, the data warehouse is the cornerstone. It has been maintained over the years to house many data sources for analytics. The investment into the data warehouse continues to be a focus since it provides data for a number of downstream applications for these organizations. There are no intentions to abandon the data warehouse because it plays a critical part of the information system. Integrating in-database processing would be an obvious investment to improve performance by applying analytics to the data directly. In-database processing may not be possible for all your needs, but it can definitely augment the data preparation and analytics.
As mentioned earlier, 46 percent of the users of Hadoop complement it with a data warehouse, and it is often an extension to capture various semi-structured data sources. However, the two customer successes in this chapter use Hadoop for data staging and data landing. All of these Hadoop options help to offset the performance of the data warehouse. Although Hadoop is open source but also an ecosystem, there is some investment for software and hardware. In addition, if you are integrating Hadoop to other systems, it will require additional resources that are familiar with Hadoop to develop and maintain the programming. Since it is open source, there is no user interface to Hadoop. However, there are many software vendors in the marketplace that integrate with Hadoop and provide a user interface to Hadoop.
The investment for in-memory analytics revolves around data exploration and model development capabilities. There are some vertical solutions, mainly in the financial and retail industries. Customers tend to leverage in-memory analytics for high-volume model development and data exploration. When investing in in-memory analytics, it should be integrated with the enterprise data warehouse and/or Hadoop systems so that data can simply be lifted into memory for analysis. If it is not integrated, then you will need additional investment in resources to develop the integration protocol. Not only could this integration development be expensive, it could be time consuming to implement, maintain, and train the users.
Finally, you should carefully evaluate vendors that can provide end-to-end capabilities so that you can simply leverage their software, hardware, and consulting services in a bundle package. It will streamline the number of contracts, vendors, and support that you will have to deal with and can speed up the implementation of the systems if you are on a tight deadline. Vendors that offer this type of bundle tend to be leaders in their respective markets—analytics and data management. Integration between analytics and data management provides optimal performance, economics, and governance.
The next chapter will cover the future of analytics and data management. It provides the top five trends that customers are considering for their organizations based on some of the market trends and the ever-changing dynamics of technology.