
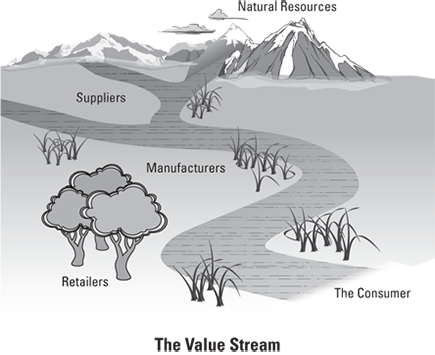
Figure 7-1: The value stream: Each contributor adds value as products “flow” to the consumer.
Chapter 7
You Are Here: Mapping the Current State
In This Chapter
![]() Introducing the value stream
Introducing the value stream
![]() Understanding the purpose and importance of value-stream maps
Understanding the purpose and importance of value-stream maps
![]() Building and validating a current-state value-stream map
Building and validating a current-state value-stream map
![]() Setting the stage for analyzing and improving your processes
Setting the stage for analyzing and improving your processes
Ultimately, all organizations are defined by what they produce. Not only do the most successful organizations produce goods and services that are highly valued by customers or consumers, but they also produce them in a manner that sustains the organization’s viability over the long term. In the Lean enterprise, these capabilities are not an accident. They’re the result of a very conscious awareness that every activity is really a process that adds some amount of measurable value.
Even more, these organizations understand and capitalize on how all of their processes work together to provide value to their customers and consumers. Think of materials and information flowing through a series of connected processes that ultimately deliver a product or service to a customer. Lean organizations call this the value stream. And a value-stream map (VSM) is the graphical representation of the value stream. The value-stream map has an enterprise focus, instead of a functional focus, because it covers all the activities required deliver value to the customer. It depicts all the steps and highlights any ineffectiveness in the value stream. As a Lean practitioner, you will use value-stream maps to visualize three different “states” of your processes: your current state — the way things are now; the ideal state — the way things would work in the ideal case where all work is only value-added; and the next future state — the state of your processes after your next improvement effort (more on the ideal and next future states in Chapter 8).
In this chapter, you learn more about the value stream. You also learn how to look at your value stream from a macro and micro level. You also see how to create, use, and validate the current state value-stream map.
Introducing the Value Stream
If you’ve ever stood alongside a stream and watched the water flow, you probably noticed how the water runs and how the current changes. When there are no obstructions, and the volume is just right, the water moves freely and easily. But of course most streams have disturbances. Sticks, rocks, and fallen trees dam and disturb the flow. If there has been a storm, all sorts of debris drifts downstream. Where there are rocks, white water appears. Too much or too little water for the size of the riverbed, and there’s more whitewater.
If you liken the stream to a process, the ideal condition is when the process flows unobstructed, like smooth, even water. The sticks and stones in a process are things like variances, defects, inventories, rework, and other forms of waste — the non-value-added activities that block the flow of the product to the customer. Strive to remove the debris and smooth out the flow.
Visualizing the value stream
The term value stream is used in Lean as the basis for describing how all activities line up and work together to produce a given product or service. The activities combine to form a process of value creation. The process flow consists of activities that are both value-added and non-value-added (see Chapter 6).
The stream is always viewed from the customer’s perspective, ideally from the ultimate customer’s (the consumer) perspective. In viewing the value stream, you start where the stream ends, with the consumer’s view, and you track it all the way upstream to the smallest tributary — the sources of raw materials and labor. Figure 7-1 depicts a product value stream.
For any product or service, it takes many activities and different types of materials and people all contributing together to make it happen. Organizations bring together materials — sometimes from all over the world — to make products. Likewise, many services are global. As consumers, we experience the final product or what’s called “the last mile” because we’re at the mouth of the stream, but a lot is going on upriver!
Think for a moment about all the things that have to happen for UPS or FedEx to deliver a parcel overnight. Consider all the events that must be coordinated perfectly and must occur at precisely the right time in the value stream to deliver that parcel to the right address, on time, and in perfect condition. Sorting and handling, trucks, airplanes, tracking information — a staggering degree of logistical sophistication.
Now, visualize something different: the value stream required to deliver a new automobile to the showroom. Literally tens of thousands of parts must arrive on the manufacturing line — in the right order, of the right quality, in the right color, with the right orientation — for assembly to the right vehicle.
A value stream manager (see Chapter 14) oversees the value stream, but everyone in the organization has a role in the value stream, and each has the responsibility to know how their part interrelates to deliver value to the customer in the best way. Visualize how each part contributes to the overall value stream through the value-stream map.
The Fundamentals of Value-Stream Maps
A value-stream map (VSM) is a graphical representation of how all the steps in any process line up to produce a product or service. A VSM also depicts the flow of information needed to trigger the process into action. In the product world, the process may be about something physical, like making a mobile phone, or a car, creating a design, or authoring a report. In the service world, the process may be calling a help desk, buying premade food for dinner, or obtaining a driver’s license.
Your initial value-stream map shows the current state — the way things are now and how they currently work.
Map reading 101
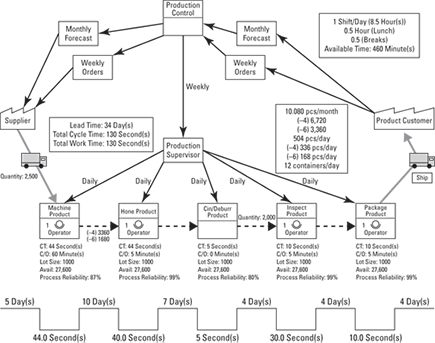
Figure 7-2 shows a typical value-stream map, drawn to standard conventions. If it looks like Greek to you now, don’t worry — just keep reading. We explain everything you see and it will all make sense shortly.
A value-stream map flows from left to right with time — raw materials come in on the left, the process steps line up in order of occurrence, and the finished products or services exit for the customer to the right. The main flow is like the river channel, and the ancillary processes are like tributaries that feed the main process. When constructing a value-stream map, time the process steps — how long does each step take? Also, categorize them as either value-added or non-value-added. So you see that a full value-stream map includes not just the flow of materials, but also the flow of the supporting information.
Figure 7-2: A value-stream map, like this one, is a graphical representation of the value stream.
The purpose of a value-stream map
A value stream map is a powerful tool. It provides information that other process diagrams or activity descriptions don’t.
![]() The VSM always has the customer’s perspective and focuses on delivering to the customer’s expectations, wants, and needs.
The VSM always has the customer’s perspective and focuses on delivering to the customer’s expectations, wants, and needs.
![]() The VSM, in a single view, provides a complete, fact-based, time-series representation of the stream of activities — from beginning to end — required to deliver a product or service to the customer.
The VSM, in a single view, provides a complete, fact-based, time-series representation of the stream of activities — from beginning to end — required to deliver a product or service to the customer.
![]() The VSM provides a common language and common view to analyze the value stream.
The VSM provides a common language and common view to analyze the value stream.
![]() The VSM shows how the information flows to trigger and support those activities.
The VSM shows how the information flows to trigger and support those activities.
![]() The VSM shows you how much of the time your activities are adding customer value — and how much is wasted not adding value.
The VSM shows you how much of the time your activities are adding customer value — and how much is wasted not adding value.
![]() The VSM shows you where your activities add value and where they don’t, enabling you to see what ultimate impedes your ability to supply and satisfy your customer.
The VSM shows you where your activities add value and where they don’t, enabling you to see what ultimate impedes your ability to supply and satisfy your customer.
After you construct the value-stream map, not only do you see the process from the customer’s point of view, but you also see what is required and how long it takes to deliver the product or service to the customer. The VSM shows you the primary activities, as well as the ancillary processes. And the VSM is not limited to the traditional functional perspective — it shows all the contributing activities and processes.
 The customer identified at the end of a value-stream map is not necessarily the end customer or consumer who buys or consumes the final product or service; it’s usually the customer of this process because you often start with a smaller scope for your VSM. It may be another business or even someone or some other function within your own organization.
The people who use a value-stream map
Who uses a VSM? The users are many because it helps everyone involved. Here are some examples of how people in your organization may use the VSM:
![]() Process owners: They own the cost of the process and the value it creates. In a VSM, process owners can quickly identify the opportunities for improvement throughout the whole value stream.
Process owners: They own the cost of the process and the value it creates. In a VSM, process owners can quickly identify the opportunities for improvement throughout the whole value stream.
![]() Process designers: They design and help implement changes to improve processes. They use a VSM to focus on internal process steps and minimize non-value-added activities within and among those process steps.
Process designers: They design and help implement changes to improve processes. They use a VSM to focus on internal process steps and minimize non-value-added activities within and among those process steps.
![]() Process workers: They work within processes and must understand the context of the process and process changes. They see in a VSM where their own process activities are located, and they can quickly identify ways to improve their process.
Process workers: They work within processes and must understand the context of the process and process changes. They see in a VSM where their own process activities are located, and they can quickly identify ways to improve their process.
![]() Supply-chain managers: They must optimize the interfaces with suppliers. They use a VSM to look for opportunities to establish delivery windows, consolidated delivery routes (known in Lean as milk runs), and level schedules, as well as other opportunities to improve the logistics of the value stream.
Supply-chain managers: They must optimize the interfaces with suppliers. They use a VSM to look for opportunities to establish delivery windows, consolidated delivery routes (known in Lean as milk runs), and level schedules, as well as other opportunities to improve the logistics of the value stream.
![]() Procurement managers: They negotiate relationships with suppliers for the long term. In a VSM, procurement managers find opportunities to work with suppliers to receive incoming products and services in a manner that supports the Lean initiatives in the facility. This sometimes includes bringing Lean principles into the supplier community.
Procurement managers: They negotiate relationships with suppliers for the long term. In a VSM, procurement managers find opportunities to work with suppliers to receive incoming products and services in a manner that supports the Lean initiatives in the facility. This sometimes includes bringing Lean principles into the supplier community.
![]() Information technology (IT): They manage the supporting information flow. They see in a VSM where they need to develop systems to support Lean efforts and properly link upstream and downstream systems of the value stream.
Information technology (IT): They manage the supporting information flow. They see in a VSM where they need to develop systems to support Lean efforts and properly link upstream and downstream systems of the value stream.
![]() Value-stream managers: They own the value-stream at an enterprise level. They use a VSM at a high level to guide the organization toward improvement opportunities to serve the customer more effectively.
Value-stream managers: They own the value-stream at an enterprise level. They use a VSM at a high level to guide the organization toward improvement opportunities to serve the customer more effectively.
The elements of a value-stream map
The VSM is a snapshot of the value stream at a specific point in its evolution. It’s a graphical representation of all the steps occurring in a process. In addition, a VSM contains essential, descriptive process information. When constructing a value-stream map, follow these conventions:
![]() Process steps: Show each of the process steps in the value stream, including both value-added (VA) and non-value-added (NVA). Include process statistics like cycle time, NVA time, changeover time, number of operators, number of pieces, amount of inventory, and percent defective.
Process steps: Show each of the process steps in the value stream, including both value-added (VA) and non-value-added (NVA). Include process statistics like cycle time, NVA time, changeover time, number of operators, number of pieces, amount of inventory, and percent defective.
![]() Inventory: Show inventory storage on the VSM, including the amount and movement of inventory within the process.
Inventory: Show inventory storage on the VSM, including the amount and movement of inventory within the process.
![]() Information flow: Show all supporting information required by the process on the VSM. This can include orders, schedules, specifications, kanban signals (a kanban is a signal to replenish inventory in a pull system), shipping information, and more.
Information flow: Show all supporting information required by the process on the VSM. This can include orders, schedules, specifications, kanban signals (a kanban is a signal to replenish inventory in a pull system), shipping information, and more.
![]() Box score: Include a summary of the key operational metrics of the process on the VSM. At a minimum, include a summary of the total lead time of a process with the value-added and non-value-added times identified. You may also include information like the distance traveled, parts per shift, scrap, pieces produced per labor hour, changeover time, inventory turns, uptime, downtime, and more — it’s whatever matters in your business.
Box score: Include a summary of the key operational metrics of the process on the VSM. At a minimum, include a summary of the total lead time of a process with the value-added and non-value-added times identified. You may also include information like the distance traveled, parts per shift, scrap, pieces produced per labor hour, changeover time, inventory turns, uptime, downtime, and more — it’s whatever matters in your business.
![]() Lead time: Along the bottom of the VSM include the current lead time performance of the value stream. Lead time is the amount of time that one piece takes to flow completely through the process. The time is divided into value-added and non-value-added portions. At a glance, you can see where the major portions of non-value-added time occur.
Lead time: Along the bottom of the VSM include the current lead time performance of the value stream. Lead time is the amount of time that one piece takes to flow completely through the process. The time is divided into value-added and non-value-added portions. At a glance, you can see where the major portions of non-value-added time occur.
![]() Takt time: Place a box in the upper-right-hand corner of the VSM to show the customer demand rate or takt time. This rate is determined by the customer demand and production time available. Ideally, all steps in the value stream should then produce to this rate.
Takt time: Place a box in the upper-right-hand corner of the VSM to show the customer demand rate or takt time. This rate is determined by the customer demand and production time available. Ideally, all steps in the value stream should then produce to this rate.
 Teams often find it unwieldy to try to map the whole value stream at a detailed level all at one time, so they start with a smaller scope. Start with your immediate customer and map the stream back to the point where you receive inputs from a supplier. Just don’t lose sight of where in the overall value stream your process fits.
 Pick one product family (a series of products or services that pass through the same processing steps) to map. If the product family is processed at more than one location, for instance an eastern service center and a western service center, then focus on one location, but include representatives from the other location on the improvement team.
Pack Your Bags: What You’ll Need to Get Started
Before you actually make your value-stream map, you will need to do some pre-work — it’s like packing your bag before a trip. You need to make some decisions, get information and go to gemba to observe what’s happening.
Identifying the natural owner
Every value stream has a natural owner who acts as the hub to make it easier to manage the improvement activities. The natural owner is like the captain of the ship — someone who by her very position or role in the organization manages the value stream. The natural owner is normally not a functional boss. This is the value-stream manager if you have one.
If you can’t readily identify the natural owner, find someone with influence or authority who can be assigned the ownership role to drive the Lean improvement initiative. Preferably, find someone who is willing to be a change agent.
Gathering the crew
Begin by gathering the cross-functional team that represents all the disciplines involved in the value stream. Bring them together into a workshop setting. Having all these areas represented in the value-stream map improves the quality of the VSM and facilitates conversation between the team members about the “real” process. The workshop setting creates a focused environment where people are away from the distractions of their day-to-day jobs.
The best workshop location is a balance between one that is away from day-to-day activities, and yet is close enough that the team can physically go look at the action in the value stream. Be sure they can confirm the real process, as opposed to what they think it is.
Outside Lean experts are also a vital part of the initial crew. They train the organization in Lean tools and techniques, guide the development of initial value-stream mapping and facilitate the initial improvement efforts. They also model and help mentor people in how to think and act in a Lean way.
The ideal core team size has five to seven members. Larger teams are unwieldy, and smaller ones are too narrowly focused. You can always bring in support experts when you’re analyzing specific value-stream tributaries. Eventually, you’ll expand the team to include customers and suppliers as you expand your Lean implementation and VSM scope.
Have someone who is not part of the team act as a facilitator to record the value stream. This helps the team to focus on the content, while the facilitator focuses on capturing the value stream.
Using mapping tools
Mapping the value stream can be as simple or as complex as you choose to make it. Whatever method or combination of methods you choose to use, it’s important that all participants — in a group setting — clearly see the value-stream map being created and contribute to its construction. Your options for mapping include the following:
![]() No tech: Paper stuck to the wall, and markers
No tech: Paper stuck to the wall, and markers
![]() Low tech: Templates or preprinted formats
Low tech: Templates or preprinted formats
![]() High tech: Software programs like ARIS, available from SoftwareAG
High tech: Software programs like ARIS, available from SoftwareAG
Even if your plan is to maintain your VSMs in a high-tech tool like ARIS, many Lean practitioners find it more engaging in a team or workshop setting to construct the initial VSMs using “no tech” — paper on the wall with makers or Post-its.
Tools such as ARIS allow you to construct your value-stream maps in layers, which make it easier to visualize parts of the overall process.
When you draw a value-stream map, be sure to follow the conventions for drawing each icon that represents an activity, element, or event. VSM software tools supply these icons automatically. Table 7-1 shows the basic, standard icons used in a VSM. The book Learning to See, by Mike Rother and John Shook, is a good VSM reference manual, which includes instructions and a complete listing of VSM icons.
Table 7-1 Value-Stream Mapping Icons
|
Icon |
Icon Name |
Description |
|
|
Process box |
Describes an activity in the value stream. Includes a title and description of the process, as well as data, like process time, setup time, and so on. |
|
|
Outside source |
Indicates and identifies both customers and suppliers. |
|
|
Truck |
Indicates an outside delivery — either to a customer or from a supplier. |
|
|
Information flow |
Describes information transmitted along the value stream. |
|
|
Electronic information transmission |
Indicates that the information is transmitted electronically. |
|
|
Manual information transmission |
Indicates that the information is transmitted manually. |
|
|
Inventory |
Identifies stored inventory — either raw materials, in process, or finished goods. |
|
|
Finished goods movement |
Indicates when materials in a finished state are moved along the value stream. This can be a supplier moving its product to a company or a company moving its product to its customer. |
|
|
Material push |
Indicates material being pushed through the process. The push is usually a production plan or schedule. |
|
|
Supermarket |
Indicates in-process inventory stored in a controlled environment called a supermarket. |
|
|
Material pull |
Indicates material movement via a pull signal (kanban) |
|
|
Operator |
Indicates that one or more operators are present at a process step. |
|
|
Kaizen burst |
Indicates the need for and description of a kaizen activity within the value stream. |
If you use a software-based VSM tool, you may find that the icons are different from the ones shown in the table. Choose an icon set that is close to these, and agree as a team how they’ll be used going forward.
Gathering supporting information
Capture information about all the process steps at a detailed level. The more detail you have available, the easier it will be for you to uncover the waste —muda, mura, and muri (see Chapters 2 and 3). Each team member has supporting information to enable the value-stream mapping process. The more information you have readily available during the construction of the VSM, the better the resulting value-stream map.
Supporting information needed to build a VSM may include the following:
![]() The end consumer’s requirements and expectations
The end consumer’s requirements and expectations
![]() Kano models and other customer (consumer) information
Kano models and other customer (consumer) information
![]() A macro-level view of the entire value stream from the consumer all the way back through to raw materials and information
A macro-level view of the entire value stream from the consumer all the way back through to raw materials and information
![]() Customer schedules and demand information
Customer schedules and demand information
![]() Process-time studies, including
Process-time studies, including
• Cycle time (C/T)
• Lead times
• Number of operators
• Changeover time (C/O)
• Working time, less breaks
• Photos and video of the operations in their current state
![]() Standard work instructions
Standard work instructions
![]() Quality information
Quality information
![]() Equipment uptime and availability
Equipment uptime and availability
![]() Product and process variations
Product and process variations
![]() Inventory and work-in-process (WIP)
Inventory and work-in-process (WIP)
![]() Batch or queue sizes
Batch or queue sizes
![]() Pack quantities and other shipping information
Pack quantities and other shipping information
![]() Cost data
Cost data
![]() Any other information that will help you characterize the process
Any other information that will help you characterize the process
The best way to understand a process is to go to it and watch it yourself for a significant length of time — go to gemba. If you can, video-record the operations. The video will give you an objective perspective — you’ll notice things you don’t normally see when you concentrate on a specific part of the process over many cycles. People can watch themselves to see what they really do, instead of what they think they do.
Premade gourmet salads: A value stream case study
Imagine that you’re on your lunch break or heading home after working out at the gym. You’re hungry and you want something quick to eat. You don’t feel like cooking and you don’t have time for a restaurant. So you pop in to your local grocery and grab a premade, gourmet salad from the deli case.
You expect the salad to be fresh and flavorful. Because you’re paying a premium, you expect a gourmet offering of high-quality ingredients, uniquely combined and pleasingly presented. You expect to pay a reasonable price. You want a variety to choose from. And you may be delighted if you tried a salad that then became your new favorite.
Have you ever stopped to think about all the things that have to happen in order to bring that fresh, flavorful salad to you? It seems simple enough — not much more than lettuce, toppings, and a bowl. That doesn’t sound too difficult, right? But when you look at it closely, there’s much more to it than what you see on the surface.
What’s happening behind the scenes? What are all the pieces, who are all the people, and how is it all coming together just right? How much of all the effort, activity, time, materials, and cost involved actually adds value to you, the customer? How consistent is it? Businesses who take the time to map and improve their processes can execute a process like this consistently and effectively thousands of times a day to satisfy discerning customers like you.
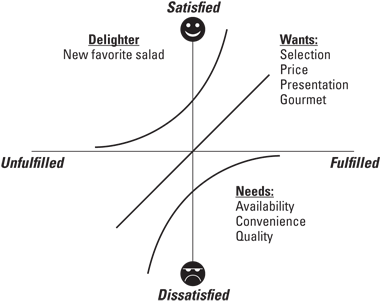
If you were on the team analyzing the salad-making process, you would first look at the value stream from the consumer’s point of view; in this case, that’s the hungry person. Her requirements are indicated in Figure 7-3 via a Kano model.
Figure 7-3: A Kano model of the customer’s requirements for a gourmet salad to go.
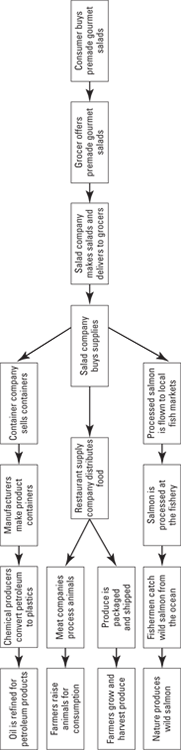
Next you would map out the high-level flow of all the process steps that must occur across the entire value stream in order to meet the consumer’s requirements and expectations. This high-level view is called the macro-level value stream diagram, and it’s used to capture the big picture and to set the context within which the provider understands how it must operate.
Figure 7-4 shows the macro-level value stream diagram for the salad production process. It starts with the consumer and ends where nature produces wild salmon. This simple chart encompasses a global supply stream — so global that, when taken from its first tributary, raw materials, all the way through to the consumer, it takes years to complete. All for a salad!
Contained within each box in Figure 7-4 are multiple individual processes and different companies that support the overall value stream. By first depicting the value stream at this high level, you can see where the salad company fits into the picture.
Understanding how your part fits into the overall value stream and how you contribute to the consumer’s demands is important. Start by creating a macro-level value-stream diagram that shows your contribution to the overall value stream.
 You don’t need to map everything shown on this macro-level diagram! Start at the level of your contribution, and refine the detail or expand the scope as you dive into the value stream. The waste-devil is in those details — that’s where you’ll uncover muda.
We use this salad company example though the following sections, as we show you how to develop and validate the current-state value-stream map.
Figure 7-4: Macro-level value-stream diagram for salad example.
Hitting the Road: Creating the Current-State Value-Stream Map
After you’ve identified the captain, assembled the crew of players and participants, and gathered the critical data about your processes, you’re ready to create your current-state value-stream map. Begin by capturing how your process works now — before any improvement efforts have started. From this initial VSM, you’ll begin to understand where you are and where the waste is in the process. Before you start to construct the VSM, it’s a good idea to go to gemba (go to where the action is, and review the process as it happens every day). This will give everyone a common starting point of reference.
Always construct your VSMs from right to left to maintain your customer focus. Start at the end closest to the customer and record the process working your way to the beginning of the value stream. You’ll see what is happening the farther away from the customer you travel.
Identifying the activities
Begin by titling the current-state VSM, dating it, and identifying the major process steps.
Most teams start with the part of the value stream that they own. After you’ve identified the major process steps, you can use your supporting information to more precisely characterize each step.
In the salad example, the company owns the part of the value stream where the salads are made and delivered to the grocer. With the participation of the cross-functional team, divide this process into its major process activities. This team includes the owner, the lead chef, the sous chef, the driver, the kitchen hand, and an outside observer. The salad company recognizes that it conducts five major process activities. For each salad, these activities are:
![]() Preparing ingredients
Preparing ingredients
![]() Assembling the salad
Assembling the salad
![]() Labeling the container
Labeling the container
![]() Packing the container
Packing the container
![]() Shipping to the grocer
Shipping to the grocer
Start at the right side of the map with the customer. You may choose to show the immediate customer as well as the consumer. For any outside player — including the consumer, customer, supplier, or any other source — use the outside source icon.
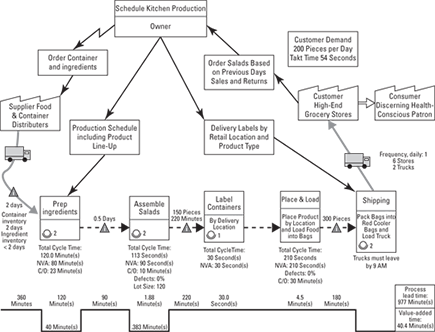
Along the bottom, from right to left, are the steps in the process of your part of the value stream. The step on the right side is the final step before you deliver the product or service to the customer. The leftmost step is the first step in your process. In the case of the salad company, Figure 7-5 shows the current-state VSM where the operation on the left side of the value stream is “Prep Ingredients” and the final process, on the right side, is “Shipping.”
After you lay out the process steps, connect them with the appropriate connector: Use dashed arrows to indicate material pushed through the system. Use open arrows are for material movement to or from external sources. Indicate where you store inventory in the process — beginning, work-in-process, or end. Use icons for regular inventory, buffer stock, supermarkets, safety stock, and queues. Clearly identify what type of inventory is in process, in addition to the amount of inventory at each location.
Take your first pass through the VSM at a relatively high level. After you characterize the value stream at this level, you can choose an area of focus, and map that at a greater level of detail. The process for creating any map, though, is the same.
Beware of the dangers of mapping paralysis. Don’t get caught up in making the VSM so complete and perfect that you don’t proceed to the improvement stage. Make your initial best cut, validate, and move on. You’ll have plenty of opportunities to come back and improve your VSM later.
Figure 7-5: The current-state value-stream map for the salad company’s contribution to the overall value stream.
Qualifying and quantifying
After you’ve captured the current-state VSM, it’s time to quantify the process and qualify the value-added (VA) and non-value-added (NVA) activities. Cycle time, changeover time, inventory levels, and the number of operators are all types of information you’ll use to understand and analyze the process.
Characterizing the process time
When considering process time, there are a number of angles. Use your supporting data and information from gemba to answer these questions. For each step in the value stream, evaluate the step by asking the following types of questions:
![]() What is the actual time required to perform the task identified in the process step?
What is the actual time required to perform the task identified in the process step?
![]() What is the waiting time before each step?
What is the waiting time before each step?
![]() If inventory is involved, how long does it take to deplete it?
If inventory is involved, how long does it take to deplete it?
![]() What is the transport or conveyance time?
What is the transport or conveyance time?
![]() What is the inventory between the last operation and the consumer?
What is the inventory between the last operation and the consumer?
![]() How many operators are active at each process step?
How many operators are active at each process step?
![]() How long does it take to change over a process when changing product types?
How long does it take to change over a process when changing product types?
The VSM is a snapshot in time. Use the best data you have available to get the job done. It’s OK to estimate some of the times at first; you can validate the estimates later with actual data.
With your answers, you can assign a time value for each process step. After characterizing the entire process, sum the individual times to arrive at an overall process time for the value-stream map. If you’re using a software package, the overall calculation will be done for you, based on the information you enter about each process step.
When the value stream has parallel processes that come together, one stream represents the longest lead time from the beginning of the process (the raw-material stage) through to the product reaching the consumer. This is known as the critical path. Identify the critical path on the value-stream map. Any waste eliminated from the critical path flow will positively impact the productivity to the consumer.
Deciding what is value-added and what is non-value-added
Further evaluate each process step by dividing the overall process time into value-added (VA) and the dreaded non-value-added (NVA) activities.
To be value-added, an activity must meet all three of the VA criteria:
![]() The customer must be willing to pay for it.
The customer must be willing to pay for it.
![]() It must transform the product or service in some way.
It must transform the product or service in some way.
![]() It must be done correctly the first time.
It must be done correctly the first time.
Anything that doesn’t meet these three criteria is NVA and is, therefore, a waste of some type.
There are two types of non-value-added steps (defined in Chapter 6):
![]() Type-1 muda: Non-value-added but necessary.
Type-1 muda: Non-value-added but necessary.
![]() Type-2 muda: Non-value-added and not necessary.
Type-2 muda: Non-value-added and not necessary.
Designate each step as VA or NVA. For the NVA, note the type: T1 or T2. This information will be handy when you start to identify improvement opportunities.
In the salad example, only those steps that directly contribute to the finished salad are value-added. For example, cutting the lettuce, baking the chicken, slicing the chicken, putting the ingredients in the container — these are all VA. These steps, however, are buried in the macro process steps “Prep Ingredients” and “Assemble Salads.”
In the salad company example, placing labels on the top and bottom of the container is considered type-1 muda. The labels do not directly contribute to the customer receiving her salad, but they are required for the scanning and payment processes at the grocery store. Another example of type-1 muda is the weighing of the ingredients during the assembly process. The act of weighing adds nothing to the transformation of the salad, but it does ensure the quality and consistency of the product. Examples of type-2 muda are trips back and forth to the cooler for forgotten items or disposing ingredients that are still good.
When the process owner maps the process along with an outside observer, typically she has an idealized perception of the process. However, when an outside observer goes to gemba to observe the process with the process owner or team, the findings are often eye opening for all involved. (“Holy cow! Do we really do that?”)
Quantifying overall lead time
Lead time is the amount of time it takes one piece to flow though the process from start to finish, including process time, inventory time, waiting time, and so on. In the case of the salad example, it’s the time from when the shipment of produce arrives until it’s transformed into a shipped salad. In the case of a service, it’s the time from when you arrive at the doctor’s office until you receive treatment and complete the checkout process. Within the lead time are value-added and non-value-added activities. A detailed time-study analysis will help you to identify these activities — so bring your stop watch to gemba.
On the VSM, draw a line along the bottom of the map to represent the overall lead-time for the product or service. The line is segmented according to the lead time of each major step in the process. Where value-added work is done, you can record it below the overall lead time line, to visually see the difference between the lead time and value-added time. (See Figure 7-5 for an example.) You may be shocked at what you find — lots of NVA and little bitty amounts of VA. If you use a software package, like ARIS, it automatically generates the line for you based on the data you provide.
Determining the information flow
Every process requires information to support or direct the transformational activities. This information flow might include any instructions, orders, or messages that occur through the course of the process. Information flow may also include schedules, orders, shipping transmittals, approvals, and more — whatever you need to support and communicate within the process.
Just like in the rest of the process, you want your information flow to be value-added. The right information arriving at the right time, in the right manner, to the right recipients is the information flow. When the information does not flow, it creates waste in other areas. Because the information flow is so critical to the timely and effective execution of the process, you include it directly on the value-stream map. This is a unique feature of the value-stream map. Initially, consider the location, quantity, and frequency of the information flow, using penetrating questions like these:
![]() What information is being transmitted?
What information is being transmitted?
![]() When is information being sent?
When is information being sent?
![]() Who receives the information and are they the right people to receive the information?
Who receives the information and are they the right people to receive the information?
![]() Where in the value stream does the information transmittal occur?
Where in the value stream does the information transmittal occur?
![]() How is the information being sent — manually or electronically?
How is the information being sent — manually or electronically?
Start with the information that is vital for the value stream to function. You can always add additional information flows to the VSM later. Place the vital information flow on the VSM at the proper location. Indicate information flow using the rectangular information box. Remember that there are two information arrows. Manual transmissions use a straight arrow, and electronic transmissions use a jagged arrow that resembles a lightening bolt. (See Figure 7-5 for an example.)
In the salad example, information flow includes such items as the daily customer order, the production schedule, the order to the suppliers, and the order list for each customer location. Other examples of information flow along the entire value stream include:
![]() The grocery sends orders to the salad company.
The grocery sends orders to the salad company.
![]() Production sheets schedule the kitchen assembly process.
Production sheets schedule the kitchen assembly process.
![]() The salad company sends orders to distributors for the ingredients needed and delivery times required.
The salad company sends orders to distributors for the ingredients needed and delivery times required.
![]() The salad company sends orders to container suppliers.
The salad company sends orders to container suppliers.
![]() Distributors send orders to the growers.
Distributors send orders to the growers.
![]() Customs brokers file papers to import produce from other countries.
Customs brokers file papers to import produce from other countries.
![]() Suppliers send delivery receipts with produce orders.
Suppliers send delivery receipts with produce orders.
![]() The grocery fills out product return sheets and sends these sheets back to the salad company with products that did not sell before the expiration date.
The grocery fills out product return sheets and sends these sheets back to the salad company with products that did not sell before the expiration date.
Summing Up the Process
After you develop the initial current-state value-stream map, summarize the key descriptive process statistics and place them in a summary chart directly on the map.
The graphic for this is the box score. Think of a box score in sports, like baseball — it contains important statistics on players, the score, hits, errors, runs, and so on. The concept of the box score in Lean is similar.
The box score
The box score is a summary of the critical statistics of a process. At the very least, the box score usually includes the total lead time and the value-added and non-value-added time. If the process includes the physical movement of an object, then travel distance is also normally included. Physical movement refers to any object that is transformed as it literally moves through the process. Typically, transformation is thought of as a manufacturing process; however, transformation also happens in transactional processes. An example of a transformation in an office setting includes the completion of paperwork through several departments of a process.
Box-score contents
The box score contains the summary chart of the key process metrics. You often want to contrast the measured scores against an ideal state, where all process steps are only value-added. (More about the ideal state in Chapter 8.)
In the salad company example, its initial box score includes its portion of the value stream — from receipt of ingredients to shipment of the finished salads. The box score is shown in Table 7-2.
Table 7-2 The Salad Company’s Box Score
|
Metric |
Current State |
Ideal State |
|
Total average VA time |
40.4 minutes |
40.4 minutes |
|
Total average NVA time |
746.6 minutes |
0 minutes |
|
Total average lead time |
787 minutes |
40.4 minutes |
|
Changeover time, between types |
10 minutes |
1 minutes |
|
Actual cycle time |
113 seconds |
54 seconds |
|
Takt time, seconds. |
54 seconds |
54 seconds |
In the future, the salad company may need to track other metrics to address other types of waste in its value stream. Some of these metrics may include inventory turns, the value of lost ingredients due to waste or expiration, the number of unsold salads versus shipped salads, or salads as shipped versus salad as priced. As the company dives deeper into the value stream, it will select the measurements that will best gauge improvement efforts.
Additional metrics for a box score
The following are some of the other common metrics that companies may include in their box score:
![]() Parts per shift: Parts produced during a standard work shift. In a service example, this could be customers serviced per day.
Parts per shift: Parts produced during a standard work shift. In a service example, this could be customers serviced per day.
![]() Scrap: The percentage of defective parts produced.
Scrap: The percentage of defective parts produced.
![]() Pieces per labor hour: The total number of piece produced divided by the amount of labor hours expended. In a call center setting, this could be calls per hour considering all of the service representatives available.
Pieces per labor hour: The total number of piece produced divided by the amount of labor hours expended. In a call center setting, this could be calls per hour considering all of the service representatives available.
![]() Change over time: The amount of time required to convert a manufacturing line from the last good part of the previous product to the first good part of the new product. In a surgery facility, this could be the time to change over operating rooms between surgeries.
Change over time: The amount of time required to convert a manufacturing line from the last good part of the previous product to the first good part of the new product. In a surgery facility, this could be the time to change over operating rooms between surgeries.
![]() Inventory turns: The number of times a company’s inventory cycles in a year (Inventory Turns = Average Annual Cost of Goods Sold ÷ Average Annual Inventory).
Inventory turns: The number of times a company’s inventory cycles in a year (Inventory Turns = Average Annual Cost of Goods Sold ÷ Average Annual Inventory).
![]() Uptime: The amount of time the equipment is actually producing versus the planned production time.
Uptime: The amount of time the equipment is actually producing versus the planned production time.
![]() Cost breakdown: An evaluation of the cost components at each step of the process.
Cost breakdown: An evaluation of the cost components at each step of the process.
Takt time
Takt is the German word for “beat.” In Lean, it is the pace of production tied to customer consumption. Show the takt time in the box score or as a note on the VSM. The formula is Takt Time = Available Production Time ÷ Customer Demand.
The salad company uses its kitchen to support other value streams. For the premade salads distributed to local groceries, the available production time is 3 hours (or 10,800 seconds [3 × 60 × 60]), and the customer demand is 200 salads per day (on average). So the takt time is 10,800 ÷ 200, or 54 seconds per salad.
Check the Chart: Validating the Value-Stream Map
Have you ever driven the same route to work or home but not really seen what you were driving past? Then, one day, you notice a restaurant or business that has been there for years. You’ve passed it hundreds of times, but for whatever reason, on that day you noticed it for the first time.
The same thing can happen to members of a team with respect to the value stream where they work. You can walk by a process or an office but not really “see” what’s happening. When the team is capturing the first VSM, it’s important that there be a common starting point — that all the members “see” the same thing.
Although perfection is not a requirement, you do want the baseline starting point to be as accurate as possible. Real improvements happen from a common leaping point. Maybe the team thinks that standardized work is in place, when it’s really not. Or maybe the team assumes one step is in a different place than it really occurs. Information that one team member believes is important to be distributed may not be getting to the “right” people, or it may not be so important after all. In any case, you have to validate your VSM before you proceed to the improvement phase of the game.
Although the team members might think they know what’s going on in the value stream, the only way to truly know is to go to gemba (go to where the action is happening). It’s one thing to walk by the process — it’s a totally different thing to observe with intention. When you stand and observe the process over a repeated number of cycles, you open your eyes to what is really occurring.
The key things that you’re validating are:
![]() Whether the process depicted on the value-stream map is, in fact, the process
Whether the process depicted on the value-stream map is, in fact, the process
![]() Whether the process time is correct (particularly if you use estimates)
Whether the process time is correct (particularly if you use estimates)
![]() Whether the inventory amounts are accurate
Whether the inventory amounts are accurate
![]() Whether the number of operators is correct
Whether the number of operators is correct
![]() Whether the process is performed according to a standard instruction
Whether the process is performed according to a standard instruction
![]() Whether the key process statistics are correct
Whether the key process statistics are correct
![]() Whether all operators are performing the activities in the same manner
Whether all operators are performing the activities in the same manner
![]() The number of process changeovers that are performed and how long they take
The number of process changeovers that are performed and how long they take
![]() The accuracy of the quality data, and the identification of where the defects are occurring in the process
The accuracy of the quality data, and the identification of where the defects are occurring in the process
If your facility has multiple shifts, it is important to validate the VSM across all shifts. Often you will find the operators perform their jobs differently on different shifts.
Work with your core team to construct the current-state VSM. Involve experts to assist you with portions of the VSM. Not every person is going to know every nuance of every process. Seek out experts who truly know what’s going on.
After you’ve identified the discrepancies, the team can update and correct the current-state VSM. The team may also decide that it needs to further refine an activity and map it.
Detail is important. You may start with a higher-level view of the value stream. As the improvement efforts progress, you may take one of those steps and create a more detailed value-stream map for that step. The more detail that is available, the easier it is to uncover waste.
..................Content has been hidden....................
You can't read the all page of ebook, please click here login for view all page.