
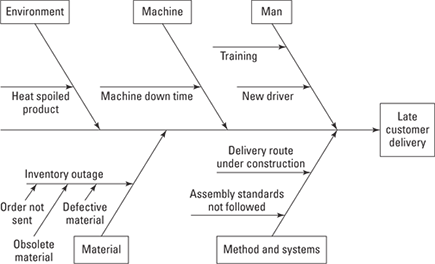
Figure 8-1: An Ishikawa diagram, like the one shown here, is a tool you can use to analyze of customer complaints or process problems
Chapter 8
Charting the Course: Using Value-Stream Maps
In This Chapter
![]() Analyzing the current-state value-stream map
Analyzing the current-state value-stream map
![]() Creating the ideal-state vision of the future
Creating the ideal-state vision of the future
![]() Planning the next future state
Planning the next future state
To make a change, you need a catalyst. In Lean, that catalyst is the recognition that the current state is not where you want to be. Lean is applicable whether you need to fix something that’s broken or prepare for new opportunities to come. So like that “fat picture” that sends you to the gym and juice bar to get healthy, the current-state value-stream map (VSM) and supporting information — like quality data, customer complaints, or financial reports — provide objective reflection that motivates an organization to modify its processes and practices and helps the business regain its health and vitality.
When you decide to make a change, not only do you plan where you’re going to go, but you also consider where you could go. You ask what’s possible. For example, when you decide to get healthy, does healthy just mean weighing less? It may also mean better cardio performance, improved flexibility, lower cholesterol, a smaller clothing size, or living one hundred years. In a perfect world, what would a perfectly healthy you look like? The thought process is the same when you decide to make changes in your business. In Lean, use the ideal-state VSM to define that perfect world — what your business would look like if anything were possible. You then use the future-state VSM to identify the next right step to move you toward that goal.
In your life, you may have several initiatives going at the same time to help you get healthy — a new diet, gym membership, recreational change, and nutritional supplements. Similarly, your business may have several initiatives going to get it healthy. Understanding and communicating how all these initiatives fit together in the process of moving toward improved business performance is important to engage and lead the organization.
In this chapter, we show you how to analyze your current-state VSM to get a real picture of the process. You discover how to develop the ideal- and future-state VSM. Along the way, we answer common questions and respond to common objections about value-stream mapping. Finally, you determine how your future plans fit with other organizational initiatives.
Investigating the Value-Stream for Clues
In Chapter 7, we show you how to create a value-stream map (VSM) for the current state of the business. After this initial current-state VSM is complete, your next mission is to dive into it and understand where you have waste. You first start looking for waste when you qualify the process steps in the stream as value-added and non-value-added. At this point in the process, you look for where your value stream isn’t flowing.
The current-state VSM, combined with the use of the supporting data, provides the clues where to start looking for improvement opportunities. In Lean, strive to have the entire value stream flowing unencumbered at a rate equal to the customer’s demand in the most effective manner (that is, with the highest quality, the shortest lead time, and the lowest cost). You can quantify this customer demand by looking at the demand rate, or takt time. By using this metric, you can start to see where blockages to the flow are occurring in the current state. The blockages are evidence of muda. You improve performance by resolving and removing the root cause of these blockages.
 It is important to define the true root cause of the problem so you do not waste precious resources solving a symptom rather than the problem.
 The Lean process is one of seeking understanding. To understand the true nature of your processes and the origins of waste and loss ask questions — many questions — to discover truth and understanding. When you develop your skill to ask powerful questions, you will engage people, improve the quality of analysis and find better solutions.
Rounding up the usual suspects
As you begin your analysis of the current-state VSM, start by considering the most common causes. Look first to your customer. What are their complaints, praise, returns, and actions? Even if the customer voices issues that aren’t at the root of the problem, they may give you clues as to what the issue truly is. If you aren’t getting any indications from the customer, start looking for evidence of the three Ms: muda, mura, and muri.
While conducting the current stream analysis with the team, mark up a copy or plot of the current-state VSM. Use the low-tech, pencil-and-paper method, with a different color or sticky notes to indicate where in the value stream the improvement opportunities are.
Putting your ear to the street
As you hear feedback, examine the issues and relate them to where they occur in the value stream. For example, are your customers complaining about not getting your product when they want it? Look at the critical path to delivery. Are they complaining about not getting the right mix of product? Examine the material flow and information flow. Are they concerned about the quality of your product? Study the design and manufacturing processes. And if you’re lucky and your customers are all singing your praises, you may need to make room for new business.
 Also identify what you are doing right, so you don’t accidentally change your process and eliminate something that your customer values.
An effective tool for analyzing potential causes of customer issues is the Ishikawa diagram, also known as the Cause-and-Effect or Fishbone diagram (see Chapter 12). With this tool, you can identify where in the value stream the issues originate. Figure 8-1 shows an example of an Ishikawa diagram for our salad company where the issue was late product arrival.
Examine the many possible causes for the delays. Use your supporting information to help you identify the most likely root causes of the delays, and to quantify how late “late” really is. Is the complaint a recent development or has there been a chronic problem? Look in the value stream to find the operations that are sources for the major issues. Ask these types of questions to identify issues in the value stream that are directly affecting the customers:
![]() Are the operations running slower than takt time?
Are the operations running slower than takt time?
![]() Are the operations running faster than takt time?
Are the operations running faster than takt time?
![]() Are there deviations to the work standards?
Are there deviations to the work standards?
![]() Is the product not available for shipment?
Is the product not available for shipment?
![]() Have there been material supply issues?
Have there been material supply issues?
![]() Are the drivers leaving late from the facility?
Are the drivers leaving late from the facility?
![]() Have there been any personnel changes?
Have there been any personnel changes?
![]() Have the employees been trained and demonstrate proficiency safely?
Have the employees been trained and demonstrate proficiency safely?
Focus on fixing the process, not assigning blame. Lean is all about respecting people. Most of the time, you will find a process problem (like a lack of defined standards) preventing people from performing at their best.
Use the 5 Whys (see Chapter 12). The aim of the 5 Whys is to find the root cause of a problem. When using 5-Why questioning, ask “Why?” until you’ve exhausted answers and found the root cause of the problem. The number 5 is arbitrary; ask why until you discover the true root cause. Practicing 5 Whys is like becoming a curious three-year-old again, when the question “But why?” was the first thing out of your mouth. Here’s what this technique looks like in action:
Are the drivers leaving late from the facility?
Yes. But why?
Because the product isn’t ready. Why?
Because the production line was behind. Why?
Because the preparation was not done the day before. Why?
Because ingredients were missing. Why?
Because the supplier was behind. Why?
Because the order was issued late. Why?
You get the idea. In this example, these whys would lead you to look at the ordering process and information flow.
Searching for the culprits
You’ve seen your business through the eyes of your customer and examined the direct causes of customer dissatisfaction. Now you must look within, and find causes of waste occurring inside your business. During the first pass through the current-state VSM, you initially designate process steps as value-added (VA) or non-value-added (NVA). Now it’s time to examine these designations more closely.
Refer to Chapter 2 for the precise definitions of value-added and waste.
Lean strives to eliminate all forms of waste. Begin with type-2 muda, and ask the following types of questions:
![]() Does the step create value? If not, why does the step exist in the process and what can be eliminated?
Does the step create value? If not, why does the step exist in the process and what can be eliminated?
![]() Is excess inventory or work in process accumulating along the value stream? (This may be physical product or in a service world, people or paper.)
Is excess inventory or work in process accumulating along the value stream? (This may be physical product or in a service world, people or paper.)
![]() Does the step create scrap or rejects? If so, it’s a candidate for improvement and, at the very least, further study.
Does the step create scrap or rejects? If so, it’s a candidate for improvement and, at the very least, further study.
![]() Is the step capable? If not, the step should be improved using statistical tools, like those found in the Six Sigma methodology. (For more information on Six Sigma, see Six Sigma For Dummies, by Craig Gygi, Neil DeCarlo, and Bruce Williams [published by Wiley])
Is the step capable? If not, the step should be improved using statistical tools, like those found in the Six Sigma methodology. (For more information on Six Sigma, see Six Sigma For Dummies, by Craig Gygi, Neil DeCarlo, and Bruce Williams [published by Wiley])
![]() Does the step perform as designed — to the standard?
Does the step perform as designed — to the standard?
![]() Is the equipment needed to perform the step functioning and available?
Is the equipment needed to perform the step functioning and available?
![]() Are the materials required available, at the right quality level, and in the right quantity?
Are the materials required available, at the right quality level, and in the right quantity?
![]() What is the capacity of the process step? How does it compare to the takt time?
What is the capacity of the process step? How does it compare to the takt time?
![]() Are people waiting for work?
Are people waiting for work?
![]() When changing from one product or service to the next, how long is the process step not producing? (This question relates to changeover (C/O) time.)
When changing from one product or service to the next, how long is the process step not producing? (This question relates to changeover (C/O) time.)
![]() Does the process step flow or does it cause a bottleneck in the process?
Does the process step flow or does it cause a bottleneck in the process?
![]() How does the process time of the step compare to the customer demand?
How does the process time of the step compare to the customer demand?
Anytime you use re– in front of a word, it is a candidate for waste elimination, because, by its very definition, it means you aren’t doing it right the first time.
Get a physical layout of the work areas, and create a two-dimensional flow diagram that reflects the physical movement of material or people through the process. This technique is especially useful in manufacturing processes, lab processes, restaurant kitchens, and other places where physical material moves through processes and places. It also applies to the movement of data or information between people and among systems. These layouts are commonly known as spaghetti diagrams (see Chapter10) because after all the movements are drawn out, it tends to look like a plate of spaghetti!
Analyzing from different perspectives
Different players in the value stream bring a different set of eyes and information to the evaluation of the current-state VSM. Whether you’re improving an unhealthy business practice or enabling the pursuit of a new opportunity, take the time to examine the value stream through different perspectives. As you strive to find waste, these different views can be invaluable sources of insight.
The VSM team will involve people working in the process who have a daily operational perspective. This will include process owners, including the value-stream owner, and perhaps even the business owner. In addition to these participants, others have a keenly valuable perspective.
Examples in the following sections are oriented more towards the production of a physical product, but they have analogies in the transactional and information worlds.
Lean principles: The Lean sensei’s view
The Lean sensei is the master and teacher of the Lean principles and knowledge. (For more information about the Lean sensei see Chapter 5.) The Lean sensei guides and teaches the organization to learn, implement, and embody the Lean philosophy. The lens through which the sensei evaluates the current-state VSM highlights the short-term and long-term opportunities to institutionalize Lean in the organization. The Lean sensei poses these types of questions:
![]() How closely is the process producing to takt time?
How closely is the process producing to takt time?
![]() How can the process be more visual?
How can the process be more visual?
![]() What will motivate the workers stop the line immediately when quality or other issues arise?
What will motivate the workers stop the line immediately when quality or other issues arise?
![]() How is the material and information flowing through the process?
How is the material and information flowing through the process?
![]() Where best can continuous flow be implemented?
Where best can continuous flow be implemented?
![]() Where do supermarkets need to be implemented?
Where do supermarkets need to be implemented?
![]() Are standardized work instructions available, being followed, and visible?
Are standardized work instructions available, being followed, and visible?
![]() How can the workload be leveled?
How can the workload be leveled?
![]() Where can operations be combined to improve flow?
Where can operations be combined to improve flow?
![]() How effectively are the managers leading problem solving and building capability in their people?
How effectively are the managers leading problem solving and building capability in their people?
![]() What exists in the value stream preventing the implementation of Lean at this time? How can it be addressed?
What exists in the value stream preventing the implementation of Lean at this time? How can it be addressed?
Quality
The quality practitioners — whether they’re from a formal quality function or other experts such as Six Sigma practitioners or statistical analysts — examine value-added from the perspective of correctness: Does the transformation happen correctly? Is it done right the first time? Is the process capable of producing defect-free results regularly?
Think of debris dumped into a river and what it does to the flow of the current. When quality losses occur in the value stream, it is like debris dumped into stream — impeding its flow. The quality practitioners evaluate the process to identify where it isn’t capable of creating good product or service, and where suppliers or downstream contributors create poor quality for the consumer. Analyzing the value stream from a quality perspective will lead you to ask the following types of questions:
![]() Where is poor quality reaching the customer? What are the defects?
Where is poor quality reaching the customer? What are the defects?
![]() How are quality issues reported from the customer, transmitted into the organization, and resolved? What is the response time to address a customer complaint?
How are quality issues reported from the customer, transmitted into the organization, and resolved? What is the response time to address a customer complaint?
![]() How is quality controlled at the source?
How is quality controlled at the source?
![]() What is the fall-off rate at each step?
What is the fall-off rate at each step?
![]() Where are the losses the greatest?
Where are the losses the greatest?
![]() What is the most common cause of scrap?
What is the most common cause of scrap?
![]() What is the root cause of the scrap (design, equipment, training, and so on)?
What is the root cause of the scrap (design, equipment, training, and so on)?
![]() How are suspect items handled?
How are suspect items handled?
![]() How are reworked items returned to the normal flow?
How are reworked items returned to the normal flow?
![]() How can the process, design, or equipment be designed to prevent errors? Where can error-proofing create quality at the source?
How can the process, design, or equipment be designed to prevent errors? Where can error-proofing create quality at the source?
![]() What is the capability of each step?
What is the capability of each step?
![]() Which suppliers are the providers of the poorest quality?
Which suppliers are the providers of the poorest quality?
![]() How frequently have quality spills occurred and in what location?
How frequently have quality spills occurred and in what location?
![]() What steps have been taken to quarantine defective product?
What steps have been taken to quarantine defective product?
Supply
Most processes have inventory — either by accident or by design. Inventory can collect at the beginning, somewhere in middle, or at the end of the process. Inventory acts like a dam to the flow of the value stream. Where there is inventory, there is no flow. Likewise, where there are outages, there is no flow. Balance comes in orchestrating the flow of material supply and processing precisely to customer demand — in other words, matching the cycle time to the takt time.
Ask the following questions to evaluate how materials move through the current state process:
![]() Where is the inventory? Is it planned or unplanned?
Where is the inventory? Is it planned or unplanned?
![]() What is the inventory turn level?
What is the inventory turn level?
![]() What is the size of the storage?
What is the size of the storage?
![]() Where is the storage? In a warehouse? In process? In transit?
Where is the storage? In a warehouse? In process? In transit?
![]() How low can it go? Can you maintain an inventory of one?
How low can it go? Can you maintain an inventory of one?
![]() How is inventory managed?
How is inventory managed?
![]() Can the inventory spoil? Does it have a shelf-life?
Can the inventory spoil? Does it have a shelf-life?
![]() Do you practice first in, first out (FIFO)? How is it managed?
Do you practice first in, first out (FIFO)? How is it managed?
![]() What signals the withdrawals from the inventory?
What signals the withdrawals from the inventory?
![]() What are the reorder signals in the process?
What are the reorder signals in the process?
![]() Where is material pushed through the system?
Where is material pushed through the system?
![]() Where is the material pulled through the system? Where else can pull signals be used in the process?
Where is the material pulled through the system? Where else can pull signals be used in the process?
![]() Where are shipping costs exceeding plan? Why?
Where are shipping costs exceeding plan? Why?
![]() How are the quantities of raw material balanced with the shipping quantities?
How are the quantities of raw material balanced with the shipping quantities?
![]() How far does material travel in the value stream?
How far does material travel in the value stream?
![]() How are the incoming material shipments coordinated?
How are the incoming material shipments coordinated?
![]() When a quality issue arises, how is the inventory handled/quarantined?
When a quality issue arises, how is the inventory handled/quarantined?
![]() What is the dollar value of the inventory?
What is the dollar value of the inventory?
![]() What is the cost of floor space to handle the inventory?
What is the cost of floor space to handle the inventory?
Questions like “If FedEx or elves were moving our material, how would they do it?” can open the team up to creativity and benchmarking when creating the future-state VSM.
Engineering
Evaluate the current-state value stream from the perspective of the engineering disciplines: design, production, and maintenance. The engineering perspective will also help you examine the interfaces of the people, equipment, and processes.
At this juncture, you’re evaluating the current state of production processes and practices. Be aware that the designers are meanwhile developing future designs of new products and services. Because the majority of cost is established during the design phase, you want to involve the design engineers during the current-state VSM analysis. You also want to include the production engineers to ensure continuity.
Analyzing the value stream from a production-manufacturing engineering perspective, will lead you to ask the following types of questions:
![]() Is the process designed for flow and proper assembly?
Is the process designed for flow and proper assembly?
![]() Can processes be combined? Can alternative processes be used?
Can processes be combined? Can alternative processes be used?
![]() How can operations be laid out to maximize the effectiveness of operators?
How can operations be laid out to maximize the effectiveness of operators?
![]() How far away is the material or inventory being stored? How far does it travel between operations?
How far away is the material or inventory being stored? How far does it travel between operations?
![]() How is material presented into the process?
How is material presented into the process?
![]() How are the raw material quantities balanced with the shipping quantities?
How are the raw material quantities balanced with the shipping quantities?
![]() How can changeovers occur more quickly? How can concepts like the “Indy pit crew” be applied during changeovers?
How can changeovers occur more quickly? How can concepts like the “Indy pit crew” be applied during changeovers?
![]() What modifications can be done to equipment to prevent errors, facilitate the operation, eliminate workload from operators, combine operations, or facilitate flow?
What modifications can be done to equipment to prevent errors, facilitate the operation, eliminate workload from operators, combine operations, or facilitate flow?
![]() Is standardized work being followed? How can it be modified to improve quality and eliminate unnecessary processing or movement?
Is standardized work being followed? How can it be modified to improve quality and eliminate unnecessary processing or movement?
![]() Does the process design cause safety or ergonomic issues?
Does the process design cause safety or ergonomic issues?
![]() How can cycle times be balanced with takt time?
How can cycle times be balanced with takt time?
Analyzing the value stream from a design engineering perspective, will lead you to ask the following types of questions:
![]() What type of product defects occur during the process? Where do they occur?
What type of product defects occur during the process? Where do they occur?
![]() How can features be built into the design to ensure it is always made correctly?
How can features be built into the design to ensure it is always made correctly?
![]() What issues in the current product, process or equipment design might be in the future designs?
What issues in the current product, process or equipment design might be in the future designs?
![]() Can the design be simplified to facilitate production without compromising customer requirements?
Can the design be simplified to facilitate production without compromising customer requirements?
![]() Are certain design specifications unnecessary for the customer requirements? Where can specifications be eliminated or changed without negatively impacting customer requirements?
Are certain design specifications unnecessary for the customer requirements? Where can specifications be eliminated or changed without negatively impacting customer requirements?
![]() Are the design tolerances properly specified to ensure the product could be made right the first time, every time?
Are the design tolerances properly specified to ensure the product could be made right the first time, every time?
Analyzing the value stream from a maintenance/equipment engineering perspective will lead you to ask the following types of questions:
![]() What is the uptime of the equipment?
What is the uptime of the equipment?
![]() What is the current maintenance schedule? Is it reactive or planned? If planned, is it preventive or predictive?
What is the current maintenance schedule? Is it reactive or planned? If planned, is it preventive or predictive?
![]() What modifications can be made to the equipment to prevent defects from being produced?
What modifications can be made to the equipment to prevent defects from being produced?
![]() What pieces of equipment have the greatest maintenance issues?
What pieces of equipment have the greatest maintenance issues?
![]() Are there different brands of equipment performing the same function/operation? Is there a difference in performance level?
Are there different brands of equipment performing the same function/operation? Is there a difference in performance level?
![]() What modifications can be made to the equipment, tooling, and process to facilitate quick changeovers? (See Chapter 11.)
What modifications can be made to the equipment, tooling, and process to facilitate quick changeovers? (See Chapter 11.)
![]() What is the process to notify maintenance? How can it be improved?
What is the process to notify maintenance? How can it be improved?
![]() When there is an issue, what is the response time for maintenance to respond? What is the time to resolve the issue?
When there is an issue, what is the response time for maintenance to respond? What is the time to resolve the issue?
![]() What simple maintenance activities can be transferred to the operators to perform?
What simple maintenance activities can be transferred to the operators to perform?
![]() What visual controls can be used or improved to communicate the accurate status of the equipment and scheduled maintenance performance?
What visual controls can be used or improved to communicate the accurate status of the equipment and scheduled maintenance performance?
![]() What modifications, features, or controls can be added to the equipment to enable operators to run multiple pieces of equipment?
What modifications, features, or controls can be added to the equipment to enable operators to run multiple pieces of equipment?
![]() What controls can be added to the equipment to automatically stop when defects are produced or equipment problems arise?
What controls can be added to the equipment to automatically stop when defects are produced or equipment problems arise?
Information
The VSM depicts the flow of information that supports the product and material flow. Your analysis of the current state should include a focused examination of the information component. The purpose of this analysis is to find opportunities to eliminate waste or make improvements based on information.
Answering the following questions will help you when determining where waste exists in the information flow:
![]() Does the information flow to the customer, without delays?
Does the information flow to the customer, without delays?
![]() Does the information flow from the customer, without delays or filters?
Does the information flow from the customer, without delays or filters?
![]() Does the information flow through the organization smoothly?
Does the information flow through the organization smoothly?
![]() Is the information flow accurate? Is the right information going to the right people in the right place? Complete? Contradictory?
Is the information flow accurate? Is the right information going to the right people in the right place? Complete? Contradictory?
![]() Does the information arrive at the right time? Is it too early or late? Is there too much or too little?
Does the information arrive at the right time? Is it too early or late? Is there too much or too little?
![]() Are the right people in the information flow and receiving the right information?
Are the right people in the information flow and receiving the right information?
![]() Is the information being transmitted in the most efficient way?
Is the information being transmitted in the most efficient way?
![]() Is the information being used?
Is the information being used?
![]() Are prompt and proper approval chains in place?
Are prompt and proper approval chains in place?
Evaluating the evidence: An analyzed example
A small salad company supplies local, high-end grocery stores with gourmet salads on a daily basis. It operates on one shift: The morning is assembly, and the afternoon is ingredient preparation for the next day. The drivers are scheduled to leave the facility by 9 a.m. so that their deliveries will be complete by 11 a.m., in time for the lunch crowd. They conscientiously adhere to health and safety standards for food preparation.
The salad company’s direct customers (the grocery retailers) have one major complaint: The deliveries tend to run late. When the salad company reviews its shipping data, it realizes that its drivers are leaving late from its commissary — about 45 minutes late, almost every day.
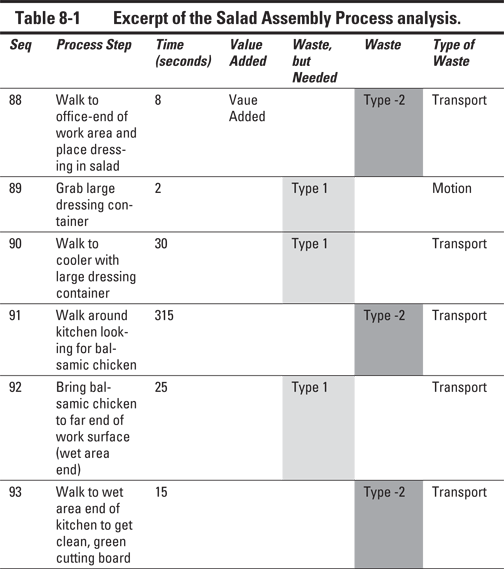
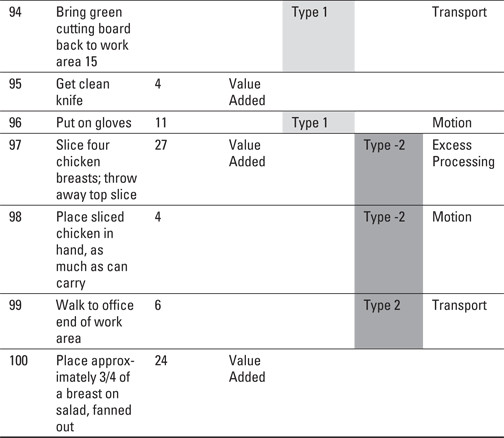
After reviewing the video from production one morning, the team realizes that several things were causing the product to be late in the morning. However, the main place they need to start is with the salad assembly process. To better understand where the waste happens, the team makes a detailed assessment of that process. The full analysis would be much longer, so only an excerpt is shown in Table 8-1.
The team observes that the following issues directly contribute to lateness:
![]() In general, the process was disorganized.
In general, the process was disorganized.
![]() The work standards were not well defined.
The work standards were not well defined.
![]() Considerable time was lost wandering around looking for things.
Considerable time was lost wandering around looking for things.
![]() They did not consistently complete the ingredient preparation completed the afternoon before.
They did not consistently complete the ingredient preparation completed the afternoon before.
![]() Ingredients had not been ordered on time, causing them to send one of the workers to purchase them at a premium from a retail store.
Ingredients had not been ordered on time, causing them to send one of the workers to purchase them at a premium from a retail store.
![]() Untrained workers were used to help get the product out the door.
Untrained workers were used to help get the product out the door.
![]() Product flow was backwards causing the finished product to end at the point farthest from the shipping point. This caused unnecessary product movement and employee traffic in the flow.
Product flow was backwards causing the finished product to end at the point farthest from the shipping point. This caused unnecessary product movement and employee traffic in the flow.
In addition, they notice other wastes occurring in the process:
![]() There was an unnecessary loss of ingredients as a result of the current process. Good product was thrown away. Containers were overfilled, causing ingredients to fall to the work surface.
There was an unnecessary loss of ingredients as a result of the current process. Good product was thrown away. Containers were overfilled, causing ingredients to fall to the work surface.
![]() Ingredients were not being measured, which could affect the quality and consistency of the product, not to mention contribute to inventory losses and excess costs to the small business.
Ingredients were not being measured, which could affect the quality and consistency of the product, not to mention contribute to inventory losses and excess costs to the small business.
![]() The workload was unbalanced. Some operators appeared overloaded and others were waiting on product to process. Drivers were waiting on product to label.
The workload was unbalanced. Some operators appeared overloaded and others were waiting on product to process. Drivers were waiting on product to label.
![]() The number of labels did not match the production sheet causing them to question which was correct.
The number of labels did not match the production sheet causing them to question which was correct.
![]() The order of production dirtied extra dishes unnecessarily.
The order of production dirtied extra dishes unnecessarily.
This current-state value-stream analysis not only identifies numerous contributors to the lateness problem, but also many other sources of waste. The foundation has now been set for considering improvement options. The first step is to ponder the ideal state — what would be possible if all constraints could be cast aside. Then define the future state, an incremental step towards the ideal state, and set the plan to achieve the first round of improvement.
Painting a Picture of the Future
The current-state VSM is a snapshot in time — it’s where you are now. That’s an important view, but it’s only the first step. After you’ve characterized the current state, it’s important to set your sights on the view of where you’re going. In this section, you take the opportunities for improvement that you’ve identified in your current-state value-stream analysis and turn them into a design of the future.
In Lean, you consider two future views.
![]() The view of the utopian or ideal state: In a perfect world, with only value-added steps, how could you best meet the customer’s requirements? (Toyota’s True North is one example of this; see Chapter 3)
The view of the utopian or ideal state: In a perfect world, with only value-added steps, how could you best meet the customer’s requirements? (Toyota’s True North is one example of this; see Chapter 3)
![]() The more-grounded future state that you can implement relatively quickly with a focused plan: In the future state, you make incremental improvements to the current state, eliminating waste and reducing the non-value-added steps. Identify what is the next right step over a defined time period. Define this based on your specific business conditions, focusing first on those items directly affecting your customer.
The more-grounded future state that you can implement relatively quickly with a focused plan: In the future state, you make incremental improvements to the current state, eliminating waste and reducing the non-value-added steps. Identify what is the next right step over a defined time period. Define this based on your specific business conditions, focusing first on those items directly affecting your customer.
Creating the ideal-state value-stream map: Long-term vision of possibilities
If your process is in a state of ideal flow, you make one as the consumer takes one. The process is in perfect balance. All activities are value-added. All process steps take the same amount of time. There is no inventory in process. All process steps produce perfectly, without defects. You have the exact capacity needed for the consumption rate, with the precisely correct number of staff, trained perfectly for the tasks.
Ponder this for a moment: a process where everything is exactly right. Don’t ruin the thought with the realities of imperfection — that’s for the next section. For now, picture utopia. See it all working perfectly.
If you’re having trouble with this pie-in-the-sky stuff, it’s because you’re being pragmatic. You’re thinking that you can’t achieve perfection, and it’s because you’ve been conditioned to think that way. Don’t think about how you would get there; think about where you want to go!
Why define an ideal-state VSM? Why spend legitimate business time and effort considering something that you probably can’t have? The reason is simple: Because it defines a consistent long-term vision, sets a direction and challenges you to move the organization toward it. When you allow people to imagine cutting the ties of the past and letting go of the constraints of the present, you raise the collective consciousness and enable teams to engage in radical thinking that often identifies breakthrough opportunities.
 Toyota uses True North as a foundation for all changes. They may not know how to get there today, but they know if they keep working in that direction, they will continue to improve and achieve more than if they only focused on what they know how to do.
Frequently, the ideal-state VSM exercise results in dramatic gains. The power of imagination is unbounded. When unbridled, ideas flow freely and great things emerge. The ideal-state VSM produces a vision for the long term and direction for the next step: the future state.
To define the ideal-state VSM, use the same icons and graphics you used to create the current-state VSM defined in Chapter 7.
Stepping closer to perfection: The future-state value-stream map
Now it’s time to take all the mapping efforts, the analyses, and the ideal-state visions and marry them to define the future state. The improvements that you select now become the foundation for your planning activities. The future-state VSM is your next increment of performance improvement.
Pacemakers, supermarkets, and heijunka, oh my!
Before you can envision the future-state VSM, you first need to understand several additional Lean concepts. Chapter 2 addresses the principles of Lean. Chapter 6 addresses the concepts of value added, non-value added, flow, and the three Ms (muda, mura and muri.) Here is where you put those principles and concepts into action, as well as some of the following new ones:
![]() Pacemaker operation: The pacemaker operation sets the pace for the rest of the value stream. It’s the one and only operation that receives the production schedule. The pacemaker produces to the takt time and sets the pace for the operations before it to produce only enough to replenish what the pacemaker operation has consumed. After the pacemaker operation, the process must produce in a continuous flow (unless a storage area or supermarket is required for finished goods — see later in this chapter). Balance multiples of pacemaker production to the quantity shipped to the customer. For example, if the shipping quantity to the customer is 60 per container, then you might release 20 at a time to the pacemaker operation.
Pacemaker operation: The pacemaker operation sets the pace for the rest of the value stream. It’s the one and only operation that receives the production schedule. The pacemaker produces to the takt time and sets the pace for the operations before it to produce only enough to replenish what the pacemaker operation has consumed. After the pacemaker operation, the process must produce in a continuous flow (unless a storage area or supermarket is required for finished goods — see later in this chapter). Balance multiples of pacemaker production to the quantity shipped to the customer. For example, if the shipping quantity to the customer is 60 per container, then you might release 20 at a time to the pacemaker operation.
![]() Bottleneck process: The bottleneck process is the process with the longest cycle time.
Bottleneck process: The bottleneck process is the process with the longest cycle time.
![]() Work cells: Work cells are aggregated operations fit into a compact area, in order to facilitate continuous flow, and single-piece production. Work cells are capable of performing all, or most, of the operations required for the value stream to deliver its product or service. This is wholly different from a traditional functional-department organization.
Work cells: Work cells are aggregated operations fit into a compact area, in order to facilitate continuous flow, and single-piece production. Work cells are capable of performing all, or most, of the operations required for the value stream to deliver its product or service. This is wholly different from a traditional functional-department organization.
![]() Supermarkets: Supermarkets are stores of in-process inventory used where the process cannot produce a continuous flow. Examples of supermarkets include when one operation services many value streams, when suppliers are too far away, or when processes are unstable, have long lead times, or have out-of-balance cycle times. The supplying operation controls the supermarket and its inventory. Supermarket inventory is tightly controlled.
Supermarkets: Supermarkets are stores of in-process inventory used where the process cannot produce a continuous flow. Examples of supermarkets include when one operation services many value streams, when suppliers are too far away, or when processes are unstable, have long lead times, or have out-of-balance cycle times. The supplying operation controls the supermarket and its inventory. Supermarket inventory is tightly controlled.
![]() Standardized work: Standardized work is the description of the work being performed, and it includes the takt time, specific sequence or activities and defined work-in-process inventory. It’s the standard to which the actual process is compared, and it represents the foundation on which to improve. (See Chapter 12.)
Standardized work: Standardized work is the description of the work being performed, and it includes the takt time, specific sequence or activities and defined work-in-process inventory. It’s the standard to which the actual process is compared, and it represents the foundation on which to improve. (See Chapter 12.)
![]() Kanban: Kanban are the signals to move and produce. In a pull system, where material or work is “pulled through” a process by demand, kanban is instruction that declares that a withdrawal has been made, so you can produce more. The signal can come in many forms: an empty container, a card, a ball — it takes whatever form best tells the supplying operation to produce. Kanban identifies a standard production quantity. (See Chapter 11.)
Kanban: Kanban are the signals to move and produce. In a pull system, where material or work is “pulled through” a process by demand, kanban is instruction that declares that a withdrawal has been made, so you can produce more. The signal can come in many forms: an empty container, a card, a ball — it takes whatever form best tells the supplying operation to produce. Kanban identifies a standard production quantity. (See Chapter 11.)
![]() Heijunka: Heijunka, also known as workload leveling or production smoothing, is the practice of smoothing out the volume and mix of the schedule for what’s to be produced. The goal of heijunka is to level work schedules to the point where there is little variation on a daily basis. Heijunka makes continuous flow, pull signals, and inventory minimization possible. (See Chapter 11.)
Heijunka: Heijunka, also known as workload leveling or production smoothing, is the practice of smoothing out the volume and mix of the schedule for what’s to be produced. The goal of heijunka is to level work schedules to the point where there is little variation on a daily basis. Heijunka makes continuous flow, pull signals, and inventory minimization possible. (See Chapter 11.)
![]() Pitch: Pitch is the amount of time required to make a standard container of finished product. If the standard container is 60 pieces and the takt time is 45 seconds, the pitch is 45 minutes.
Pitch: Pitch is the amount of time required to make a standard container of finished product. If the standard container is 60 pieces and the takt time is 45 seconds, the pitch is 45 minutes.
Marking up the current-state VSM
The future-state VSM begins as a markup of the current-state VSM. Don’t start with a clean sheet of paper! Make changes directly on the current-state VSM. Identify where and what type of improvements you intend to make. Based on the team’s evaluations and observations, indicate what changes will address the issues. The markup technique is to indicate the changes in a sunburst icon called a kaizen burst.
Marking all of the areas you want to change doesn’t imply that you’ll necessarily make all the changes at the same time, but it defines an endpoint and scope for this particular improvement phase. With this picture, you can predict the type and extend of improvement you anticipate from the implementation. By identifying such things as how much NVA time will be reduced, and how much key process times are reduced, you can quantify the improvement goals.
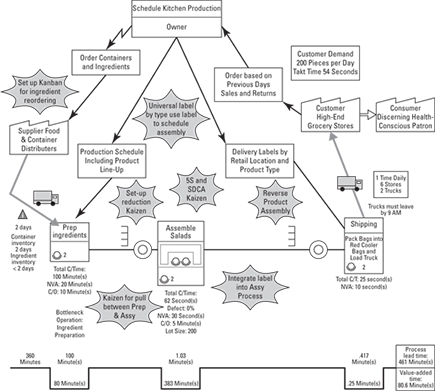
In the salad company example, the team marks up their current-state VSM with numerous ideas for improvement as a result of their observations and ideal-state brainstorming. Figure 8-2 shows the areas where the team would like to improve. They start with a 5S (see Chapter 11) to clean up and organize the work area. In particular, they identify standard containers and scoops for the ingredients, and improved visual controls in the area. Because they observed that not all team members understood the work standard for the salad line, they review the process and establish formal, written standards; they then post the standards on the line. Because the salad-preparation work was not complete, they evaluate ways to eliminate NVA time and implement pull signals between assembly, preparation and supply. They also reverse the product assembly flow to eliminate the extra traffic in the production area, which is a safety hazard, caused by the drivers retrieving finished salads.
Figure 8-2: The current-state VSM markup for the salad company.
Eventually, the team also wants to improve the inventory management in the value stream. In addition, they want to involve their suppliers in identifying ways to receive more-frequent deliveries and have better stock rotation.
Gazing into the crystal ball: Seeing the future-state value-stream map
As soon as you’ve identified the candidate changes, create a new picture: your future-state VSM draft — the picture of what the value stream will look like after implementing the improvements. Begin with the current-state VSM and implement the proposed changes. Leave the kaizen bursts in place for reference.
Also ask yourself a set of qualifying questions. (See the “Pacemakers, supermarkets, and heijunka, oh my!” section, earlier in this chapter to clarify any of these questions.) Indicate the answers on the future-state VSM draft, either directly or through the selection of the correct icons for kanban.
![]() What is the takt time (confirming it hasn’t changed from the current state)?
What is the takt time (confirming it hasn’t changed from the current state)?
![]() What is the actual cycle time compared to the takt time?
What is the actual cycle time compared to the takt time?
![]() Where is the bottleneck operation?
Where is the bottleneck operation?
![]() What operation has the greatest variation in cycle time or quality performance?
What operation has the greatest variation in cycle time or quality performance?
![]() Where can continuous flow happen?
Where can continuous flow happen?
![]() Where can work cells be implemented?
Where can work cells be implemented?
![]() Which is the pacemaker operation?
Which is the pacemaker operation?
![]() What process will be scheduled to the customer demand?
What process will be scheduled to the customer demand?
![]() Where will you use kanban signals?
Where will you use kanban signals?
![]() Where do supermarkets need to be located?
Where do supermarkets need to be located?
![]() What is the right lot size between processes?
What is the right lot size between processes?
![]() What is the standard shipping quantity for the customer?
What is the standard shipping quantity for the customer?
![]() What is the pitch?
What is the pitch?
![]() What are the current setup times?
What are the current setup times?
![]() How can schedules be smoothed at the pacemaker operation?
How can schedules be smoothed at the pacemaker operation?
![]() How much time, of the available hours, is being used for production and how much is leftover for changeovers?
How much time, of the available hours, is being used for production and how much is leftover for changeovers?
Answering real questions about value-stream maps
Value-stream mapping is uniquely related to Lean. You typically don’t encounter VSMs outside of Lean practice. If you’re new to Lean, you’ll naturally have questions. In the following list, we answer some frequently asked questions:
![]() What makes a VSM so useful, as opposed to standard process-flow diagrams? A process-flow diagram is a valuable tool for identifying resources and interfaces, but that’s only part of the picture. A value-stream map is a more complete process flow — and it’s customer-centric. The value-stream map, in one place, shows not only how material flows through the value stream, but also the information flow, takt time, bottleneck operations, operator location, size and type of inventories, modes of transportation, as well as the relationship of customers and suppliers along the whole value stream. The value stream is much more comprehensive than a process flow diagram.
What makes a VSM so useful, as opposed to standard process-flow diagrams? A process-flow diagram is a valuable tool for identifying resources and interfaces, but that’s only part of the picture. A value-stream map is a more complete process flow — and it’s customer-centric. The value-stream map, in one place, shows not only how material flows through the value stream, but also the information flow, takt time, bottleneck operations, operator location, size and type of inventories, modes of transportation, as well as the relationship of customers and suppliers along the whole value stream. The value stream is much more comprehensive than a process flow diagram.
![]() Why create an ideal-state value-stream map? Creating an ideal-state VSM encourages you to think outside the box, looking at the value stream with an objective viewpoint to identify breakthrough ideas. It opens up your mind to the possibility of dramatic innovation, sometimes referred to as kaikaku. Although the main focus of Lean is in making regular, small, incremental improvements, if you never take the time to contemplate or dream of a radically different state, you’ll be missing an opportunity for truly innovative improvement. You also create a long-term vision to work toward as you incrementally improve.
Why create an ideal-state value-stream map? Creating an ideal-state VSM encourages you to think outside the box, looking at the value stream with an objective viewpoint to identify breakthrough ideas. It opens up your mind to the possibility of dramatic innovation, sometimes referred to as kaikaku. Although the main focus of Lean is in making regular, small, incremental improvements, if you never take the time to contemplate or dream of a radically different state, you’ll be missing an opportunity for truly innovative improvement. You also create a long-term vision to work toward as you incrementally improve.
![]() Where is the best place to start with value-stream mapping? As always, start with your customer. If your customer is not the end consumer, you still start with your customer — but keep in mind how your processes are affected by the consumer. After you’ve identified the customer’s requirements, work your way upstream.
Where is the best place to start with value-stream mapping? As always, start with your customer. If your customer is not the end consumer, you still start with your customer — but keep in mind how your processes are affected by the consumer. After you’ve identified the customer’s requirements, work your way upstream.
![]() What is the “right” level of detail? There is no single “right” level of detail — it depends on your context and condition. The right level of detail is a balance between defining enough detail to find and eliminate meaningful amounts of waste and not having so much detail that you bog down and never move to the improvement phase. Value-stream mapping is an iterative process, so with each pass through, you can add more detail as necessary.
What is the “right” level of detail? There is no single “right” level of detail — it depends on your context and condition. The right level of detail is a balance between defining enough detail to find and eliminate meaningful amounts of waste and not having so much detail that you bog down and never move to the improvement phase. Value-stream mapping is an iterative process, so with each pass through, you can add more detail as necessary.
![]() What is the difference between the macro (or high-level) view of the value stream and the value-stream map? The macro-level view is a diagram that shows you where your process fits in the overall value stream relative to the consumer and the first supplier of the rawest of raw materials. If you were to try to construct a VSM on a detailed level of the entire VSM, it would be unwieldy and you would never get to the improvement phase. With the simple macro diagram, you gain perspective.
What is the difference between the macro (or high-level) view of the value stream and the value-stream map? The macro-level view is a diagram that shows you where your process fits in the overall value stream relative to the consumer and the first supplier of the rawest of raw materials. If you were to try to construct a VSM on a detailed level of the entire VSM, it would be unwieldy and you would never get to the improvement phase. With the simple macro diagram, you gain perspective.
![]() Which is better: creating a manual VSM or using a software package to create the VSM? In a team environment, it can be faster to use manual drawings to create initial VSMs, because they’re simple, quick, more visual and engaging for a team of people constructing them. After the initial creation, use software tools like ARIS to maintain and control the on-going VSMs.
Which is better: creating a manual VSM or using a software package to create the VSM? In a team environment, it can be faster to use manual drawings to create initial VSMs, because they’re simple, quick, more visual and engaging for a team of people constructing them. After the initial creation, use software tools like ARIS to maintain and control the on-going VSMs.
Warning: Whether you use manual VSMs or plots from a software tool, you need to go to gemba when creating, validating or brainstorming processes.
![]() How do I VSM the same product made in different places? Start at one location and carry the knowledge to other facilities. As you form the team, include members from the other locations. When you go to gemba (where work physically is done.), include the other facilities to observe what variation exists in the process. These steps will prevent the “not invented here” syndrome when you spread the knowledge across the organization. You’re also more likely to create a blend of best-practice ideas to implement.
How do I VSM the same product made in different places? Start at one location and carry the knowledge to other facilities. As you form the team, include members from the other locations. When you go to gemba (where work physically is done.), include the other facilities to observe what variation exists in the process. These steps will prevent the “not invented here” syndrome when you spread the knowledge across the organization. You’re also more likely to create a blend of best-practice ideas to implement.
After you’ve answered these questions and indicated the changes on the future-state VSM draft, you can analyze the map and predict what the future-state process should look like. If you’re using a software program, the lead time along the bottom will update as you change the information for the step in the value stream.
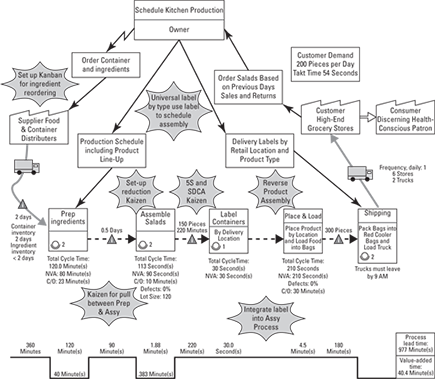
Figure 8-3 shows the future-state VSM draft for the salad company. Note the changes. The company will first establish standards and improve the scheduling for the preparation operations by implementing a supermarket and preparing for replenishment. By establishing standards and eliminating the push inventory, the company sees significant reductions in lead time. They move the labeling operation into the assembly process. They use universal UPC codes to eliminate the sorting of labels by store.
As with the current-state VSM analysis, don’t get stuck analyzing the potential changes for your future-state VSM to death. Lean is an iterative process. Identify what you want to improve, then improve it, and then repeat the cycle (Use the PDCA for this; see Chapter 9.) The future-state VSM is a snapshot of where you want to go. Make the picture and move to kaizen (Chapter 9).
Creating the Mosaic of Continuous Improvement: Setting the Stage for Kaizen
Value-stream mapping is a foundational tool used as part of a cycle and philosophy of continuous improvement. It may sound like it’s a big effort — creating a current-state map, then an ideal-state map, then a future-state map draft, and finally a future-state map that you can actually implement. You may feel like you need to command significant resources to bring a team together, analyze all the data, brainstorm all the ideas, and involve all the different perspectives. You may be thinking you’re developing a new career in cartography with all these maps! But the role and purpose of value-stream mapping is not about conducting huge efforts, big projects, and long implementation programs. You create value-stream maps in order to document, focus, and guide improvement efforts. Value-stream mapping is a concise effort, typically performed in a short time-span of just a few days — even for a relatively complex process. For simpler processes like the salad making exercise, you perform these VSM activities in a few hours.
Figure 8-3: The future-state value-stream map draft for the salad company.
Looking toward the annual horizon
Use the improvements that you identified on the future-state VSM to establish implementation priorities and a plan. The plan should be concise — just a few pages, no frills — it’s a brief look at the year ahead. Scope individual improvement activities to days, weeks, or months, depending on the complexity of the activity. The plan should be a list of the projects that you will complete, with timing and responsibilities clearly defined.
To maintain the proper scope and focus of your future-state plans:
![]() Identify a minimum number of key metrics for improvement. Don’t try to solve all the problems at once.
Identify a minimum number of key metrics for improvement. Don’t try to solve all the problems at once.
![]() Prioritize changes that are most meaningful to the customer first, then look at those most meaningful to the business.
Prioritize changes that are most meaningful to the customer first, then look at those most meaningful to the business.
![]() Make the project just large enough to be meaningful and measurable.
Make the project just large enough to be meaningful and measurable.
![]() Try to change one thing at a time, quickly to see the improvement effect.
Try to change one thing at a time, quickly to see the improvement effect.
![]() Remember that you’re going to be doing it again!
Remember that you’re going to be doing it again!
How often you revisit your future-state VSM depends on your business cycles; however, do it at least every six months. Validate your ideal-state VSM annually. You don’t have to go through the entire Current State-Ideal State-Future State map exercise each time you make a change to the current state. The emphasis is on the improvement, not the mapping exercise. If you have completed all your planned improvements before six months, create a new future state VSM.
Many companies make the mistake of changing too many things all at once. This is a recipe for less-than-optimal results, and it makes it impossible to understand true root cause. Make small, simple incremental changes quickly and frequently. You will gain momentum and have more traceability and control for the results.
Improving just for improvement sake is a waste of time and resources; it can even cause people to disengage if you are not careful. Be sure your improvement efforts directly affect the customer for good or improve the business in a cohesive way — safety, people, quality, delivery, cost and so on.
Future-state implementations
After you have the maps and the plan, you’re ready to implement. In Chapter 9, we show you how to implement Lean projects. At this juncture, you may be wondering, “What happens to the maps as I make improvements?”
![]() Update the current-state VSM to reflect the new state as you make improvements. This is a critically important configuration-management practice. You must show that current state reflects the new standard. You also need the record of where you are in pursuit of your goals. Keep a copy of your first current-state VSM. Two or three years from now, you won’t believe how much change you’ve made. The old maps are also good to have on hand so you can remind people just how far you’ve come and how you got there.
Update the current-state VSM to reflect the new state as you make improvements. This is a critically important configuration-management practice. You must show that current state reflects the new standard. You also need the record of where you are in pursuit of your goals. Keep a copy of your first current-state VSM. Two or three years from now, you won’t believe how much change you’ve made. The old maps are also good to have on hand so you can remind people just how far you’ve come and how you got there.
![]() Compare the new current state to the predictions on the future-state VSM. If you aren’t on track, you may need to adjust your plan.
Compare the new current state to the predictions on the future-state VSM. If you aren’t on track, you may need to adjust your plan.
![]() After all the ideas have been exhausted or you’re at the end of a planning period, start the mapping process again. Use the latest current-state VSM, and move through the exercise of confirming the validity of your ideal-state VSM and building the next future-state VSM.
After all the ideas have been exhausted or you’re at the end of a planning period, start the mapping process again. Use the latest current-state VSM, and move through the exercise of confirming the validity of your ideal-state VSM and building the next future-state VSM.
..................Content has been hidden....................
You can't read the all page of ebook, please click here login for view all page.