
Figure 11-1: A product family operation graph.
Chapter 11
Flow and Pull Tools
In This Chapter
![]() Preventing interruptions to flow
Preventing interruptions to flow
![]() Organizing the process for flow
Organizing the process for flow
![]() Orchestrating the material flow
Orchestrating the material flow
Lean fundamentals include the concepts of flow in the value stream and pull from each customer through the value stream; Lean tools help you implement these flow and pull techniques. Use these tools to set the pace of your system and eliminate restrictions or blockages to flow. Start with the flow tools. Applying the flow tools first clears out the obstructions and gives you a solid foundation upon which to use the pull tools to create a kanban-based pull system
Along with the customer and value-stream tools in Chapter 10, the perfection tools in Chapter 12, and the management tools in Chapter 13, these tools make up the overall Lean toolbox. You need all these tools to support Lean practices. To maintain balance in your overall system, you must use the full complement of tools in the Lean toolbox.
 Attempting to implement Lean can fail if your organization tries to implement a tool in isolation or at the wrong time (this has been particularly true with pull tools). You can’t use just one Lean tool like kanban and expect to be wildly successful; it would be like trying to build an entire house with just a hammer. You have to look at your system as a whole. For example, a system plagued with defects or equipment outages will never be able to produce to a pull signal at a given takt. For this reason, success requires you to use all the tools, follow the principles, and apply the philosophies of Lean. No cherry-picking!
Flow
You can see the power of flow all around you. Traffic flows — unless it is rush hour, when the demand exceeds the capacity of the road system, or someone has made a mistake and caused an accident. Music flows — as the musicians play together to a defined tempo. If one musician got out ahead or fell behind, the flow would be disrupted, and that disruption is the difference between beauty and cacophony. In our bodies, blood flows as a life force; and we know that obstructions can be debilitating — even fatal.
In each of these examples, you can see how perfect flow achieves the goal, but also what happens when flow is interrupted. In Lean, eliminating waste is eliminating obstructions to flow — of people, products, services, information, or materials. It’s easy to realize that flow is dependent upon all the elements of a system working in concert. When one part of the system is not functioning properly, you won’t have flow. When all parts are working together, flow happens.
Smoothing the waters — 5S (plus one)
To establish orderly flow, start with 5S — the practice of eliminating waste by organizing the workplace; sort, straighten, scrub, systematize, and standardize. Note that many organizations have recently added an additional S to the original 5: it is for safety, so sometimes you’ll now hear it called 6S, although 5S is the historically used term.
5S is simple, practical, and an effective way to clean up your act. You implement 5S in two phases. Phase 1: Get rid of all the junk! Stop working around it. Phase 2: Create a system so there is a place for everything and everything stays in its place. Fundamental to these two phases is ensuring the safety of the people through effective layout and design.
Unless you have a very small facility, don’t try to address the entire facility at once. You’ll overwhelm everyone, and you risk not really eliminating items, but just shuffling them around. Before you start the 5S process, determine the bounds of the area you’re addressing.
The five steps of the 5S process are:
1. Sort.
Divide all the items in the workplace into three R categories:
• Retain: Retain items that are essential to the functioning of the work area. These items fall into two main groups: regular use and occasional use.
• Return: Return any items that belong to another department, location, supplier, customer or neighbor.
• Rid: Rid the area of all other items. Physically move them straight to the recycle bin or dumpster for disposal, or a staging area for immediate disposition. Note that any item located in the staging area must be tagged with clear information about its disposition.
 Isolate the rid items from the others. Red tags are particularly useful for items that the team wants to throw out, but that need some type of authorization for disposal. The tag should include the date it was moved to the area, the contact person and her contact information, the desired disposition, and the functions that need to sign off on the disposal. As a general rule, no item marked for disposal should remain in a staging area more than 48 hours.
 Apply the 3R technique to your digital information as well. It is easy to create multiple files in multiple locations; these excess inventories can potentially lead to errors and misinformation. Delete any obsolete or duplicate files or email messages. Of course, backups are a good practice, but they are still type-1 muda (see Chapter 2).
2. Straighten.
Find a place for everything and put everything in its place. Move the items that are always needed to where they’re needed. Establish and delineate the standard location for every item. Label everything. Make it visual. Better yet, make it sensory. Move those items that you don’t use frequently to a standard place, near the area — but not a place that could disrupt flow. Create a standard for the colors you use in your facility. For example, you may choose yellow to indicate aisles, green safety stations, red hazards, and so on.
3. Scrub.
Clean the entire area. Whether you’re in an office, a kitchen, or a factory, this means deep-clean everything! If the area or equipment needs a fresh coat of paint, get out the brushes and the rollers. And cleaning is everyone’s job — not just the janitor’s or painter’s. This step is important for several reasons:
• People working in a clean area tend to have a more positive attitude and be more productive.
• When everyone cleans, everyone has a clean mindset.
• Clean equipment helps you to detect leaks and problems with equipment faster.
• Clean and clear areas make safer work environments.
4. Systematize.
Now that you’ve gone to the work of cleaning the area once, establish the schedules and systems to maintain the area regularly, just the way it is on the first day after you’ve cleaned it.
5. Standardize.
Turn a one-time event into the way you conduct business. This step is the most difficult one because you’re creating new habits and levels of performance expectations. Forming new habits requires constant reinforcement and time, before the new habits become the standard.
6. Safety: the 6th S.
Safety is fundamental in building respect for people; having a safe environment also makes good business sense because millions of dollars are lost every year due to working-condition-related accidents, injury, and medical restrictions. Many large organizations have zero-accident objectives as part of their business plan. When evaluating a work area, regardless of whether it’s a manufacturing shop, an office or a supermarket, ensure the safety of all people — it’s good business. Evaluate areas for trip hazards, unguarded equipment, spill risks, cords on the floor, sharp objects, electrical issues, and any other risks that could cause accidents or harm the people interacting with the space. Find ways to eliminate or minimize these situations as quickly — and regularly.
 Evaluating your workplace for ergonomic issues is part of safety. Eliminate conditions causing muri — repetitive tasks, physically harmful conditions, awkward biomechanics, and so on. Evaluate your accident and injury data for issues and eliminate the root cause.
![]() Stress the importance of a safe and orderly environment.
Stress the importance of a safe and orderly environment.
![]() Practice a form of standardized work.
Practice a form of standardized work.
![]() Connect with the organization.
Connect with the organization.
Management tours should cover entire facilities, inside and out. Tours should not be ad hoc — they should follow a set process, with an established checklist of items to review, including an agenda and facility route, restroom visits, and safety equipment. Non-conformances should be recorded and addressed — in the case of safety issues, contain them immediately. On the next tour, follow up on these items. Refer to Chapter 13 for more information on gemba walks.
You’ll encounter resistance to the long-term maintenance of the 5S/6S results. Engineers who need to work with parts and highly creative people who need a little chaos to feed their creativity are some of the biggest resisters. You have to establish the standards for your organization. Some organizations require that desks are cleaned off every night; others have deemed this cleaning up at the end of the day as non-value-added. Both sides have merit. Determine what’s right for your organization.
Take one, make one
The ideal state of Lean is continuous flow production, calibrated perfectly to customer demand. When you can organize your work area and perfectly balance your operational times so that your document or widget is always in a state of value-added transformation, you’ve reached Lean nirvana. You may never actually get to this point, but you should never stop trying to get there. To do so, you have to think constantly about how you organize the value stream. The tools in the following sections will help you to move closer to the zenith of continuous flow.
Don’t get hung up on the language of continuous-flow production or single-piece flow. The terms may have originated in a manufacturing environment, but they apply whether you’re making products or providing services. You “flow people and information through a service process” just as you “flow material and information through a manufacturing process.” In both cases, the goal is to keep things moving effectively — no stops for queues or inventory or unnecessary movement or transport.
Finding common ground through Group Technology
You will often see all accountants located in the same physical office, even though their customer may be in another floor or building. Or you might see all the molding machines placed in one area, far from the subsequent processes. This functional grouping usually leads to a lot of unnecessary waiting, transport, and inventory.
Group Technology (GT) helps you work toward continuous value-added flow. With GT, you identify commonality in process through the analysis of all the products. Your aim is to identify product (or service) families. You use this information to reorganize how you do business. So instead of organizing by function, you organize everything you need to produce a complete product or service for the customer.
The term product is used here generically, to refer to physical products as well as nonphysical items like software, transactions, and service processes (such as hospitality and healthcare). Refer to Chapter 15 for more on how services are like products.
To perform a GT analysis, review all your products and the operational steps they require. A product family contains the same or highly similar operational steps. Table 11-1 shows a group technology analysis example. The shaded parts represent a product family because they pass through the majority of the same types of operations.
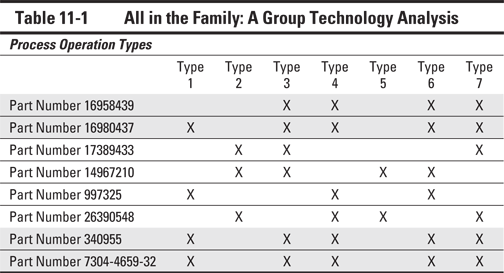
After you’ve identified all your product families, you can start to organize the areas that produce them by family rather than by operation function.
The power of organizing the production area by group technology rather than type or function is that you begin to eliminate excess waiting, inventory, or transport.
Organizations that have a low-volume, high-mix custom environment often struggle to see how group technology applies to them. Even if your product details are unique every time, recognize that at a macro level, your products pass through similar processing steps. You can use a sampling of past products to identify generic product families. Then when you spec out a new product, you can slate its production for a specific area.
Creating work modules
Traditional organizations are set up as functional departments, whether it’s an office or a manufacturing facility. The results of group technology analysis and reorganization will naturally reduce inventory, improve quality and communication, and save space. This is particularly beneficial for office workers, who often cluster in modules. Ensure each work module, sometimes called work cell, contains all the functions required to make the product or complete the service.
The extended value chains of global business are increasingly creating situations where the people working on products or services are not in the same location — or even the same continent. This means physical clustering becomes virtual clustering, but all the same needs exist. Use information and collaboration technologies to create virtual clusters.
Managing the monuments
A Lean work module contains all the operations that can be moved together into a continuous-flow arrangement. Sometimes you have fixed monuments (equipment or processes that are difficult to move, or large-capacity equipment that services multiple product families). Examples of monuments are the shipping dock, plating and painting operations, operating rooms, or glass furnaces. When this undesirable situation occurs, the flow is interrupted.
Some options for managing monuments include the following:
![]() Arrange affected work modules around the monument.
Arrange affected work modules around the monument.
![]() Establish supermarkets (an in-process, controlled storage area) to create controlled storage and flow to the monument operation.
Establish supermarkets (an in-process, controlled storage area) to create controlled storage and flow to the monument operation.
![]() Create continuous-flow work modules before and after the monument.
Create continuous-flow work modules before and after the monument.
![]() Consider purchasing smaller, more flexible technology to achieve the same function, and then incorporate it into work modules.
Consider purchasing smaller, more flexible technology to achieve the same function, and then incorporate it into work modules.
Challenge your belief that there is nothing you can do about a monument. Use the 5 Whys and then ask yourself, “How can we do this operation differently?” For instance, one company thought its paint facility was a monument. After persistent questioning, it found a way to incorporate a lower-technology miniature paint booth into its work module. Through persistence and a new perspective, it lowered inventory, eliminated a paint line that required lots of maintenances and frequently broke, and improved quality defects related to inventory and in-facility transit.
Many manufacturing operations use conveyors to move parts in the process, from monuments or other operations. Be careful about installing conveyors, because they are form of type-1 muda both work-in-process and transportation. Use conveyors sparingly. They are best used in environments where other methods could cause harm to the people because of weight or exposure.
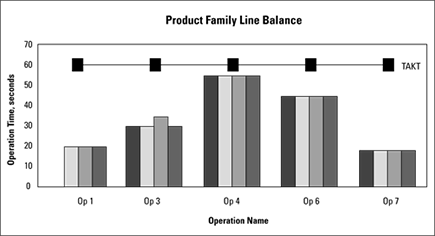
Balancing the operations
Base the capacity of a module on the collective demand of the customer for the product family as well as the capability of the team members. Figure 11-1 is an example of a product family operations graph (also known as a line balance chart). This graphs the operation times compared to takt time (see Chapter 7) for a product family. In this case, independent of the part being made, operation times are falling below a benchmark takt time of 60 seconds, indicating excess capacity. If operations exceeded takt time, you would consider additional capacity, which usually means adding people, for the module.
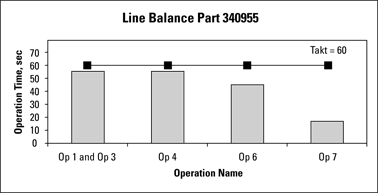
Now take the part number with the longest operation time and evaluate it for line balancing. You then can seek to combine operations — such as 1 with 3 and 6 with 7 — and still meet the takt time. Figure 11-2 shows the results. As you can see, the combination of operations 6 and 7 cause the cycle time to exceed the takt time, so you can’t combine them yet. Figure 11-3 shows the final line balance. The work cell requires four operators to run five operations. Going forward, the team would then seek to reduce the time required to complete operations 6 and 7, by at least 3 seconds — the time to balance to the takt time — and enable the cell to run with three operators.
One way to make the extra time of operator 7 visible is to have the person stand idle rather than finding non-value-added busy-work for them to do. Having them stand idle emphasizes the unused time, or waste.
Figure 11-2: Operational line balance — a first look.
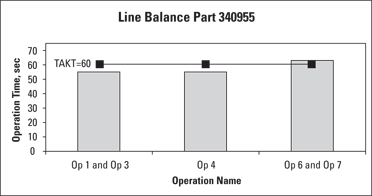
Figure 11-3: Operational line balance — implementation.
When evaluating each workstation or work area within a work module, apply industrial engineering techniques like left-hand/right-hand analysis or Therblig analysis (see Chapter 19 for more information). Evaluating and standardizing the movements at a micro level will increase flow, eliminate waste, and improve the effectiveness of the operations. Improvement at a micro level will enable the team to shave off the three seconds needed to eliminate that fourth operator.
Identifying bottleneck operations
Within any module, you’ll have a bottleneck operation — the one that limits throughput and runs at or near to the takt time. This operation becomes the critical operation to flow because there is no slack time or no option to add more people, if there is a machine issue. To identify the bottleneck, create an operations graph showing all the operations in the value stream.
Storing at the point of use
Point of use storage (POUS) means you store what you need, in the quantity you need it, at or near where you use it. This storage should be incorporated into the 5S standards. You have to identify the bill of materials, quantity used, and size of each component in order to establish where you’ll store each item, what type of container you’ll use for storage, and where best to locate the items. Document this information in the Plan for Every Part (PFEP), discussed later in this chapter.
POUS storage can be applied to the office environment. You may use tape and paper clips many times during the day, but shipping envelops only once a week. Organize the storage where you need the item according to when you need it.
When establishing POUS storage and work module arrangement, remember to evaluate the ergonomic impact on the operators. Considerations like shelf heights, reach distances, standup versus seated operations, and maximum heights are among some of the critical characteristics to evaluate. Investigate current industry standards and governmental regulations for more information.
Understand bottlenecks, output, work balance, staffing, and storage requirements before you arrange furniture. You can quickly gather, and analyze flow within your modules. Failure to understand these foundational elements of a work cell will lead to ineffective modules — full of muda!
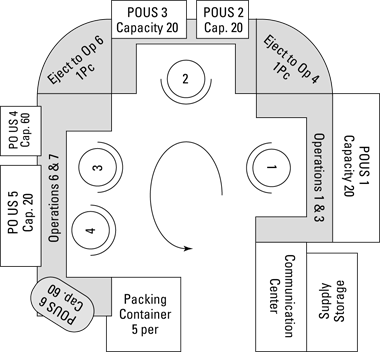
Arranging the work module – the U shape
The recommended shape for a work module is a U shape, flowing counterclockwise. U shapes don’t work in every application, but they’re a solid place to start. (The reasons for counterclockwise flow are numerous, but fundamentally, the right hemisphere of our brains process spatial relationships, so humans flow better to the left.) The U shape also provides a safer environment, where maintenance and material replenishment occurs on the outside of the U, and the people making the products are the only ones inside the U.
Create a layout before you start moving to ensure everything fits in the space allotted. Depending on how difficult it is to move equipment, you can use a layout tool like Visio or AutoCAD, scaled “paper-doll” cutouts of the equipment, or even full-size mockups of the module to establish the plan. If you’ve never created a work cell or work module before, and you have large pieces of equipment like presses or molding machines, you’ll want to use full-scale, three-dimensional replicas. This enables the team to ensure that the plan will work.
Use the 3P (Production, Preparation, Process; see Chapter 10) before purchasing new equipment. Creating simulations or physical mockups gives the people an opportunity to interact with the environment before a large investment has been made.
When you understand the foundational requirements, you’re ready to set up the module. Figure 11-4 is an example of a work module layout.
Figure 11-4: An example of a U-shaped work module layout.
If this is your first module, start with a pilot or test module. This will help you learn, work out the bugs, and introduce the organization to the concept before you physically tear up the entire facility.
The use of autonomation (automation with a human touch), or jidoka, in a workstation has two benefits:
![]() Automatically unloading equipment enables an operator to do other tasks, instead of having to stand around until the machine has finished.
Automatically unloading equipment enables an operator to do other tasks, instead of having to stand around until the machine has finished.
![]() Automation that stops equipment when defects or nonstandard conditions are detected prevents bad products from progressing through the value stream.
Automation that stops equipment when defects or nonstandard conditions are detected prevents bad products from progressing through the value stream.
People in the process
The work in modules is run by teams, sometimes referred to as employee involvement teams. These teams are usually autonomous, self-directed work teams. Often a team leader emerges or is named based on experience. The team leader is responsible for the implementation and performance of the cell:
![]() Production output, quality, delivery, and controllable cost performance
Production output, quality, delivery, and controllable cost performance
![]() Line balancing
Line balancing
![]() Cross training and team behavior
Cross training and team behavior
![]() Performing kaizen (everyday improvements)
Performing kaizen (everyday improvements)
![]() Maintaining the work area (cleaning and daily equipment maintenance)
Maintaining the work area (cleaning and daily equipment maintenance)
![]() Problem solving
Problem solving
Supervisors build capability, guide problem solving, coach, and mentor the team. They may have more work teams reporting to them. The daily task load is shifted to the team.
When moving to a Lean work cell environment, the teams and the supervisors will need training in new skills such as problem solving — and particularly the interpersonal skills of conflict resolution, teaming, coaching, and communication.
Preventing blockages to flow
After you’ve created your work modules, you have to make sure that they run continually as designed. In other words, you have to eliminate any and all causes that prevent flow — flow of quality, material, or equipment.
Ensuring quality at the source
In addition to the use of autonomation, you can establish quality at the source by using source inspection, progressive inspection, and poka-yoke (error-proofing).
Source inspection
Source inspection means you review your work before you pass it on to the next person or station. What you review, how you review it, and how much time it should take to review the work is identified as part of the standardized work for the operation. The benefit to source inspection is to identify, correct, and contain a problem before it enters into the value stream via the next processing operation.
Progressive inspection
Progressive inspection means that the operator reviews key characteristics of the product or service from the previous step before beginning a new transformational step. Once again, these inspection steps should be designed into the standardized work plan. Investing in critical inspection before any further work is performed protects the customer and minimizes the risk to the value chain.
Poka-yoke
Because inspection is a form of muda, a more certain and proactive type of quality at the source is error-proofing, known as poka-yoke or mistake-proofing. A poka-yoke is something in a product, process, or procedure that physically or procedurally prevents you from making a mistake.
Examples of poka-yoke are everywhere. Whenever you fill up your car at a gas pump with both diesel and regular gas, you’re using a poka-yoke device. The size of the diesel spout is larger than the gasoline spout, so the diesel spout can’t fit in the regular gas tank opening — which prevents you from doing serious damage to your engine! Another example: many electronic devices only allow you to plug in a specific way. In addition, online surveys have logic to check that you’ve answered all the questions or filled in the right numbers before you can proceed to the next step.
In performing poka-yoke, begin by evaluating each operational step for common quality problems. Identify guides, gauges, fixtures or code that will ensure the operation is done correctly every time. Follow the Plan-Do-Check-Act (PDCA) methodology to evaluate the effectiveness of your poke-yoke. Installing stops or prevention devices on equipment, or incorporating checklists into standardized work will help the situation. But the best way to error-proof is through the design of features in the product, or in the upfront design of the process or equipment via the 3P methodology (see Chapter 10).
Design for Assembly and Manufacturability (DFA/DFM) is a methodology to identify ways to design-in error-proofing and improve the ease of assembly. Performing Failure Mode Effects Analysis (FEMA) on the design and process (DFMEA/PFMEA) will help you to identify the risk and frequency of potential failures. With this information, you can prioritize your error-proofing efforts to mitigate risk.
Part of the foundation of Lean is “Respect for People.” Never use terms like dummy-proofing, fool-proofing, or idiot-proofing! The proper terms are poka-yoke, mistake-proofing, or error-proofing.
Although error-proofing may seem like detailed, picky analysis, it can mean the difference between life and death. Consider this situation: A restaurant served a small child margarita mix with alcohol instead of lemonade because the container was mislabeled. Or in a hospital, two medications — one designed for adults the other for infants — have similar names, and they’re placed in almost identical packaging. If the manufacturer changed the `container shape, size, or color so that the two medications were obviously different, the people in the hospital would be less likely to make the fatal mistake of delivering the wrong medicine to the wrong patient. It would also help the manufacturer to ensure they were providing the right medication in the right container every time.
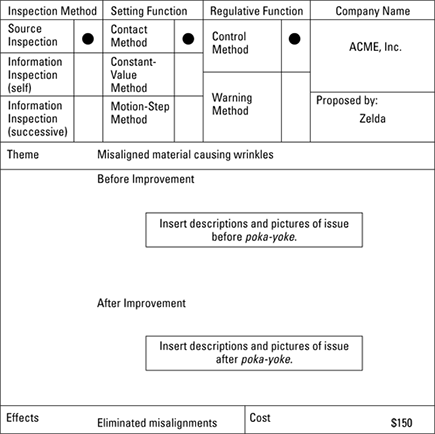
Figure 11-5 is an example of a poke-yoke worksheet — a reference tool that can help you prevent mistakes.
Devising flexible and reliable equipment
When you no longer can hide behind inventory and waste, the role of your equipment becomes more important. It must be ready and functioning properly when you need it. You’ll also need to change how you design and purchase equipment for modular manufacturing: you want to find the smallest, simplest, most flexible equipment that fits the job and meets your customer’s requirements.
Remember that your goal is to be able to make the full complement of product mix every day, so your equipment has to be able to be changed-over very quickly.
Maintaining the equipment
Total Productive Maintenance (TPM) is a method for ensuring you maximize productivity while ensuring equipment and tooling is fully maintained. TPM is divided into three areas:
![]() Autonomous maintenance: Autonomous maintenance means that as part of the operations within a work module, the work team performs their own routine maintenance tasks. This frees up the more skilled maintenance trades to focus on more specialized planned and predictive maintenance activities. Use standardized work descriptions for the maintenance tasks so the operators can safely perform regular maintenance at the proper time.
Autonomous maintenance: Autonomous maintenance means that as part of the operations within a work module, the work team performs their own routine maintenance tasks. This frees up the more skilled maintenance trades to focus on more specialized planned and predictive maintenance activities. Use standardized work descriptions for the maintenance tasks so the operators can safely perform regular maintenance at the proper time.
![]() Planned maintenance: Because major, high-risk, or high-wear components must be serviced and even occasionally replaced, you proactively schedule equipment, tooling and fixtures to be taken out of service. This planned maintenance is vital in a Lean environment. As you replace components, collect data to develop potential predictive failure scenarios. You can use the data tools in Chapter 12 to understand the performance of the components from a statistical perspective. You then can use this information to create predictive maintenance routines.
Planned maintenance: Because major, high-risk, or high-wear components must be serviced and even occasionally replaced, you proactively schedule equipment, tooling and fixtures to be taken out of service. This planned maintenance is vital in a Lean environment. As you replace components, collect data to develop potential predictive failure scenarios. You can use the data tools in Chapter 12 to understand the performance of the components from a statistical perspective. You then can use this information to create predictive maintenance routines.
![]() Predictive maintenance: If you can anticipate failures, you can better manage people and control costs by performing maintenance activities at just the right time — not just the scheduled time. This is predictive maintenance. You can also identify which parts and what quantity to keep in inventory for routine maintenance, planned maintenance, and emergency response.
Predictive maintenance: If you can anticipate failures, you can better manage people and control costs by performing maintenance activities at just the right time — not just the scheduled time. This is predictive maintenance. You can also identify which parts and what quantity to keep in inventory for routine maintenance, planned maintenance, and emergency response.
Figure 11-5: A poka-yoke tracking sheet.
The aim of TPM is to maximize the Overall Equipment Efficiency (OEE) and minimize production losses due to equipment failure or malfunction. OEE is a performance metric tracked on the Balanced Scorecard, especially for manufacturing organizations. It is calculated like this:
OEE% = Availability × Performance Rate × Quality
Even with the best TPM plan in the world, unexpected downtime will still happen. Create emergency response teams who respond at the flash of an andon light. These teams should have standardized work descriptions and diagnostic checklists to follow.
Mastering the quick change
What do an actor between entrances, a Formula 1 team in the pits, and a stamping press in a factory all have in common? All of them must use quick-change techniques to be successful. In Lean, quick changeover is known as SMED, which is short for single-minute exchange of die. In this case, the die refers to a tool that cuts or forms material in some type of press or a forging device. The die has to be reconfigured in order to make a new product, and the goal is to complete the changeover in just one minute. From this original use, the term SMED has come to mean any quick setup process or other reduction of setup time. The aim is to minimize downtime or lost time between the end of one activity or product and the beginning of the next. In Chapter 16 you find an example of how SMED is used to reduce the changeover time in operating rooms of a hospital.
When evaluating your changeovers, use video to record what is happening. It will help you to identify what actions you can eliminate or move off-line. You can also share your videos with other teams who have similar processes.
Here’s how to organize a quick change:
1. List all the steps, required tools, and materials to change from one thing to the next.
2. Identify which activities can be done before or after the change (offline, or external, activities) and which must be done in the moment (online, or internal, activities).
3. Create standardized work for all offline activities. Organize tools and material offline to support the online ones.
4. Refine and standardize the online activities to minimize lost time.
5. Constantly evaluate the performance of the overall changeover process to improve the performance time and eliminate waste.
For the Formula 1 pit crew, fractions of seconds in the pit can mean the difference between victory and defeat. For the theater actor, fractions of seconds can be the difference between a missed entrance and a stellar performance. For the factory, implementing quick setup enables production of the full complement of products every day — ultimately the difference between the product or service availability that means a satisfied or dissatisfied customer.
Pull
We tell you about flow tools and pull tools in the same chapter because they work in harmony with one other to keep the entire value stream moving toward the customer at the rate the customer consumes. You can’t have flow linked to customer demand without pull and vice versa. All the tools in this section make the system work better, with minimal waste.
Smoothing out the bumps
To provide the customer with what they want, when they want it, while keeping the value stream flowing at a steady pace, you need to smooth out the production schedules. This concept is known as heijunka, which means “production smoothing, leveling, or level scheduling.” The concept is this: Instead of making large batches of one product and then storing them in a warehouse until the customer orders them, ideally you make an amount of all the products, every day, as the customer consumes them.
The faster the changeover times (SMED — see “Mastering the quick change,” earlier in this chapter), the easier it will be to smooth out production.
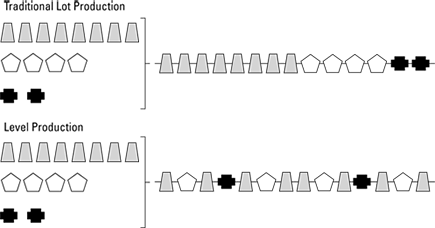
Figure 11-6 contrasts traditional lot production with level production. The same amount and type of product is made in each scenario. Notice that in level production, the various products are interspersed, throughout the sequence.
The calculation of the optimal sequence is a complex algorithm. It is based on cycle times, available work hours, setup times, and demand. You can use software to help you with production optimization; some ERP systems as well as specialized software will help you determine your optimal mix.
Production smoothing protects the suppliers in the value stream from the bull-whip effect, where small fluctuations from the customer end can translate into radical volume swings in the supplier community.
Figure 11-6: Lot versus level production.
Signaling replenishment
In a Lean environment, you don’t use forecasted demand schedules — these represent pushing production. Forecast schedules are typically only broad indicators; they don’t usually correlate well with actual customer demand. In Lean, the value stream is signaled to action through a real demand indicator known as a kanban.
Creating kanban
A kanban signal can come in many forms — a card, a buzzer, a light, a computer-generated signal, or even an empty space or container that needs filling. You determine the most effective kanban for each specific application. In a work module that is relatively balanced, the empty space may be the best solution. With the supply base, the electronic kanban card may be the most effective method. Whatever method you use, the kanban must signal how much, and of what part, needs to be delivered to what location.
Using the philosophy of “take one, make one,” as inventory is consumed, the signal (kanban) is sent upstream to call for replenishment activities. One common way to think about kanban is the two-bin system: It’s like batters in baseball — one at the plate and one on deck.
The number of kanbans you need is a function of the average demand per unit of time — usually daily — total time and container capacity. The calculation is as follows:
Number of Kanbans = ([Average Demand (Time)] × [OC + PT + TT] × [1 + BT]) ÷ CC
where:
![]() OC = Order Cycle
OC = Order Cycle
![]() PT = Processing Time
PT = Processing Time
![]() TT = Transit Time
TT = Transit Time
![]() BT = Buffer Time (not over 10 percent)
BT = Buffer Time (not over 10 percent)
![]() CC = Container Capacity (not more than 10 percent of Average Demand)
CC = Container Capacity (not more than 10 percent of Average Demand)
![]() Average Demand is a function of Time (daily, weekly, monthly, quarterly, and so on)
Average Demand is a function of Time (daily, weekly, monthly, quarterly, and so on)
In manual processing, a heijunka box is designed to house the kanban cards related to the production sequence. Slots that represent a specific part number and increment of time during the day contain the kanban for the parts to be made during that time. In automated processing, this function is performed with queues in a workflow.
Controlling inventory with supermarkets
Sometimes, because of monuments or other process constraints, you cannot have a continuous-flow system. When this happens, you create what’s called a supermarket. A supermarket is like your corner grocery, in that every item has a designated location and amount. The inventory is tightly controlled and kanban signals are used when a “customer” makes a “purchase” from the store. The supplying operation is the owner of the supermarket. The kanban signals the replenishment upstream.
Supermarkets should be located to minimize the “transportation” waste of excess travel. It’s better if you don’t have to use them, but sometimes you can’t avoid it. If you implement supermarkets, you must control them; if not, you may find you’ve given away the store!
Planning for Every Part — PFEP
Plan for Every Part (PFEP) is a master planning document (usually in the form of a database or spreadsheet) used to plan where raw material, supplies, parts, and/or products are to be stored within the facility. The PFEP is also used to create the overall logistics plan. The planning information includes the stock number, part name, inventory levels (minimum and maximum), method of transportation and the storage locations (supermarket, central warehouse, point of use, and so on).
Connecting ERP and kanban
Kanban is considered to be somewhat the opposite of Material Requirements Planning/Enterprise Resource Planning (MRP/ERP) planning systems. Kanban is a pull system, and ERP/MRP is a push system. Each has its advantages.
For example, when you use kanban, you don’t need system-generated demand forecasting. But you still must maintain accurate business records. ERP uses a records management technique to relieve inventory called backflushing, where the stock of a part or component is presumed to be reduced by one each time a part is made or a work order is booked. It’s easy, but prone to error. Not all experts agree that backflushing is the best way to maintain the inventory records. You have to decide the best method of data management for your organization. Whatever method you use, approach it with the mindset of eliminating waste to find the most effective solution for the organization.
Moving to pull scheduling will require changes to your current scheduling processes — remember that you’re working to eliminate waste, and some of what you have historically viewed as value added scheduling was really type-1 muda (see Chapter 2).
Be sure to coordinate your ERP/MRP order parameters with your demand timing. Failure to do this could result in excess orders to the supply community.
If you are using an MRP system, you must coordinate with your suppliers to make sure that they understand your discrete order requirements. For example, if you need your supplier to ship 1,000 parts every week on Tuesday, they must comply with that requirement. If they do not understand the requirements and ship to a different rhythm, it could invalidate your logistical plan, create inaccuracies in the system, and ultimately cost you money.
Changing logistics
When you’re operating in a Lean system, you have to rethink the way you approach logistics. Traditionally, a supplier might send a truckload of stuff “whenever.” Instead, set up your organization for success by implementing creative logistical solutions, aimed at supplying you with what you need, when you need it, in the quantity you need it.
Collecting from multiple suppliers: The milk run
Sending a truck on a fixed route at pre-determined times to collect product from a several suppliers is known as a milk run. Instead of having to deal with many partially loaded trucks at your facility, you can attend to fewer shipments, which contain a predictable load and arrival time. The milk run is generally used for suppliers near your facility — within four hours is a good guideline to use.
Shipping less than truckload (LTL)
LTL shipments, if done correctly, can be cheaper than waiting to cube out full trucks. (Cube out is the process of maximizing shipping density of a load in a semi-trailer.). LTL shipments are used when the suppliers are not located in a place that you can feasibly construct milk runs.
Delivery windows
Delivery windows enhance the both the predictability and stability of incoming materials. To establish a delivery window, you schedule suppliers to deliver a specified amount of product, to a specified location or dock, within a specific window of time. In many industries, these are governed by service-level agreements (SLAs), and failure to comply with the delivery windows may result in hefty fines to the supplier or even loss of the business.
Delivery routes
Delivery routes dictate the timing, location, and amount of material moved within the value stream. Delivery routes help to regulate the pace of the material flow. Think of a city bus route — it’s like a delivery route. People are moved through a city by a bus that picks up and drops off passengers at set locations according to an established time schedule as signaled by passengers at the bus stop (a kanban). In a product manufacturing environment, material is moved by a specific type of equipment, according to a set schedule, to established locations as signaled by kanban.
Using the Plan for Every Part (PFEP) tool and a facility layout will help you to establish your delivery routes.
Global considerations
In today’s world, you need to look beyond your own city, region, country, or even hemisphere when planning logistics. It is best if parts are made near your facility, within a one-day drive, but this may not be practical in today’s global environment. Parts may come from anywhere in the world. By performing a total cost analysis on your components, including the evaluation of various shipping methods, you can arrive at the best option. If you decide that your parts coming on a slow boat from China is the best solution, then you can consider the material in transit as buffer stock. Although not a traditional application of pure Lean, this solution enables the system to still flow.
Assuming that the overseas supplier is the cheapest option is not always the case. Evaluate the total cost picture to make the best selection.
Supply chain visibility and management software can help you mitigate your risk to disruptions. Increasingly, manufacturers and logistics companies are developing “control towers” that enable them to see worldwide demand and flow and make adjustments instantly. This requires information to be gathered from sources worldwide, as well as access to global order management systems.
..................Content has been hidden....................
You can't read the all page of ebook, please click here login for view all page.