
Chapter 21. Test Presentation
“Ring the bells that still can ring
Forget your perfect offering.
There is a crack in everything,
That’s how the light gets in.”
Leonard Cohen
There is no perfect way of writing a test or a table. Alternative ways are presented here.
Customer Understood Tables
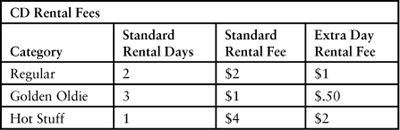
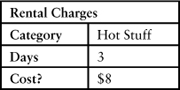
The key in selecting the form of a table is to pick the one that the customer unit most easily understands. For example, here is the business rule table for rental fees.
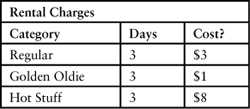
There are various ways you can document the tests for this table. You can have a standard calculation-style table, such as this.
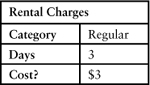
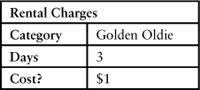
Alternatively, you could have an individual table for each computation, as here.
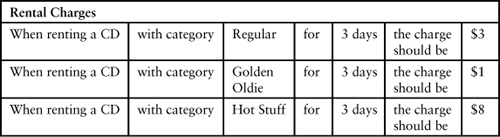
There are forms of tables with labels that make the test read almost like a sentence.1
You do not need to use the same style table in all tests. The triad should select the one most appropriate to the behavior being tested. In case of a disagreement, the decision should be deferred to the customer unit.
Table Versus Text
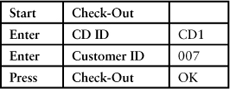
The tests in this book have used tables to indicate the setups, actions, and expected results. If the customer prefers, the tests can be expressed in pure text. For example, the previous actions could be written as follows.
Specifying Multiple Actions
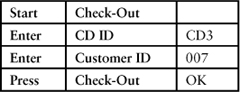
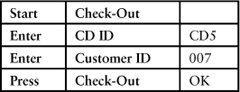
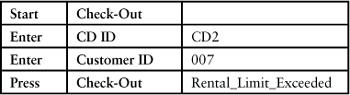
Sam’s application has the business rule that a customer should not be allowed to rent another CD after that customer exceeds the rental limit. You could show this test as a sequence of action tables, such as this.
CD Rental Limit Reached
Given these rentals:
First rental:
Second rental:
Third rental:
Then the next rental should fail:
Fourth rental:
Alternatively, you can specify all the actions in a calculation-style table. This reduces the size of the test and can make it more understandable to all members of the triad.
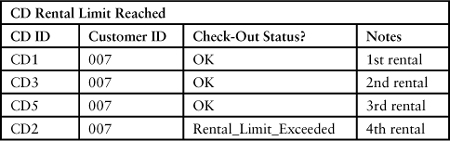
In the first version, the notes appear before each table. In this version, those notes are included in the table to explain each step in the test.
Complex Data
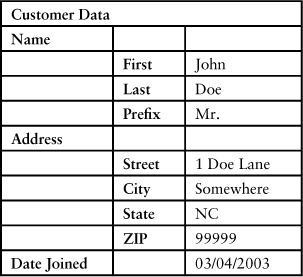
An embedded table can show the individual parts of particular columns. For example, a customer with a name and an address that have individual parts could be shown with embedded tables, as here.

Another way of representing parts such as the address is to use a different organization of the table. Each column represents a different level. As shown below, the leftmost column is the topmost level. The next column breaks the level into its parts. The rightmost column contains the values for each element.
Custom Table Forms
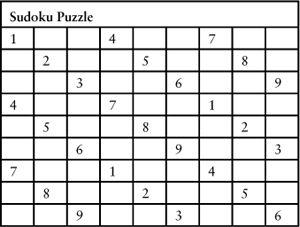
The tables in the test can represent whatever is most appropriate for the application. If you were creating an acceptance test for an application that solves Sudoku puzzles, you might have an input table that looked like this.
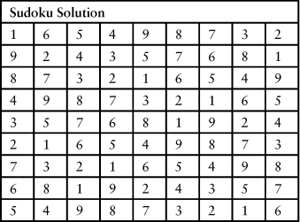
The output table would look like the following.
You might also have a test in which the puzzle has no solution or has multiple possible solutions to see if the results match your expectation. A tester like Tom might create a puzzle that has thousands of possible results or one that has only a single digit in it to see how long it takes to get all the possible solutions.
In any event, the form of the test should be as compatible as possible with the way the customer unit deals with the functionality.
Summary
• Use the form of the table that is easiest for the customer unit to understand.
• If a standard table form is unsuitable, create a table form that is more appropriate for the test.