
A bar chart displays a list of categories associated with values represented by the length of the bars. To create a simple bar chart, we need a list of categories, as well as list of values.
Let's create a simple chart to display the volume of water in each ocean. We will need an array of categories, as follows:
const labels = ["Arctic", "North Atlantic", "South Atlantic",
                "Indian", "North Pacific", "South Pacific",
                "Southern"];
In addition, we will also need a corresponding array of values, as follows:
const volumes = [18750,146000,160000,264000,341000,329000,71800]; // 10^3 km3
The data object should contain a labels property, which will refer to the categories array, and a datasets property, which contains an array with at least one dataset object. Each dataset object has a label property, and a data property, which will receive the data for our chart (the volumes array), as follows:
const dataObj = {
     labels: labels,
     datasets: [
         {
             label: "Volume",
             data: volumes
         }
     ]
}
Charts already come preconfigured with scales, axes, default colors, fonts, animation, and tooltips. Include the dataObj object from the preceding code as the data property of the chart object (chartObj), and you will have an interactive and responsive bar chart similar to the one shown as follows:
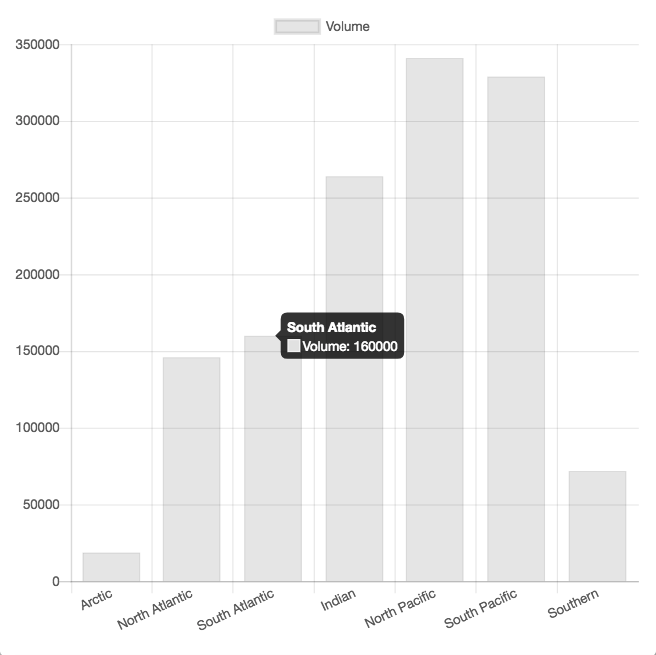
Try resizing the window and see how the labels and scales adapt to the new display. Move your mouse over the bars and see how the tooltips display the chart's information. Click on the dataset label and toggle its visibility. In the following sections, we will configure some of its appearance and behavior.
The full listing is shown as follows:
 <!DOCTYPE html>
 <html lang="en">
 <head>
 <script src="https://cdnjs.cloudflare.com/ajax/libs/Chart.js/2.7.2/Chart.min.js">
 </script>
 </head>
 <body>
 <canvas id="ocean-volume-bar-chart" width="400" height="400"></canvas>
 <script>
   const labels = ["Arctic", "North Atlantic", "South Atlantic",
                   "Indian", "North Pacific", "South Pacific", "Southern"];
   const volumes = [18750,146000,160000,264000,341000,329000,71800];

   const dataObj = {
       labels: labels,
       datasets: [
           {
               label: "Volume",
               data: volumes
           }
       ]
   }
   new Chart("ocean-volume-bar-chart", {type: "bar", data: dataObj});
  </script>
 </body>
 </html>
Try typing in the preceding code in your development environment, or download it from Pages/BarChart1.html.