
1. REAP (Retail Ecosystem Analytics Process)
The research and analyses detailed throughout this book provide valuable data on how shoppers behave in stores and why. But, without a defined means of transforming that data into insights and action plans that are implemented, the data is of marginal value. Implementing REAP (Retail Ecosystem Analytics Process) is central to the development of the shopper intimacy that drives consistent results.
Utilizing REAP to Deliver Consistent Results
The key elements of REAP are
• Use of data and analyses to define targets
• Focus on servicing the defined shopper’s needs
• Translation of the targeted shopper needs into strategy and action plans
• Full involvement of all the retail marketing disciplines
• Continuous feedback and analysis to refine and enhance future executions
The successful implementation of REAP requires
• Analyses of the retail opportunity from all angles
• Definition and segmentation of opportunities for analyses and development
• Implementation of formal procedures for delivering consistent results
Analysis
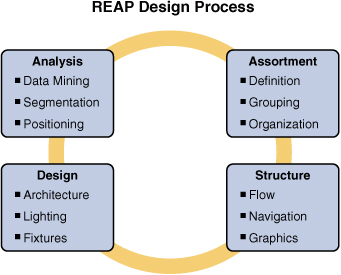
REAP begins with a thorough analysis in which we mine the existing data, segment our targeted shoppers, and then develop the ideal positioning to best serve the targeted segments. The data mining includes an examination of all the available information sources including syndicated data, loyalty cards, house credit cards, in-store studies, and focus group research. We use that data to develop a profile of the various customer segments that shop our locations and then focus on the segments we want to develop as a point of focus. This segmentation, when combined with the research analyses, unearths the key drivers for the most desirable segments and the ideal positioning to best serve targeted customers’ needs.
Assortment
With our positioning goal in place, we define our product, establish product groupings that support the targeted shopping groups’ objectives in visiting our stores, and then organize these groupings for efficient shopping. Our product definition includes an understanding of the items that shoppers need to complete their shopping mission. Proper product grouping leverages the shift from a passive journey through the store to an active purchase consideration so that related items are seen, evaluated, and purchased. Well-executed organization optimizes the return generated from each customers’ visit by directing customers through a shopping path that supports the efficient completion of their tasks in our store.
Structure
Next we structure our conversation with shoppers by guiding them from a general orientation to an eventual purchase decision. At a macro level we design the flow of the store to guide their navigation through the physical space with appropriate graphics and signposts. Understanding that shoppers predominantly follow the path we establish, we want to reward their choice by making our flow and navigation intuitive in anticipating their needs on this shopping mission. At the same time, we want to create a controlled interruption of the potentially rote shopping expedition to generate incremental revenue. The graphics and guideposts we employ should support the shopping process on multiple levels (logical, emotional, and so on) and reduce shopper’s stress level by providing the right type of information so that they are open to more of our marketing messages.
Design
The design process encompasses all the executional elements of the plan including the architecture, store lighting, and merchandising fixtures. Each of these is designed to support the strategic goal of anticipating shopper needs and facilitating their purchase decisions (see Figure 1.1).
Figure 1.1 REAP Design Process
Constituency Inclusion
Throughout the design process, the shopper is at the center of our thought universe. However, we must also understand the needs and input from all the participants in the retail marketing equation: retailers, brands, and agencies.
As we refine our shopper analysis and develop a profile of our targeted shopper segments, we must recognize that the behavior of defined groups within stores will vary based on a variety of factors associated with the specific shopping occasion such as the shopping objective; (major shopping trip or fill-in visit) or the addition of others to the shopping party (spouse, friend, child, and so on).
For example, if we target harried young mothers and seek to build store loyalty, we may want to
• Utilize an entrance area for quick meals on the go—she can quickly pass through the area on her major shopping trips, but will appreciate the convenience if she wants to pick up a meal on her way home from work or a family event.
• Add special check-out lanes with a kid-friendly/mom-approved product assortment in identified lanes to remove a potential irritant.
• Reward the inclusion of a child on a store visit with a small gift so that the youngest family members look forward to the visit and family shopping becomes a pleasant experience (also understanding that shoppers with children tend to purchase more than those without children).
The key is to use the research and analyses to define your most valued shoppers’ segments and understand their needs on different visits. Armed with this understanding, build your programs to anticipate and meet those needs.
For agencies and brand marketers, it is essential to fully appreciate retailer issues and goals. Retailers are oriented toward a consideration of brands based on what they can provide in terms of
• Influencing the shopper’s choice of channel and specific retailer
• Driving the shopper’s choice of shopping outlet
• Impact on store positioning and store brand promise
• Effect on total category purchases
Agencies and marketers must further appreciate the different concerns of the multiple constituencies within the retailer. They must understand the interplay between brands within and between related segments. Winning programs focus on driving total store or total category sales versus trading dollars within the store or category.
Retailers and agencies must, likewise, fully appreciate brand objectives to be met at retail. They must evaluate and understand the interplay between channel preferences for brand purchases and the impact brands have on the total shopping basket. They must also appreciate the differing needs of the constituencies within brand organizations. Winning retailers leverage the power of the brand as a thought and labor-saving tool for shoppers in store so that shoppers are less fatigued and open to increasing the total size of their basket.
Agencies must work to understand the essential dynamics in store. They need to be a knowledge center for the intersection of the key players in the fulfillment of the shopper’s needs. They then need to apply creativity to the expression of the marketing programs that support important retail and brand goals while facilitating the shopper’s mission in store. Finally, they guide the implementation of the program through the involved constituencies and their intermediaries.
All parties work separately and together to deepen their insights and their relationships with consumers and shoppers. The development of this relationship includes
• Qualitative and quantitative analysis
• Understanding shopper dynamics by channel, outlet, segment, and shopping occasion
• The key drivers of the fall-off between intent and action
• Proprietary and syndicated research
Retailers possess a unique information source in their ownership of transaction data and shopper trip/household behavior from proprietary databases through loyalty and credit card programs; brands own singular data sources in their experience with multiple retailers and channels, and their proprietary research on customer interaction and preferences with brands and discrete product segments; agencies control a particular knowledge base with their work across brand and retail categories and their immersion in multiple geographies and grasp of the technical specifics of the marketing disciplines essential to successful program execution. Our ability to make sound marketing decisions is constrained by our access to relevant data and knowledge. Cooperation and collaboration dramatically increases the available knowledge and data improving our planning and the results they generate. This collaboration among the retail marketing resources should be a foregone conclusion.
In our early days in the industry, Mel Korn was a passionate advocate for collaboration among retailers, brands, agencies, and marketing at retail producers to optimize at-store campaigns—a point that seemed obvious. We did not fully appreciate the need for the advocacy until a chance conversation highlighted the norm for how programs were generally executed.
A display honored as the best of the year by POPAI, the industry’s nonprofit trade association, delivered a forceful brand message while also displaying the product beautifully. It was truly attention grabbing with bright colors, creative design and greatly increased ease of access to the product. Additionally, the fixture perfectly integrated with the general media campaign.
Upon congratulating the fixture producer, we were shocked when he burst into laughter and shared that the integration relied totally on a chance meeting with the general media agency in the client’s hallway. As the fixture producer was on his way to meet with the purchasing department, he gathered bits of information in a two-minute conversation with his agency counterparts who had just met with the brand team.
By sheer circumstance and skilled follow-up, they captured the essence of the TV ads in the retail campaign to drive a program that was a creative and business success.
Shopper Analysis Integration
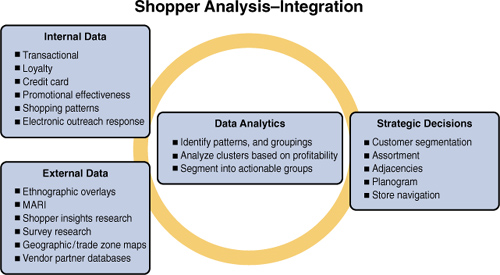
Today, integrated programs routinely integrate key data sources so that marketers can optimize their retail efforts. In this integrated process, they combine data from proprietary sources such as transactional data, loyalty programs, credit cards, advertising/promotional effectiveness tracking, shopping pattern analysis, electronic marketing results, and so on with external data such as ethnographic overlays, syndicated research (MARI, channel studies, and such), geographic/trade zone maps, brand partner databases and insights, and more.
This data is then analyzed to identify meaningful patterns and groupings. Further analysis of the clusters leads to the segmentation of actionable shopper groups based on profitability.
Cluster analysis informs a series of strategic decisions that drives subsequent choices related to assortment, adjacencies, planograms, store navigation, and so on (see Figure 1.2).
Figure 1.2 Shopper Analysis Integration
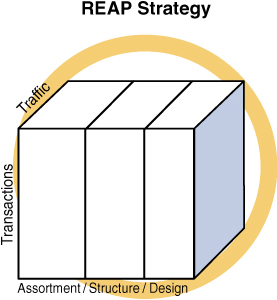
In completing their analysis, retailers may access syndicated research, account team interviews, store associate interviews, shopping basket diagnostics, current program reviews, competitive situation analyses, and retail audits. Brands may supplement these efforts with their own shopping basket analyses, reviews of their current program results, a trade-off analysis of the costs and benefits of alternative strategies, and insights from the syndicated and proprietary research to which they have access. Uniting these efforts creates synergy that increases program impact as compared to individually generated programs. Retail success is driven by traffic and transaction value. By involving agencies, brands, and retailers in the strategic discussion of how best to meet shoppers’ needs within a formal process that includes assortment, structure, and design, we significantly increase the impact and effectiveness of our programs (see Figure 1.3).
Retail Marketing Scorecards
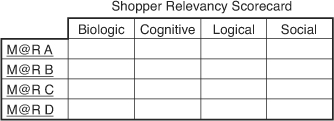
By routinely measuring results and analyzing campaigns within a formal process, we generate important insights that can improve results for future programs. The inclusion of academic research at the biologic, cognitive, logical, and social levels yields even more nuanced analyses and insight (see Figure 1.4).
Figure 1.4 Shopper Relevancy Scorecard
Likewise, we can examine the likely acceptance of the program by the various constituencies within the brand marketing organization (see Figure 1.5).
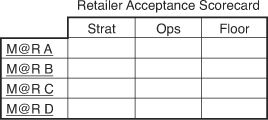
We can further consider our proposed program in terms of its likely implementation at retail by looking beyond the headquarters teams to appraise its acceptance by the field operations team and the floor personnel (see Figure 1.6).
Figure 1.5 Brand Acceptance Scorecard
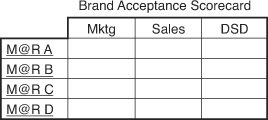
Figure 1.6 Retailer Acceptance Scorecard
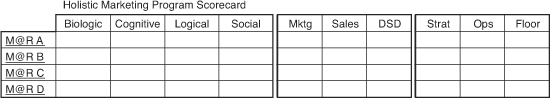
Integrating all these considerations, we maximize our odds of success and the likely impact of our program by evaluating programs against a holistic scorecard (see Figure 1.7).
Figure 1.7 Holistic Marketing Scorecard
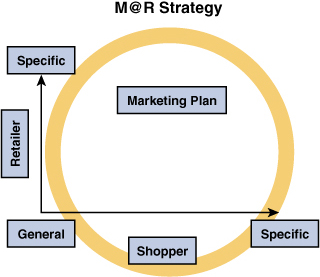
Segmentation Premiums
As we develop our strategy we recognize that, for retailing, the great middle has been lost with the death of the old homogenous mass markets. We operate in an environment that rewards the outstanding service of important, defined market segments and punishes the generic pursuit of a generalized middle ground (see Figure 1.8). The premium associated with excellence in specialization is evident in space productivity measures and comparative stock valuations. For instance, Whole Food delivers sales per square foot of $8821 and a stock valued at a five-year average price earnings ratio of 42.72 versus Kroger’s $466 per square foot3 and a price earnings ratio generally in the 11 to 12 range.4
Figure 1.8 Retail Marketing Strategy
Successfully identifying the segments you cultivate is a critical component of retail success deserving of careful consideration. Many standards have been used for shopper segmentation including demographic, ethnographic, psychographic, and usage criteria. Often, marketers combine traits to describe unique groups to be targeted based on a combination of characteristics that translates into a distinct profile. A key consideration when building targeted groups is that they must be meaningful aggregations that are discrete; that is, uniquely different from each other so that each shopper is placed in one group versus multiple segments. We must also reach the identified groupings so that the plans developed are actionable. Brands should segment their channels to service their customers across the shopping universe and then collaborate with retailers within each channel. Successful collaboration yields sales increases whereas breakdowns result in lost opportunities.
Traditional Shopper Segmentation Traits
• Size
• Growth
• Composition
• Demographics
• Leisure pursuits
• Shopper versus user
• Shopping purpose
• Visit frequency
Case Studies
The following examples illustrate the application of these principles. The samples chosen illustrate the interplay of various elements of REAP to drive strategy formation and execution in the store.
Retailer Assortment Rationalization
A project with a major discounter provides a case study for the use of shopper segmentation to support strategic assortment decisions to increase revenue and profit. Working with category management teams from leading brands, the chain began to define the specific shopping segments it wanted to nurture and develop and then analyze the role different categories played in reaching that segment and supporting total chain profitability. The teams quickly focused on families with children as the most profitable segment. Data showed that this group visited the channel most frequently and spent the most money. Deeper analyses showed that the particular retailer was doing the worst job among key competitors in reaching this segment.
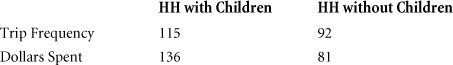
Focusing on this broadly defined target, the teams then studied the contents of shopping baskets for different items and categories. The team identified that a basket with detergent in it averaged eight items; the biggest shopping basket contained an item of children’s apparel; the second biggest basket had a toy in it; and, the most valuable shopping basket with a toy in it included a Barbie doll. By contrast a transaction with a case of motor oil was generally purchased by a man shopping alone, and the predominant share of transactions contained motor oil and nothing else.
Prior to the analysis, motor oil was featured in every weekly circular and held a prominent in-store display location. The marketing teams evaluated motor oil against the number of transactions and direct revenue generated from the ad. The thinking had been, even though the item was generally advertised as a loss, it generated tremendous traffic that yielded significant sales dollars. When this perspective was broadened to the total shopping basket, it was clear that oil delivered the wrong kind of traffic and that the category provided a negative impact on total store profitability. As a result, the line was de-emphasized and the advertising was invested in items and categories that would appeal to the newly identified target audience so that the featured items generated sales of other items of interest to the target.
An alternative approach that yielded poor results occurred at a big box general merchant. In an effort to improve profitability, groups, departments, and buyers were challenged to review their areas and make tough assortment decisions on items, categories, and departments based on their profitability. A number of intelligent decisions were made. However, because the shopper was not consistently placed at the center of the process at all levels, for a time a buyer decided to delist tennis balls that had a negative margin while continuing to carry tennis rackets that carried a high margin. The decision did not last long because you could obviously not be credible in the tennis market offering rackets without balls. This decision illustrates how easily bad decisions can be made when the perspective is not properly focused on serving the shopper.
Collaborative Failure
Although the focus on defining a shopper segment and then positioning categories and advertising to meet her needs was a consistent success generator, it did not always translate to all channels in different markets around the world. At Mattel, our analysis showed that roughly 50 percent of total toy sales occurred in the period from January to September and 50 percent from October to December. This ratio held in virtually every developed market around the world, except France. In France, toy distribution is dominated by hypermarkets, and each hypermarket followed a similar strategy in building a large toy presentation for the holiday season and then shrinking it to a small area in January. Beyond that, the channel overwhelmingly stocked these small departments with remnants and did not update the assortment until the subsequent holiday season. As a result, the relative share between the two selling periods was 33 percent and 67 percent.
Armed with the data on the relative value of families with children, the value of different shopping baskets containing items from different categories, and the consistency of shopping patterns from developed markets around the world, we made a compelling case for the competitive opportunity open to the retailer who focused on this segment and leveraged all the categories of interest against the targeted shopper segment to build a preference for their chain. Unfortunately, the argument was not successfully received and a significant opportunity remained unfulfilled.
Brand Channel Segmentation
Just as retailers can apply segmentation analyses to target and develop groups of shoppers, brands can segment and target channels and chains to support their goals for reaching and servicing their customers.
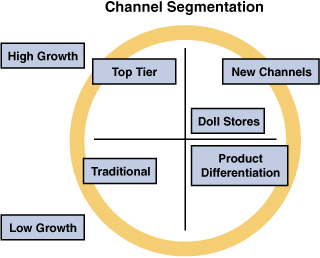
Mattel faced a situation in which the growth and health of its business varied widely by segment. Its specialty business, primarily in doll stores, was strong; however, the mass business broke into an expanding business for its largest accounts, who were growing and capturing share, and a contracting business for the traditional outlets that were losing share. This share loss was across all categories of merchandise as strong regional players gave way to national behemoths. The eventual strategy was to maintain support for the shrinking accounts but recognize that it could not overcome the larger market forces to move into a growth position. Simultaneously, Mattel would work to become more intertwined with driving the total business for the largest accounts while, at the same time, focusing on opening new channels of distribution (see Figure 1.9).
The result was growth in its total business by reaching more customers where they were shopping. The doll store business remained stable while the decline of the traditional accounts was managed.
Figure 1.9 Channel Segmentation
Shopper Psychographic Segmentation
In addition to the broad shopper segmentation discussed in the discount store example, we can apply a more detailed shopper segmentation that uses a psychographic profile to identify and target shopper groups. In this type of segmentation, we broaden our view to consider a vast array of possibilities before settling on the key elements that drive performance and drive our strategy.
We begin by identifying a variety of potential traits. The possibilities could number in the hundreds as long as they are identifiable, discrete, measurable, and actionable. Potential distinctions could include attitudes, behaviors, demographics, media habits, and so on. These traits are then tested to isolate the key predictors that drive performance and profitability at retail. Shoppers are then broken into separate clusters with a quantification of their key differences and preferences. This cluster analysis is then utilized to develop retail strategy with an ideal positioning carried through all the key marketing elements inside and outside the store, using the design process previously outlined. The strategy is then implemented with measurement and further refinement (see Figure 1.10).
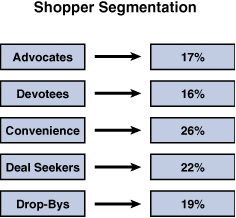
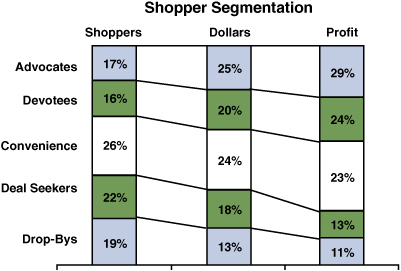
A hypothetical example from the grocery channel illustrates the process. As a first step, we divide the shoppers who visit our chain into customer segments defined not by demographics but by their relationship to the store. In this analysis we have advocates, who are dedicated to fresh food and shop the chain religiously. They visit at a rate higher than the norm and buy almost all their products from us. Devotees are dedicated to the store and buy most of their needs from us, but they do not shop as frequently as our advocates, and they do not buy as a high a percentage of their total food needs from us. Convenience shoppers purchase select items from us when we fit with their schedule. Deal seekers pore over the weekly circulars and shop our stores when they see items on promotion that fit with their planned purchases for the week. Drop-bys visit the store only occasionally. Figure 1.11 breaks out the percentage of shoppers by category.
Figure 1.10 Psychographic Segmentation Process
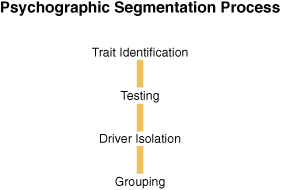
Figure 1.11 Shopper Segmentation
Having identified the relevant shopper segments, we then measure the share of sales and total profit associated with each group. The highly desirable clusters that included advocates, devotees, and convenience shoppers indexed at more than twice the profitability of deal seeker shoppers and drop-bys. The net is that, although the desirable segments represent 59 percent of the market, they deliver 76 percent of total revenue and 86 percent of the profit (see Figure 1.12).
Figure 1.12 Segmentation Profit Impact
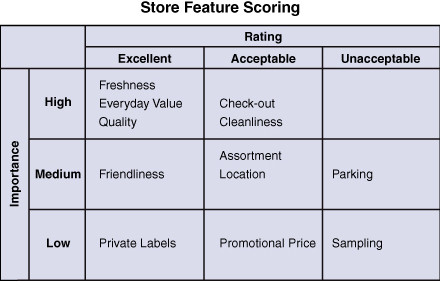
From there we define the key retailer attributes that influence the choice of retail outlet for the targeted shopper segments and break the attributes into categories based on their level of importance in the decision-making process, as shown in Figure 1.13. In our example, important retail attributes include freshness, everyday value, quality, check-out speed, and cleanliness. Moderately important features included staff friendliness, assortment, and store location. For the key shoppers, private labels, promotional prices, and sampling were not important. Understanding the factors that mattered most to the shoppers we want to attract and retain, we then measure competitive performance to define areas of excellence and opportunities. With a full understanding of who is important to us, what is important to them, and how they see us in the competitive context, we can build a strategy that resonates with the targeted groups.
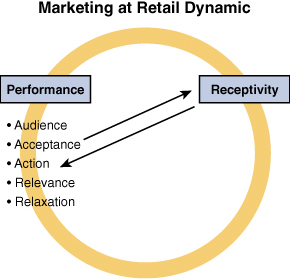
Earlier in our analysis we laid out the essential retail marketing dynamic in which performance is a function of the audience we attract, their acceptance of our message, and our persuasiveness in converting the shopper’s openness into action.
Performance = (Audience × Acceptance) × Conversion
Figure 1.13 Store Feature Scoring
The acceptance of our marketing and product offerings is a function of the receptivity of the shopper, which is in turn driven by the relevancy of the stimuli we offer and the relaxation of the shopper.
Acceptance ![]() Receptivity = Relevance + Relaxation
Receptivity = Relevance + Relaxation
By segmenting the universe of potential shoppers into the groups that will drive our profitability and then understanding what is important to these groups and how we stack up against those key drivers, we identify a clear path to a winning strategy that can deliver consistently improved results (see Figure 1.14).
Figure 1.14 Retail Marketing Dynamic
Summary
REAP provides a formal process for translating research into an action plan that delivers sustainable results. The focus on the shopper needs and state of mind throughout the process provides a clear path to the achievement of shopper intimacy. The key elements of a successful REAP implementation are
• Definition of shopper needs
• Use of data analyses to establish targets
• Translation of shopper need by target group into strategy and action plans
• Full involvement of all retail marketing participants
• Continuous feedback and analyses to enhance future programs
Endnotes
1. Whole Foods (2008) Annual Report. June 14, 2010, http://www.wholefoodsmarket.com/company/pdfs/ar08.pdf
2. Miriam Marcus, Beyond Low Price-Earnings Ratios, Forbes.com, April 22, 2009. http://www.forbes.com/forbes/2009/0511/050-equity-value-sales-beyond-low-price-earnings.html
3. Kroger (2008) Annual Report. June 14, 2010, http://www.thekrogerco.com/finance/documents/2008_KrogerFactBook.pdf
4. http://finapps.forbes.com/finapps/jsp/finance/compinfo/Ratios.jsp?tkr=KR1DougAdams, “POP Measures Up: Learning from the Supermarket Class of Trade”, Washington, D.C., POPAI (2001), page 4.