
2. Measuring Marketing at Retail in Supermarkets
Overview
Research delivers levels of learning on shopper behavior in store
Although the need for research and actionable information is well accepted now, this was not always the case. In 1998, POPAI established a Measured Medium Initiative with the objective of establishing the store and the realm of retail marketing as a measured medium on par with the traditional media. The association set out to develop a common language for the medium that worked with the lexicon of general advertising, measured the marketing activity in the store, and tracked the shoppers’ interactions with products and marketing in store.
Research activity has continued, led by POPAI and then Nielsen, to prove the methodology, deliver learning in specific trade channels, define retail marketing dynamics, and generate the key metrics crucial to the execution of successful retail programs. Collectively, these organizations and the sponsors of the research have spent tens of millions of dollars generating data and insight into the key elements of executing effective campaigns.
Timeline
1998—POPAI establishes Measured Medium Initiative
1999—Methodology Pilot
2000/1—Supermarket Channel Study
2001/2—Convenience Channel Study
2006—MARI launched
2007—Nielsen’s PRISM and MARI field tests
2008—MARI Refinement
2009—MARI Phase 2
POPAI’s overall research project goals were to systematically measure1
• Proof of placement
• Cost effectiveness of audience delivery (reach, impressions, and CPM)
• Effectiveness of marketing at retail in increasing sales
The group anticipated that it would generate benefits for all industry participants by creating a platform for more informed decision making so that the medium would be properly valued and fully integrated into media planning, forecasting, and tracking. With this full integration into the marketing plan, further information would be gathered and shared to continually improve future programs.
Phase One—POPAI’s Channel Studies
The first phase of the research involved measuring shopper behavior in different key classes of trade. These efforts began with a systematic study of supermarkets.
Supermarket Study
Sales results tracked against type of display
POPAI’s pilot proved that it was possible to capture meaningful data at retail. POPAI then expanded its work to develop a base of knowledge for key channels of distribution. The research strategy was to focus on major distribution channels to expand and refine the methodology; to extract general learning that could assist all retail marketing participants; and to generate specific insights for study sponsors. Working with the study sponsors and major research organizations, POPAI undertook studies in supermarkets, pharmacies, and convenience stores.
The supermarket study was designed to establish precisely what was in each retail location and to track sales results over time for all brands and categories participating in the study. The retail audit portion of the program provided an accurate proof of placement measure and a catalog of the amount and type of marketing at retail material present in test stores; the second phase would then measure the impact of different types of marketing at retail on sales lift. In this study, retail marketing measurement was restricted to activity tied to product in the stores and did not include in-store networks or display activity supporting media messages for nonretail products or events.
The initial research was conducted during three 20-week test waves: from May through October 2000, August through December 2000, and October 2000 through February 2001. The study covered 250 retail locations including the top 15 chains, 30 strong regional competitors, and 10 independent retailers. The research was conducted by Prime Consulting Group and brand sponsors included Anheuser-Busch, Frito-Lay, Pepsi, Pfizer, Procter & Gamble, and Ralston-Purina so that data was captured for 90 brands in eight different categories. The study tracked activity at the UPC level for the categories of beer, salty snacks, cereal, upper respiratory care, dog food, carbonated beverages, hair care, and laundry. Specific data and insights related to their areas of participation were shared with the retail participants and program sponsors and a base of general knowledge was developed to be shared with the general marketing-at-retail community.
The study first established what was present within the store, defining the marketing materials measured and their specific location. Measurement was segmented against main shelf activity and free-standing displays. On the main shelf the researchers tracked the type of retail marketing present whereas, for free-standing units, the researchers also established where the display was positioned, the type of signage involved, and the form the marketing material took. Retail presence was tracked at the UPC level for all items within the brand, so that if the report indicates that a brand had retail marketing presence 25 percent of the time, it means that researchers found retail marketing support for at least one UPC for the brand during the reporting period (see Figure 2.1).2
Figure 2.1 Marketing Material Matrix
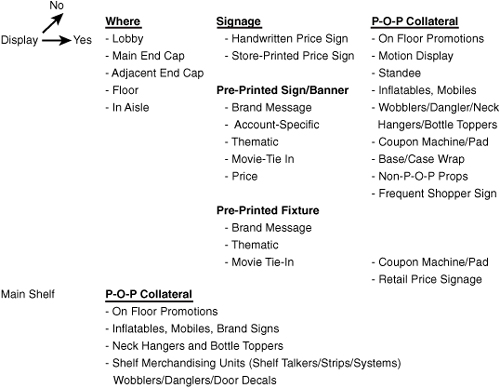
Source: POPAI (2001) POP Measures Up: Learnings from the Supermarket Class of Trade
The study involved more than 500,000 observations in store to categorize more than 130,000 marketing expressions tied to product sold in the retail locations. Analysts identified 78,058 out-of-main-category displays. Of these, 91.7% were supported with signage and 25.2% included collateral marketing material. In line, 12.7% of the 441,218 products measured offered some level of marketing support, totaling 56,036 unique iterations of brand marketing support (see Figure 2.2).3
Having a full audit of all material in the store, researchers turned their attention to the effect retail marketing had on sales results. Scan data and audit data were matched at the UPC level before statistical models were developed. The models incorporated current and historical factors influencing product movement including promotion, seasonality, and so on. Modeled results were then consolidated to the brand and category levels to produce the average results for each brand and category. Presence was defined as any marketing activity for any UPC within the brand; that is, if Brand A reports 35 percent coverage, it means that 35 percent of the time retail marketing support was present for at least one UPC for Brand A during the specified period. The sales effectiveness results capture the average sales increase or lift for the product group associated with the technique measured. By mapping the marketing activity over a wide range of stores in multiple geographies and three different time periods, the team measured the impact on sales and isolated key variables that drove results across broad categories of goods. This data was mined even further to provide specific learnings and insight to category sponsors.
Figure 2.2 Marketing Material Observation Breakout
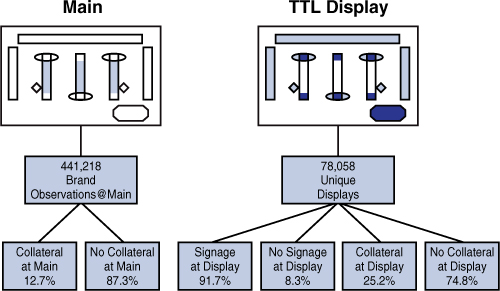
Source: POPAI (2001) POP Measures Up: Learnings from the Supermarket Class of Trade
Learning One: Retail Marketing Works
The key questions are, what does marketing at retail activity deliver, and how can results be improved? The data shows that, in general, marketing at retail works, but that results vary widely depending on category and execution. In total, marketing at retail material was present 27 percent of the time and delivered incremental sales lift greater than 1%, exclusively tied to retail marketing, for 41 percent of the messages in store.4
![]()
As with multiple areas of the research results, the variance between and within categories was substantial. Main-shelf campaigns varied from a 23% to 70% success rate; outpost efforts generated results ranging from 37% to 67% (see Figure 2.3).5
Figure 2.3 Increase Recap by Category
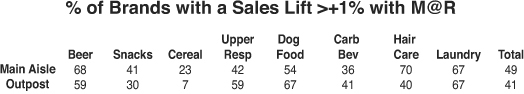
Source: POPAI (2001) POP Measures Up: Learnings from the Supermarket Class of Trade
The chart in Figure 2.4 further details the activity level and results by category for the application of one technique, shelf merchandising units at the main shelf. On average, merchandising units were present 37.5% of the time in these categories and generated a sales lift of 5.8%. However, the presence of these units ranged from 19.8% for beer to 54.3% for salty snacks, and the sales lift associated with them varied from a low of 3.8% for beer and 17.3% for laundry.6
Figure 2.4 Main Shelf Retail Marketing Increases
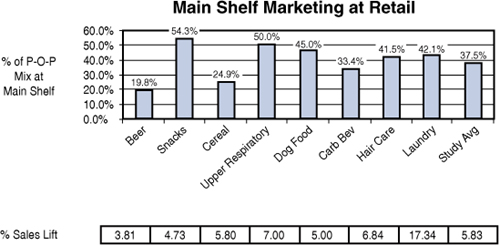
Source: POPAI (2001) POP Measures Up: Learnings from the Supermarket Class of Trade
Plotting the figures on a graph in Figure 2.5 yields an illuminating pictogram. In this case, the x axis represents out-of-aisle presentations; the y-axis is the presence of material at the main shelf. A horizontal line is drawn at 49% representing the study average for sale lifts above 1% for main-shelf campaigns and a vertical line at 41%—the average for outpost programs. Each category is then located according to its performance in each location, so that categories in the upper right were strong in both and those in the lower right were weak performers in each area. As observed throughout the research study, individual brands’ performance varied significantly from these category averages.7
Figure 2.5 Category Responsiveness by Location
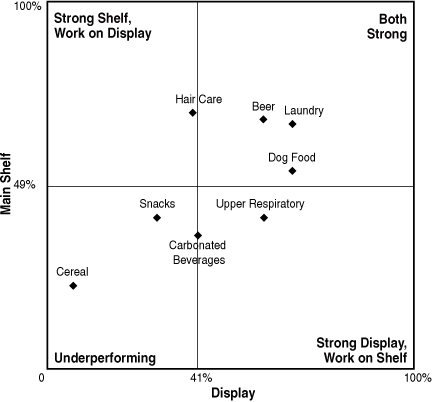
Source: POPAI (2001) POP Measures Up: Learnings from the Supermarket Class of Trade
Learning Two: Wide Variation in Execution and Results
Execution varied widely across retail chains. Results differed between retail chains, across categories at the same retail location, and within the same category. For example, a technique that worked extremely well in Category A was totally ineffective in Category B. In addition, the use of identical tactics within a category yielded vastly different results; that is, in upper respiratory brand sales, increases varied from 2 percent to 19 percent for the same material. The chart in Figure 2.6 recaps the performance of dual placement displays—positioning a product in both its main location and an out-of-main aisle display—and highlights the stunning variability between accounts. The chart recaps the activity for two categories across ten retailers during the same time period. Activity in Category 1 ranges from a low of 9% to a high of 82%; in Category 2, it varies from 0% to 60%.8
Figure 2.6 Responsiveness to Dual Placement Displays
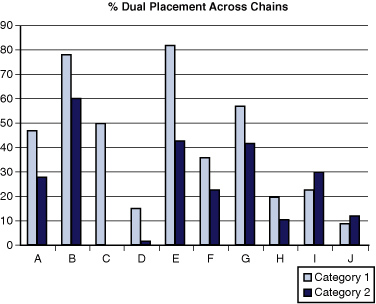
Source: POPAI (2001) POP Measures Up: Learnings from the Supermarket Class of Trade
Similarly, the variance in execution extends to the activity within categories, both at the same retailer and across retailers. Figure 2.7 shows that although overall category activity among these four retailers ranges from 9 percent to 30 percent, the activity within the category exhibits even more variance. Even though Retailer C has the highest overall activity for the category, support for Brand B is nonexistent. For the same brand, Retailer C delivers support at the 45% level—more than double the activity for the category as a whole.9
Figure 2.8 recaps the range of results recorded by type of marketing at retail treatment and location—main aisle versus outpost. For some techniques, such as main aisle coupon machines and pads or outpost danglers, the range of the recorded lift is tight, varying less than 1% between high and low. For others, such as main-shelf danglers or outpost non-POP treatments, the increases vary more than 10%. Likewise, the same technique can vary tremendously between main-shelf and outpost executions; that is, danglers generate a 4.1% to 4.9% lift in outpost displays and a 3.8% to 17% increase within the main aisle.10
Figure 2.7 Percentage of Displays with Brand Message
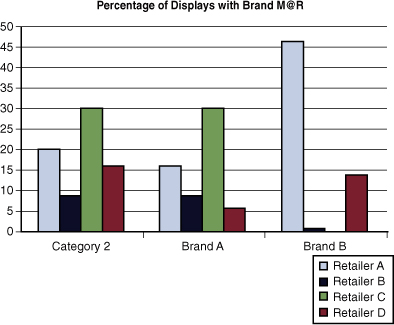
Source: POPAI (2001) POP Measures Up: Learnings from the Supermarket Class of Trade
Learning Three: Some Consistent Performance Areas
Despite tremendous variability on multiple levels, three techniques consistently performed across retailers and categories: the effectiveness of shelf merchandising units, retail price promotion signage, and the impact of combining the two most effective techniques within each category. Average brand sales lifts were as high as 17% for shelf merchandising units and 10% for promotional signage. When they were combined, sales increased between 14% and 27%. However, the most effective materials differed greatly between categories, as shown in Figure 2.9.11
Learning Four: Consistently Inconsistent Execution
Execution was not uniform across retailers or within retailers. Although the charts in Learning Two highlight the variability in the use of marketing at retail material across accounts, researchers observed a consistent suboptimization of retail marketing programs implemented at stores.
Figure 2.8 Lift Variance by Technique and Location
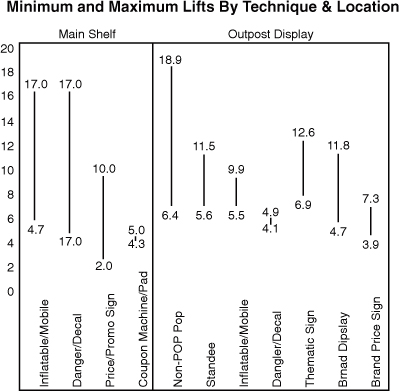
Source: POPAI (2001) POP Measures Up: Learnings from the Supermarket Class of Trade
Figure 2.9 Increases from Combination of Best Techniques
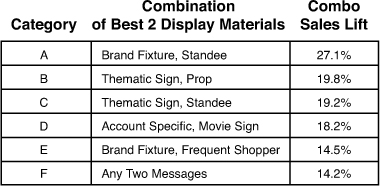
Source: POPAI (2001) POP Measures Up: Learnings from the Supermarket Class of Trade
This suboptimization took two forms:
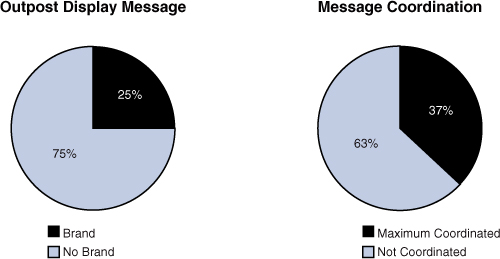
• Seventy-five percent of outpost displays contained no brand messaging.
• Where messaging was present in an outpost display, the message at shelf linked to the outpost message only 13% to 37% of time.
The absence of brand messaging represents a lost opportunity to connect emotionally with the shopper and reduces the interaction with the display; the lack of coordination in messaging signals an additional optimization loss for the shoppers who visited one location and not the other (see Figure 2.10).12
Figure 2.10 Message Coordination
Source: POPAI (2001) POP Measures Up: Learnings from the Supermarket Class of Trade
Learning Five: Major Category Shopping Variations Within Store
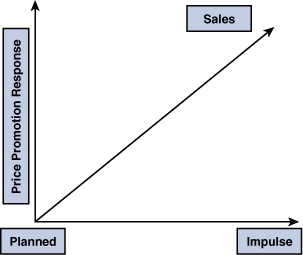
The ways shoppers consummate purchases within the store vary greatly by category. Some sections, such as health and beauty aids, generate the vast majority of their purchases within their core area; other categories, such as salty snacks, rely on outpost displays for a significant portion of their volume. Generally, the variation in out-of-category purchases correlated to the nature of the product—impulse-versus-planned purchase. The responsiveness to price promotion as a tactic was also higher for impulse-versus-planned purchases. Although this observation was noted, systematic measurement of the phenomenon by category was not recorded in this study (see Figure 2.11).
Figure 2.11 Price Savings Responsiveness
Learning Six: Accurate Measurement Possible
The impact of the marketing at retail material was assessed using sales response models developed by IRI that follow the pattern of standard statistical models used by leading brand marketers. The researchers statistically isolated the sales impact for the retail marketing material in outpost or main shelf displays to calculate the lift delivered by the material. They factored out the sales impact of other sales influencers including display location (such as endcap and feature location), price, promotion, seasonality, and so on to ensure measurement of only the retail marketing material impact. They evaluated each brand with its own response model and performed statistical tests to ensure reliability by brand. Where a sufficient number of executions for a particular technique existed, they derived lift measurements for each type of marketing at retail campaign. The research team also calculated the impact for various combinations that met the statistical modeling threshold for discrete executions in store. The average brand lift was then developed for each category by weighting brand results by volume (see Figure 2.12).13
Source: POPAI (2001) POP Measures Up: Learnings from the Supermarket Class of Trade
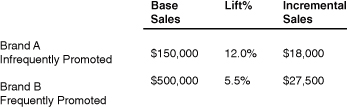
Learning Seven: Size Matters
The frequency of promotion and size of the brand promoted affected the reported results. In general, the lift percentage for marketing at retail campaigns was higher as a percentage for smaller, less frequently promoted brands and higher for large, heavily promoted items and categories. However, when evaluating the dollar return, the large, frequently promoted brands generally delivered higher absolute returns. The example in Figure 2.13 illustrates a typical example.
Figure 2.13 Increase Versus Volume Comparison
Source: POPAI (2001) POP Measures Up: Learnings from the Supermarket Class of Trade
Learning Eight: Lack of Systematic Measurement and Learning Culture
A lack of general understanding of the sales effectiveness of retail marketing executions underlies the wide execution variance at retail. This phenomenon includes execution between stores, within stores across categories, and within categories in the same store. It also drives the inconsistent execution of branded material and the lack of coordination in messaging between locations. Although some individual participants had a strong grasp of the efficacy of a particular execution, this knowledge was not widely shared throughout their own organizations or the retail marketing planning and execution chain. Although inextricably joined in the achievement of mutual success or failure, the community lacked a formal and ongoing measurement system in which data could be shared within the retail marketing ecosystem. The extension of this lack of systematic measurement is an absence of an orientation toward shared learning that could leverage results from current programs to collectively improve future executions.
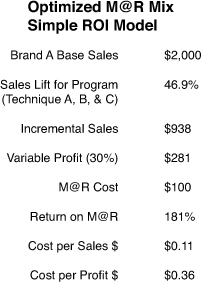
Learning Nine: Brand ROI Measurement Possible
By successfully isolating the impact of marketing at retail campaigns from other activity in the store, we can easily create simple return on investment (ROI) analyses. In Figure 2.14, we start with Brand A, which generates $2,000 in base sales per store. By executing a program with three elements (Techniques A, B, and C), the brand generates a 46.9% increase that translates into $938. Assuming a variable net profit contribution of 30%, the brand achieves $281 in incremental net profit dollars without including the cost of the retail marketing campaign. If the campaign had a cost of $100 per store, the ROI for the program would be 181% over the life of the program with a cost per sales dollar of 10.7 cents and a cost per variable profit dollar of 35.6 cents (see Figure 2.14).
Learning Ten: Significant Industry Opportunity
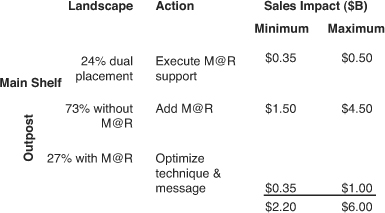
The final lesson drawn from the supermarket research is that the opportunity for the supermarket industry as a whole is significant. Extrapolating from the measured results, if the industry improved main aisle execution by consistently supporting promotion activity with retail marketing material support, the increase generated would be between $350 million and $500 million. If stores added retail marketing support to the existing outpost displays, revenue would increase between $1.5 billion and $4.5 billion. Finally, if the effectiveness of the 54% of retail marketing activity that does not work is made effective through better planning and execution, we would add another $350 million to $500 million in revenue. In total the return on these improvements could generate $2.2 to $6 billion in incremental revenue. The operative assumptions in the development of this estimate follow:
Source: POPAI (2001) POP Measures Up: Learnings from the Supermarket Class of Trade
• No new product display placements would be made; we would optimize only those already in place.
• Effective marketing at retail material would be placed on the shelf whenever products are displayed in an outpost location (dual placement).
• Effective marketing at retail material would be introduced where none existed on outpost displays.
• Ineffective marketing at retail programs would be remediated.
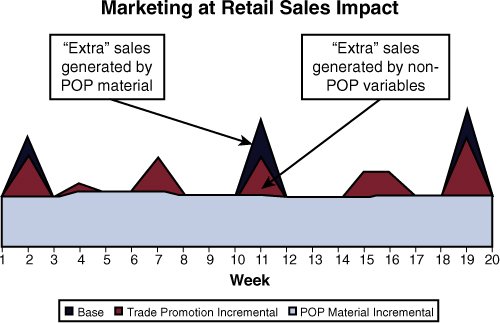
The study concluded that these results could be further enhanced through better study of the impact of messaging on sales results and adoption of a cycle of continuous learning (see Figure 2.15).14
Figure 2.15 Sales Impact from Optimized Execution
Source: POPAI (2001) POP Measures Up: Learnings from the Supermarket Class of Trade
The supermarket research program successfully applied the methodology developed in the pilot program and delivered a base of general learning about retail marketing within the supermarket channel by
• Accurately capturing retail marketing activity within the channel
• Measuring compliance and sales impact for retail marketing techniques by isolating the impact of specific elements
• Identifying basic performance drivers and capturing the variance in performance by marketing execution across brands
• Quantifying simple ROI measures on a brand basis and calculating the broad industry value of optimizing retail marketing without increasing product exposure or marketing expense
In addition to the specific insights provided to program sponsors and participants, the research also identified opportunities for the next round of research in developing a more precise audience measurement for the retail shopper audience and studying the impact of messaging variance on performance.
Endnotes
1. Doug Adams, “POP Measures Up: Learning from the Supermarket Class of Trade,” Washington, D.C., POPAI (2001), page 4.
2. Ibid., 16.
3. Ibid., 19, 27.
4. Ibid., 6, 14.
5. Ibid., 6.
6. Ibid., 21.
7. Ibid., 6.
8. Ibid., 10.
9. Ibid., 9.
10. Ibid., 38.
11. Ibid., 8.
12. Ibid., 8.
13. Ibid., 17.
14. Ibid., 14.