5. Establishing In-Store Marketing Measures
Retail Marketing Metrics
Concurrent with the channel research studies, POPAI partnered with Prime Consulting Group and the American Research Federation (ARF) to standardize the data methods and sources to support the planning and management of retail marketing efforts. Although the general media measures are not a precise fit with the store environment, the underlying concepts of the traditional media world were adapted for the retail marketing environment so that both could be governed by the same principles, and a common language for retail marketing was adopted, consistent with the principles used in the broader advertising community. Although many of the terms in this chapter might seem rudimentary to experienced general advertising professionals, they were often new to members of the retail marketing community, who were often accomplished industry leaders but had never dealt with these concepts.
Definitions
A brief recap of the language retail marketing now shares with the general advertising world includes the following terms1:
• Opportunity to See (OTS): A single opportunity to view an ad; this is used interchangeably with exposure and impression. A shopper who passes by a marketing execution in-store, and who therefore has an opportunity to see and interact with the message presented.
• Exposure: One person with an OTS, also called an impression.
• Audience: Total potential exposures or impressions for a specified media vehicle during a defined time period.
• Gross Rating Points (GRPs): Gross impressions as a percentage of the relevant population; also the sum of the rating points for a campaign or a specified portion of a campaign.
• Target Rating Points (TRPs): Target audience impressions as a percentage of the relevant target population.
• In-Store Rating Points (IRP): Gross in-store impressions as a percentage of the relevant population; also the sum of the rating points for a campaign or a specified portion of a campaign instore.
• Reach: Net percentage of target population with an opportunity to see for a given period of time.
• Frequency: Number of times a message is delivered to a target in a specified period of time, expressed as an average.
• Cost per Thousand (CPM): Cost of a vehicle or campaign divided by the total impressions, in thousands.
• Recency Theory: Advertising effectiveness increases as it gets closer to the purchase occasion.
• Accumulation rules for weekly or average weekly media measures:
• Impressions are additive across stores, chains, geographies, and time.
• Weekly Reach is not an additive. Duplications must be “netted out” or unduplicated. Reach can be weight-averaged.
• Potential Weekly Reach is the maximum reach achievable, assuming 100% store penetration.
• Actual Weekly Reach is potential reach adjusted to reflect the actual store penetration achieved, often referred to as proof of performance.
Potential Reach
Consider an illustrative example from the supermarket study:2
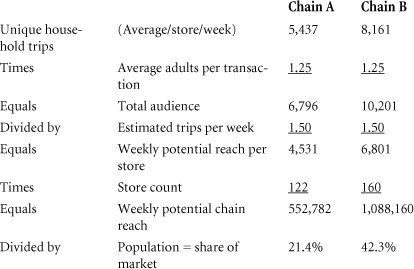
In this example, the recorded transactions per store per week were 5,437 and 8,161, respectively. The transactions were multiplied by the average number of adults per shopping trip (1.25), as observed in the store, to determine the total audience for the retail store. Traditional media models include a consideration of the number of times a consumer is exposed to a message within a defined time period. Our model uses industry averages from the Food Marketing Institute (FMI). Alternatively, frequency data can be calculated by using either household panel data or information from individual retailers; that is, loyalty cards. Our total audience is then divided by the average number of trips to this store per week (1.5) to calculate the weekly reach per store. Multiplying the result by the number of stores in each chain yields a weekly potential reach in each chain of 552,782 and 1,088,160. By comparing the weekly potential reach with the population in the market area, we can see that chain A covers 21.4% of the market, whereas chain B reaches 42.3%.
Actual Audience Reach
To determine the actual audience delivery, we need to factor in the level of in-store execution for the retail marketing that was actually delivered, as opposed to the level that was planned. During the supermarket study, Information Resources, Inc. (IRI) measured the compliance level.3 Currently, compliance or proof of performance must be measured by an outside service that would physically visit a panel of stores to build measurement data. As shown in the chain drug store study, RFID offers an exciting option for both increasing the breadth and depth of coverage while improving the timeliness of the information.
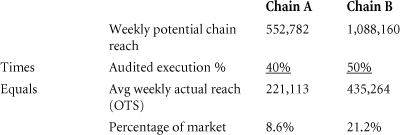
Continuing with our previous example, a signage program was executed in 40 percent of the stores in chain A and 50 percent of the time in chain B. Thus, the actual audience or opportunities to see were 221,113 and 435,264, respectively. It is interesting to note that in this example although chain B had 24 percent more stores, it delivered almost 2 1/2 times the audience as compared with chain A.
In-Store Rating Points
Building on our frequency and reach data, we move to a consideration of rating points. Traditional media measures gross rating points (the total impressions as a percentage of the measured population for a campaign) and target rating points (target audience impressions as a percentage of the relevant population). The In-Store Rating Points (IRP) provides a unique expression for retail marketing measurement of reach percentage times frequency.4
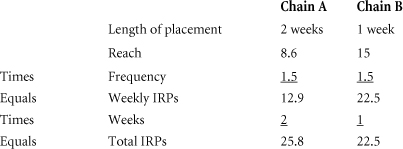
Continuing with our supermarket example, chain A executes a program for two weeks and chain B executes a program for one week: 8.6 percent of the market audience shops at chain A. They visit the store an average of 1.5 times per week, so the rating points (8.6%) are multiplied by the number of visits (1.5) to generate the weekly IRPs (12.9) per week. The advertising runs for two weeks, so the total of the IRPs is 25.8 percent. Chain B covers 15 percent of the market so their coverage (15 percent) multiplied by their frequency of visit (1.5) yields a weekly IRP of 22.5 per week.
Cost Per Thousand (CPM)
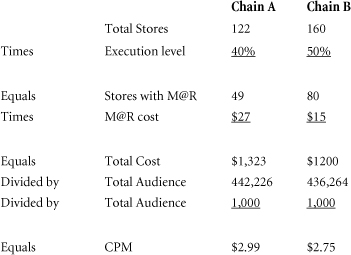
Cost per thousand is a common element for all media planning and is frequently used to allocate budgets across different media options and to track performance. The definition of CPM for retail marketing program is audience divided by 1,000.

The retail marketing vehicle cost includes any placement fees or labor costs for setup, but does not include licensing fees or creative expense to ensure evaluation on the same terms as traditional media vehicles. As in other examples, the audience is the number of people who have an opportunity to see the marketing campaign in the store.5
Audience Delivery Worksheet
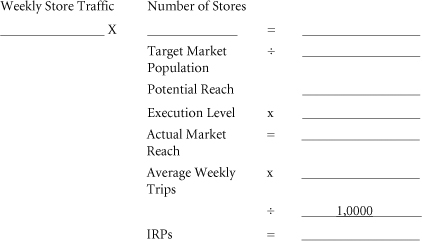
Integrating the previous process, we can construct an audience delivery worksheet for retail marketing as follows: Weekly shoppers per store, multiplied by the number of stores in the chain, quantify the delivery of a total potential audience. This figure is divided by the target market population to define the potential market reach in-store. The potential reach is multiplied by the actual placement or execution level in-store, which yields the actual total market reach. The actual reach is multiplied by the average number of shopping trips for the retailer, and is then divided by 1,000 to calculate IRPs for the planned campaign.6
Audience Delivery
Worksheet
Phase One Summary
The Phase One programs sought to systematically develop measurements for retail marketing against three objectives:
• Proof of placement
• Audience delivery cost effectiveness
• Sales impact
The thought leaders in the industry directed and underwrote substantial research to produce a methodology for measuring retail marketing activity on a broad scale while isolating the impact of retail marketing efforts from the other promotional efforts occurring in-store. POPAI, along with other associations such as the National Association of Convenience Stores (NACS) and Advertising Research Foundation (ARF), research partner Prime Consulting Group, brand marketing sponsors, and retail participants, guided the program through the pilot study, channel studies in supermarket, convenience, and chain drug stores and the development of audience measurement principles that allowed participants to employ retail marketing metrics and terminology similar to those used for traditional media.
As the research plan was implemented, methodology was defined, and a broad learning base was developed. The supermarket research established measurement principles for the retail environment and focused attention on the sales impact derived from executing different types of retail marketing campaigns; for example, a standee versus free-standing fixture. The convenience store study incorporated an added emphasis on measuring the impact of retail marketing material location (combined with type of material) on sales results and analyzed retailer execution plans against the level of chainwide implementation achieved to identify the key success elements for all participants to enhance execution. The chain drug store efforts expanded the research focus to encompass the role that message content (with material and type of advertising) had on results. To broaden the understanding of the store further, the study included shopper interviews to measure what shoppers said versus what they actually did in-store. The study also reviewed the efficacy of applying RFID technology to systematically measure proof of placement for retail marketing media.
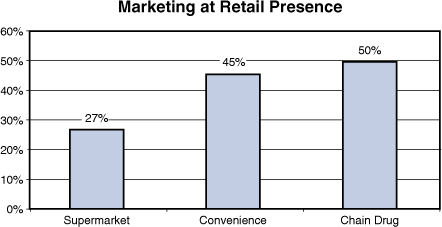
A few of the broad-scale results include a finding on the relative use of retail marketing material by channel. Supermarkets had marketing support 27 percent of the time, followed by convenience stores at 45 percent, and chain drug stores at 50 percent (see Figure 5.1).7
Figure 5.1 Retail Marketing Presence
Source: POPAI (2004) Measuring At-Retail Advertising in Chain Drug Stores
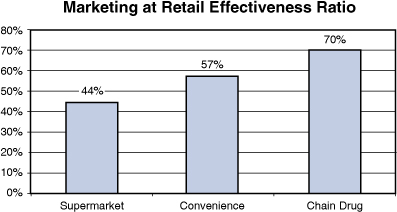
The retail marketing effectiveness ratio (the percentage of efforts that generated sales lifts greater than 1 percent) followed a similar trajectory with supermarkets at 45 percent, followed by convenience stores at 57 percent and chain drug stores at 70 percent (see Figure 5.2).8
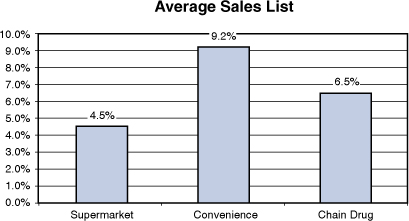
Although chain drug stores led all channels in execution levels and effectiveness ratio, the average lift from marketing campaigns was 6.5 percent versus 9.2 percent at convenience stores and 4.5 percent at supermarkets (see Figure 5.3).9
Figure 5.2 Retail Marketing Effectiveness Ratio
Source: POPAI (2004) Measuring At-Retail Advertising in Chain Drug Stores
Source: POPAI (2004) Measuring At-Retail Advertising in Chain Drug Stores
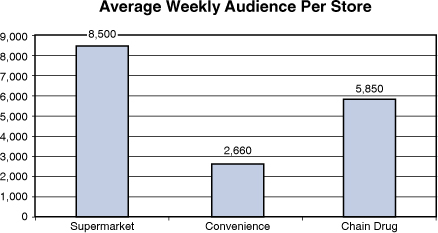
In all channels, the potential audience is huge, with major chains routinely delivering tens of millions of impressions per week (see Figure 5.4).10
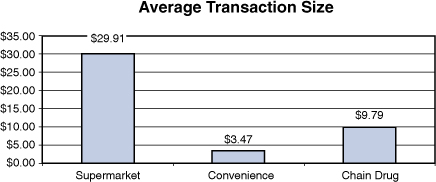
For all retailers, the potential returns from implementing a successful retail marketing program are enormous. Average transaction sizes range from $3.47 at convenience stores to $29.91 at supermarkets. If one more item was added to the shopping cart of existing shoppers, the impact would meaningfully influence retail results (see Figure 5.5).
Figure 5.4 Average Weekly Audience Per Store
Source: POPAI (2004) Measuring At-Retail Advertising in Chain Drug Stores
Figure 5.5 Average Transaction Size
Source: POPAI (2004) Measuring At-Retail Advertising in Chain Drug Stores
To illustrate the financial impact of adding an incremental item to the shopping basket, let’s briefly consider a hypothetical extrapolation for one retailer. If Safeway achieved the industry standard for average transaction size, it executed 1.4 billion transactions to achieve its $44.1 billion in 2008 revenue.11 With an average gross margin of 28.34 percent,12 adding just $1 to the average shopping trip would add $417 million gross profit. Analyzing this from another perspective, an additional dollar per shopping trip has the same financial impact as an additional 49.2 million average customer shopping visits. With a modest flow through of the increased margin dollars, net profits could be improved by 20 percent. Collectively, we have an incredible opportunity to dramatically improve financial performance by increasing the effectiveness of what is already in the store. The return on these efforts can have a profound impact on both the top and bottom lines.
Phase Two—Nielsen’s PRISM Project
Developing broad-scale audience measures
Overview
Phase One research was broadly focused on three big ideas:
• Establishing a framework for the measurement and consideration of retail marketing
• As a medium that could be integrated into formal media planning tools used by all participants
• Building a general knowledge base of the key dynamics within the retail marketing environment by exploring a variety of aspects within deep channel studies
By contrast, Phase Two research attacked a single big challenge in working to develop a methodology for syndicated audience delivery measures (In-Store Rating Points, or IRPs) across multiple channels. Rather than focusing on the general traffic count for the entire store, the goal was to more accurately measure the traffic by area within the store. The model for impressions within each aisle was
In-store traffic by location
×
Compliance (level of execution)
×
Unduplicated impressions
=
IRP
The project was titled PRISM, for “Pioneering Research for an In-Store Metric,” with the goals of measuring retail marketing reach by retail department and linking aisle impressions to sales conversion, to help participants better integrate retail marketing into their planning models and assist them in making better use of their planned materials. The research team would collect and analyze traffic by location in the store, day and day part, media placement, media type, and shopper characteristics. As George Wishart, the Nielsen executive director who led the PRISM efforts, stated, “Our goal is to develop an industry standard that can be applied to any retail environment.”13
The research was conducted in two studies with four stages in each study:
• Measurement of media in-store and store traffic patterns
• Analyses of collected data and cross-referencing with other information sources for demographics
• Modeling of panel data
• Model testing
Between studies, Nielsen worked to further refine the analyses and modeling based on the results to prepare for a larger scale test that would validate the efficacy of the approach employed. The goal was to develop and test a model that would enable for syndication of store traffic based on the actual ongoing measurement of a panel of retail locations.
The anticipated result would be the in-store equivalent of network television audience measurement so that practitioners would have a third-party certified audience estimate as a necessary first tool for media planning. Instead of television viewers measured with diaries or people meters, the efforts in Phase Two focused on the physical measurement of shoppers in store aisles. To achieve this measurement, Nielsen placed infrared transmitters in each aisle that registered the traffic into and out of the aisle and then transmitted the data to a central location for collection and eventual analyses. The electronic counts were verified by personnel to simultaneously test the viability of the deployment of infrared technology (see Figure 5.6).14
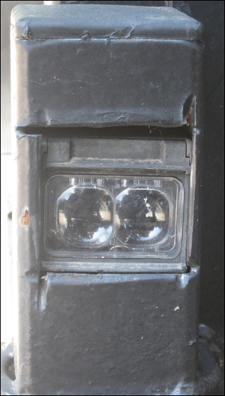
Nielsen supplemented its in-store proof-of-placement measurements and in-aisle traffic data collection with shopper demographic profiles derived by superimposing information from its HomeScan consumer panel onto the PRISM data.15
Stage One
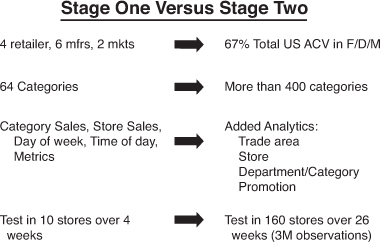
The first stage of the study was led by The Nielsen Company with sponsorship from the In-Store Marketing Institute (ISMI), 3M, Coca-Cola, Kellogg’s, Miller Brewing, Procter & Gamble, and the Walt Disney Company. Albertsons, Kroger, Walgreens, and Wal-Mart were the participating retailers. The first study encompassed 10 stores, (two each from Albertsons, Kroger, and Walgreens, and four from Wal-Mart) in 64 product categories over four weeks in spring 2006.
The results from stage one included16
• Validation of the accuracy of infrared technology—physically observed traffic aligned tightly with infrared measured shopper counts
• Ability to viably model store traffic results from panel data—the test results yielded a much higher correlation between projected traffic by department and actual traffic than anticipated pretest
• Accuracy of predictive traffic estimates using sales and other quantifiable inputs
Beyond the measured results, the research clearly pointed the way for further enhancement and enthusiasm among the study sponsors ran high, as exhibited by this statement from Bob McDonald, then chief operating officer of Procter & Gamble. “By taking this data [and] aligning it against the cost of specific physical in-store executions, we are going to be able to establish CPM—the cost per thousand to reach those shoppers in a particular category and by store. This will lay the foundations for precisely measuring return on investment for specific executions or displays by category, by retailer. You are even going to be able to establish ROI by geography—what works better in Florida than in Illinois—or even ROI by seasonality.”17
Stage Two
In the second stage of PRISM, Nielsen and the other program sponsors worked to test a more refined model while significantly expanding the research in several important ways18:
• Retail participation increased to 160 stores (versus 10) and 18 retailers.
• Product categories increased from 64 to more than 200.
• Test period moved from 4 weeks to 26 weeks to better isolate seasonality.
• Focus on building greater modeling sophistication by including geography, seasonality, promotional factors, and so on.
Under The Nielsen Company’s leadership, sponsors were expanded to include not only the original study sponsors (ISMI, 3M, Coca-Cola, Kellogg’s, Miller Brewing, Procter & Gamble, the Walt Disney Company, Albertsons, Kroger, Walgreens, and Wal-Mart) but also brand marketers Clorox, ConAgra Foods, General Mills, Hewlett-Packard, Kraft, Mars Snackfood, Mattel, Nintendo, and Unilever; retailers A&P, Ahold USA, Hy-Vee, Meijer, Pathmark, Price Chopper, Rite Aid, Safeway, Schnucks, Sears/Kmart, Stop & Shop, Supervalu, Target, and Winn-Dixie; and agencies Catapult Marketing, Group M, Integer, MARS Advertising, OMD, and Starcom MediaVest. The trial was initiated in April 2007 with a retail base that covered 60 percent of the All Commodity Value (ACV) of the products sold in grocery, drug, and mass retailers, which was well beyond the coverage goal. Category coverage was expanded beyond the packaged goods that dominated the first study to include toys, consumer electronics, and other general merchandise. The study was conducted continuously in some test stores and “pulsed” in three-and four-week intervals in other locations (see Figure 5.7).19
Figure 5.7 Stage One/Stage Two Scope Comparison
Research Learnings
Learning One: Modeling Is a Viable Option
The studies conclusively demonstrated that a modeling approach could generate accurate IRP metrics for both individual stores and entire retail chains while predicting traffic and unduplicated impressions by store, location in the store, day of month, and day part.20
Learning Two: Marketing at Retail Audience Is Huge
Building on the information gathered in the Phase One channel studies, the Phase Two PRISM efforts substantiated the size of the audience entering retail locations and also verified that they routinely traverse a great deal of the store geography. As David Calhoun, the chairman and CEO of The Nielsen Company stated, “The retail audience is enormous. It is the largest audience available today. Right now millions of shoppers are in-store. But PRISM lets us know about more than just the total audience size for a retailer. It tells us where in the store the shoppers are and how that changes by time of day and day of week.”21
Learning Three: Shoppers Exposed to a Large Number of Marketing Stimuli In-Store
Shoppers were exposed to a tremendous number of marketing messages. The averages observed in this phase ranged from 2,300 in a typical chain drug store to more than 5,000 in a mass merchant22:

Learning Four: Volume Does Not Equate to Traffic
Category transaction data is not an accurate proxy for traffic because not all shoppers entering an aisle make a purchase from that area of the store. The learning is significant because it provides data to practitioners on closure measurements by channel, chain, and store. This data can lead to analyses to develop programs to improve the closure rate from aisle visits. Speaking about the nonpurchasing shopper in-store, Calhoun continued, “Until now, we have known a lot about the people who made purchases; however, now we have information about the shoppers who visited a category or aisle but who did not buy…. No purchase data or loyalty data can provide this insight.”23
Learning Five: Identifiable Shopping Patterns
With its introduction of shopper demographic analyses, the study added a new component of valuable learning. Data analyses revealed discernible shopping patterns for shopper segments. For example, 13 percent of the shopping visits included children. When children were a part of the store visit, shoppers visited more sections of the store and purchased more total items than shoppers without children. The results were consistent throughout the week and across most categories. Although the presence of children increased the probability of purchasing seasonal items, snack bars, and fruit snacks, this propensity did not extend to candy.24
Learning Six: Differential Close Rates by Category
The percentage of shoppers who purchase a product from an aisle they visit varies broadly by category. In general, the closure rates for categories such as salty snacks, carbonated beverages, water, milk, and cookies are high, whereas rates are relatively low for mayonnaise, cereal, butter, vitamins, and eggs. In grocery stores, for example, 66 percent of shoppers who visit the aisle buy salty snacks, whereas only 13 percent of those passing the egg section actually purchase them.25
Learning Seven: Differential Close Rates by Channel
Just as the closure rate varies by category within the store, the percentage varies widely within the same category across different chains. For example, the closure rates in chain drug stores are generally lower than those in supermarkets. In some categories such as salty snacks, the difference can be substantial: Grocery close rate for salty snacks is 66 percent; chain drug close rate is 17 percent.26
Learning Eight: Consistent Shopping Patterns
Similarly, although traffic count fluctuated within a chain and across different chains and channels, the overall shopping patterns and demographics of the shopper composition showed strong similarities. Traffic counts between retailers varied, but they rose and fell during the same period and followed similar peaks and nadirs during the month. Traffic levels changed significantly during a month, but the deviations followed predictable patterns. The translation of traffic into revenue varied widely by time of day with high conversion rates in the early morning and late evening versus other day parts with higher total transaction counts, but a lower percentage of shoppers executing a purchase.27
Learning Nine: Outpost/Feature Location Traffic Varies
Just as the traffic into aisles throughout the store fluctuates widely, so too do the shoppers passing feature locations, such as endcaps and free-standing displays. The traffic differential between endcaps varied during the test by as much as 700 percent depending on the location in the store.28
Learning Ten: Store Design Influences Traffic Patterns
The store layout influenced the traffic pattern for the entire store. For example, across all channels, the endcap closest to the primary entrance (generally the rightmost aisle) is the most effective and registers the highest traffic counts; a narrow upfront area often drove shoppers to the rear perimeter, decreasing the impact of the front endcaps and increasing the value of the rear displays.29
Summary
Although originally planned for syndicated rollout in 2009 following successful tests in 2006 and 2007, the Nielsen syndicated service has been placed on hold as a result of the constriction associated with the current economic environment. However, the studies greatly increased our existing knowledge base by expanding the areas of the marketing at retail landscape that were investigated. The Phase One studies explored specific categories within channels and the role of the following:
• Total store traffic
• Types of marketing at retail
• Marketing at retail location
• Marketing at retail messages
• Retail execution
• Shopper perceptions
• RFID capability for capturing proof-of-placement measures
Phase Two studies expanded the research to include the following:
• Development of a scalable model for broad ongoing audience measurement and potential syndication
• Traffic by location
• Closure rates
• Shopper demographics
• Variances by day of the month, day of the week, and day part
These efforts added to the growing base of knowledge of the retail marketing environment. A.G Lafley, then CEO of Procter & Gamble, summed up the thinking about the importance of continuing to grow this knowledge base when speaking to the Consumer Analyst Group of New York on February 21, 2008: “Marketing productivity is another important opportunity. P&G invests about $10 billion a year in consumer marketing. And as you know, we’ve been working for some time now to increase the effectiveness and the efficiency of our consumer marketing spending—and to increase the reach and the impact with consumers.”
“In addition, we spend $10 billion with retailers to drive demand creation in stores. And we’re confident we can improve the productivity of this investment in shopper purchase and trial with our trade customers. Consumers claim 70 percent of their final purchase decisions are made at the store shelf, but we don’t know as much as we would like about how these purchase decisions are really made. So we’re in the process of closing this knowledge and understanding gap.”30
Endnotes
1. Doug Adams and Jim Spaeth, “In-Store Advertising Audience Measurement Principles,” Washington, D.C., POPAI, 2003, pages 3 – 8.
2. Doug Adams, “POP Measures Up: Learnings from the Supermarket Class of Trade,” Washington, D.C., POPAI (2001), page 43.
3. Ibid., 6-7.
4. Ibid., 8.
5. Ibid., 43.
6. Ibid., 10.
7. Ibid., 14; Doug Adams, “POPAI Convenience Channel Study,” Washington, D.C., POPAI (2002), page 15; Doug Adams, “POPAI Measuring At-Retail Advertising in Chain Drug Stores,” Washington, D.C., POPAI (2004), page 20.
8. Doug Adams, “POP Measures Up: Learnings from the Supermarket Class of Trade,” Washington, D.C., POPAI (2001), page 6; Doug Adams, “POPAI Convenience Channel Study,” Washington, D.C., POPAI (2002), page 15; Doug Adams, “POPAI Measuring At-Retail Advertising in Chain Drug Stores,” Washington, D.C., POPAI (2004), page 22.
9. Doug Adams, “POP Measures Up: Learnings from the Supermarket Class of Trade,” Washington, D.C., POPAI (2001), page 6; Doug Adams, “POPAI Convenience Channel Study,” Washington, D.C., POPAI (2002), page 15; Doug Adams, “POPAI Measuring At-Retail Advertising in Chain Drug Stores,” Washington, D.C., POPAI (2004), page 16.
10. Doug Adams, “POPAI Measuring At-Retail Advertising in Chain Drug Stores,” Washington, D.C., POPAI (2004), page 32.
11. Safeway Annual Report (2008).
12. Ibid.
13. Peter Breen, “In-Store Marketing Institute,” (December 2006) http://www.instoremarketer.org/article/nielsen-becomes-standards-bearer/5616.
14. Joseph Tarnowski, “Technology: In-store Influence Progressive Grocer,” (September 1, 2008) http://www.progressivegrocer.com/progressivegrocer/content_display/in-print/current-issue/e3i85d526d9b2781718952d7ea1040dfaf0.
15. Ibid.
16. George Wishart, P.R.I.S.M. (Updated June 8, 2007).
17. “In-Store Marketing Institute” (September 2007) http://www.instoremarketer.org/p-r-i-s-m-s-promise-br-pproaching-reality/6687.
18. Ibid.
19. “Nielsen In-Store” (May 2008) http://www.instoremarketer.org/article/analyzing-PRISM-data.
20. George Wishart, P.R.I.S.M. (Updated June 8, 2007).
21. “In-Store Marketing Institute” (September 2007) http://www.instoremarketer.org/p-r-i-s-m-s-promise-br-pproaching-reality/6687.
22. Ibid.
23. Ibid.
24. “In-Store Marketing Institute” (May 2008) http://www.instoremarketer.org/article/analyzing-PRISM-data.
25. Ibid.
26. Ibid.
27. Ibid.
28. Ibid.
29. Ibid.
30. “In-Store Marketing Institute” (February 2008) http://www.instoremarketer.org/article/lafley-prism-will-transform

