
4. Measuring Marketing at Retail in Drug Stores
Overview
With the knowledge gained from previous studies, POPAI undertook its next major channel research, “Measuring At–Retail Advertising Effectiveness in Chain Drug Stores.” The research team expanded its focus to build the knowledge base by more intensely studying the impact of message on shopper response and exploring the potential application of radio frequency identification technology (RFID) to retail marketing campaigns. The study was completed in two phases in 2004, with the first phase focused on developing shopper insight and the second phase centered on measuring presence and sales effectiveness. In the first phase, shopper surveys were conducted; in the second, store audits were completed using both manual and RFID tracking. Scan data was collected for the test period, and the data was merged with historical sales information for analyses and reporting. The sales and presence analyses were then merged with the shopper surveys to develop a richer level of insight that built on the previous studies.
The study was conducted in 127 stores located in 12 of the top 50 markets for four leading drug chains: Brooks, CVS, Rite Aid, and Walgreens. Following is the market breakout by chain: Brooks (Boston, Providence); CVS (Atlanta, Detroit, Boston, Philadelphia, Cleveland); Rite Aid (Boston, Los Angeles, Cleveland, Philadelphia, Detroit, Seattle); Walgreens (Boston, San Antonio, Philadelphia, Orlando, Seattle, Phoenix, Tampa Bay).
The study encompassed nine categories with four groups in health and beauty aids (over-the-counter medication, facial care, teeth whitening, and vitamins) and five in grocery (carbonated beverages, gum, nonchocolate candy, milk, and salty snacks). The research was directed by POPAI and the National Association of Chain Drug Stores. It was conducted by Prime Consulting Group with RFID measurement support from Goliath Solutions. The program was sponsored by Frito-Lay, Cadbury Adams, PharmaVite, Rand Display, Dr. Pepper/7Up, and Unilever. Store audit data and sales were collected at the UPC level over 16 weeks with base line information provided by all stores for the two-year period prior to the audit. As with the other studies, the baseline information included all current and historical factors influencing product movement including promotion, seasonality, and so on.
In summary, the study found that 32 of the 38 brands (84%) studied generated sales increases greater than 1% directly related to retail marketing programs. The average lift across the study was 6.5% with sales increases ranging from 0 to 67 percent. Twelve of the 38 brands (31.5%) recorded increases above 20 percent. On a category basis, food and beverage outperformed health and beauty aids. Despite the strong results related to retail marketing support, marketing material was present only half the time.
Learning One: Many Key Results Consistent with Other Studies
The retail marketing executions that delivered results in the previous studies also generated increases within chain drug stores. Some of the key similarities include the following:
• Weak results for planned purchase items and consistently higher outpost effectiveness ratios for impulse brands and items.
• A generally higher sales increase percentage for promotion and advertising (although the impact decreases as the amount of planning associated with the purchase increases).
• A strong response to education efforts for planned purchases and weak impact on impulse items.
• The efficacy of combining effective retail marketing techniques especially for impulse brands and categories.
Figure 4.1 summarizes these findings.1
Figure 4.1 Marketing Technique Effectiveness
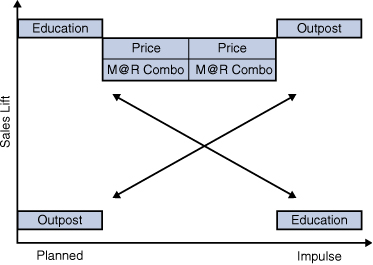
Source: POPAI (2004) Measuring At-Retail Advertising in Chain Drug Stores
Learning Two: Retail Marketing Effectiveness Higher in Chain Drug Stores
Retail marketing efforts had a higher success ratio in chain drug stores as compared with supermarkets and convenience stores. Collectively, marketers and brands generated a positive result 70% of time versus a 44% effectiveness ratio at supermarkets and 57% at convenience stores (see Figure 4.2).2
Learning Three: Message Matters
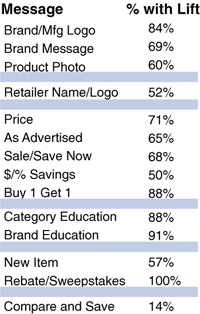
As observed in the convenience store study, the message communicated to shoppers resulted in a wide variance in sales impact. Brand photos and messages significantly outperformed generic and retailer messages; education positively affected planned purchase categories, and price was a strong motivator for both. Within the pricing category, message results ranged broadly with heavy promotional messages (rebate; buy one, get one) outperforming more generic pricing communication such as compare and save, dollar or percentage savings, and as advertised (see Figure 4.3).3
Figure 4.2 Retail Marketing Effectiveness Ratios
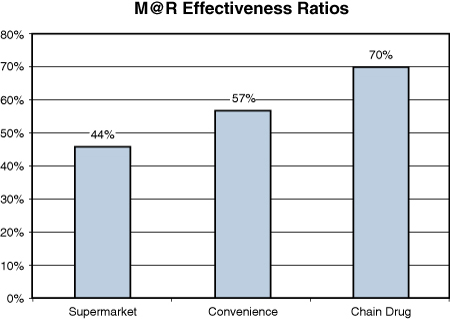
Source: POPAI (2004) Measuring At-Retail Advertising in Chain Drug Stores
Figure 4.3 Marketing Message Sales Increase
Source: POPAI (2004) Measuring At-Retail Advertising in Chain Drug Stores
Educational executions were successful for complex, planned purchase categories such as the HBC items studied. Retail marketing programs that helped shoppers match products with their needs in categories such as vitamins, over-the-counter remedies, and facial care were successful 90 percent of the time and generated increases from 4 percent to 22 percent (see Figure 4.4).4
Figure 4.4 Message Impact Variance
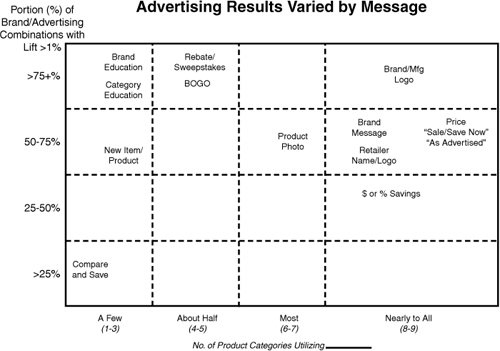
Source: POPAI (2004) Measuring At-Retail Advertising in Chain Drug Stores
Brand messaging delivered stronger lifts for planned purchase categories, such as HBC, than, impulse brands. Brand messages generated lifts between 28 percent and 43 percent for facial care and teeth whitening versus 3 percent to 8 percent for price messages. Conversely, brand message sales lifts were only 1 percent to 17 percent for food and beverage categories versus 15 percent to 47 percent for pricing communication (see Figure 4.5).5
Figure 4.5 Messaging Sales Lift Range
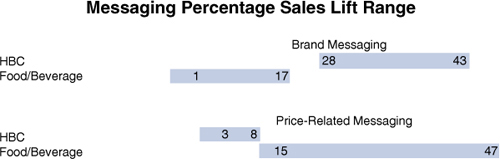
Source: POPAI (2004) Measuring At-Retail Advertising in Chain Drug Stores
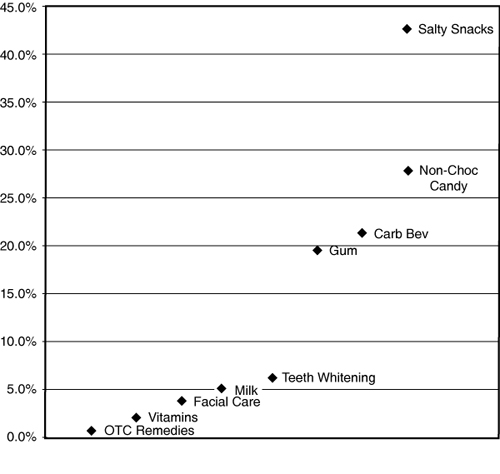
Figure 4.6 shows the average individual category performance.6
Figure 4.6 Category Sales Response to Price/Sales Messaging
Source: POPAI (2004) Measuring At-Retail Advertising in Chain Drug Stores
Although milk generated a relatively low percentage increase, the dollar value of the sales increase was the highest among all the categories studied. As in the other studies, small sales bases yielded high percentage response rates with smaller brands at times recording a doubling of sales with successful marketing at retail programs.
Learning Four: Promotion/Advertising Consistently Enhances Impact
For all categories, it was better to coordinate your marketing at retail program with other promotional activity. When marketing at retail was combined with promotion, results increased from 100 percent to 1,300%, averaging a 275% increase (see Figures 4.7 through 4.11).7
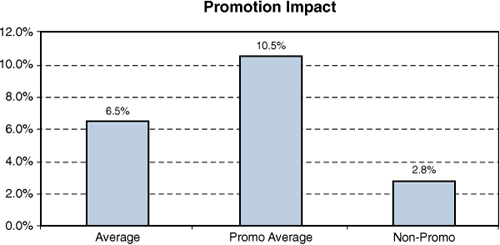
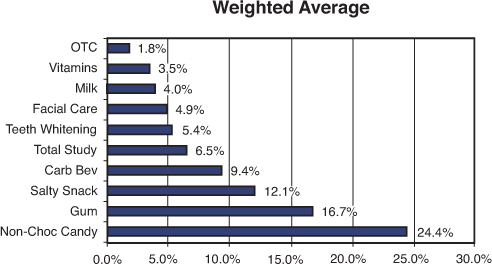
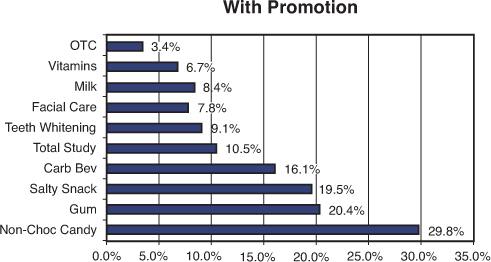
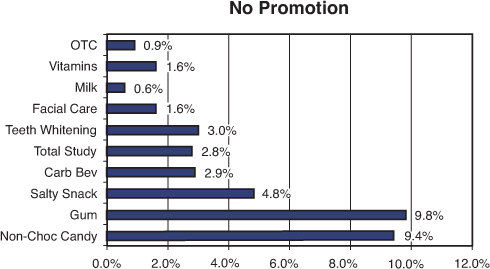
Figure 4.11 Average Brand Sales Lift
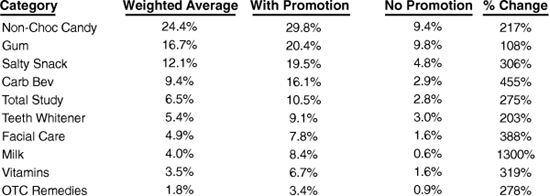
Source: POPAI (2004) Measuring At-Retail Advertising in Chain Drug Stores
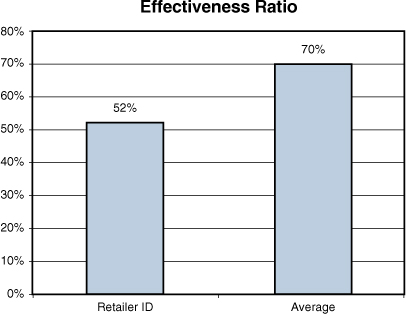
Learning Five: Brand-Focused Messages More Effective
Brand-focused messages consistently outperformed retailer identification on retail marketing material, with retailer results measuring 25.7 percent below the store average. Success for retailer identification programs tracked closely with brand size so that smaller brands recorded higher lifts than larger brands. In general, the hierarchy of messages corresponded to the other studies, with photos and brand messages delivering the highest results, followed by promotion and price (see Figure 4.12).8
Figure 4.12 Effectiveness Ratio
Source: POPAI (2004) Measuring At-Retail Advertising in Chain Drug Stores
In total, brand messages indexed at twice the performance of programs that utilized retailer identification only (see Figure 4.13).
Figure 4.13 Comparative Lift Index
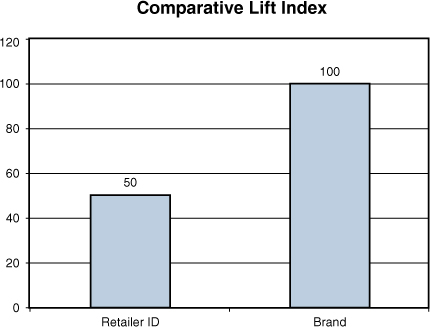
Source: POPAI (2004) Measuring At-Retail Advertising in Chain Drug Stores
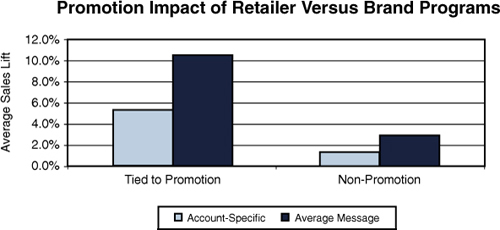
This differential was recorded for both stand-alone programs and those integrated with promotion—the added element that routinely added the largest lift to retail marketing programs (see Figure 4.14).9
Figure 4.14 Promotion Impact on Brand Versus Retailer Programs
Source: POPAI (2004) Measuring At-Retail Advertising in Chain Drug Stores
Learning Six: Price Savings Drive Impulse Results
All pricing messages positively affected sales. However, shoppers’ response varied with the specific execution, so that buy-one-get-one-free messages rated the highest and compare and save the lowest (see Figure 4.15).10
Figure 4.15 Consumers Respond to Price and Sales-Related Messaging
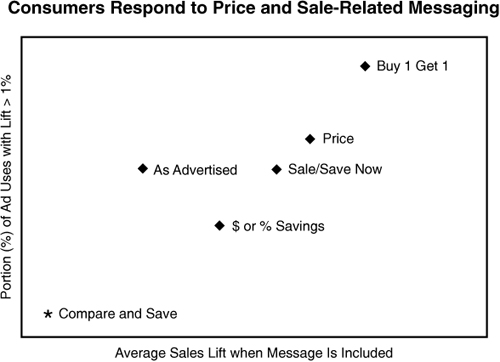
Source: POPAI (2004) Measuring At-Retail Advertising in Chain Drug Stores
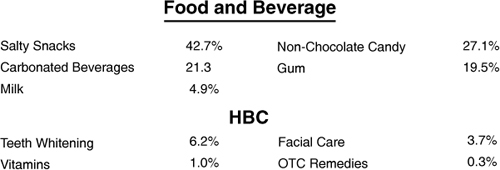
Although all brands benefited from price promotion, impulse brands saw a much greater lift versus planned purchase categories. Planned purchase brands registered an average increase of less than 5 percent, whereas impulse brands recorded lifts ranging from 19.5% for gum to 42.7% for salty snacks (see Figure 4.16).11
Learning Seven: Value Message Drives Private Label
Although the compare-and-save message was not a strong message for branded products, it was effective for retailer private label products, raising sales for these products, at the expense of branded items, six out of seven times (see Figure 4.17).12
Source: POPAI (2004) Measuring At-Retail Advertising in Chain Drug Stores
Figure 4.17 Compare and Save Effectiveness Ratios
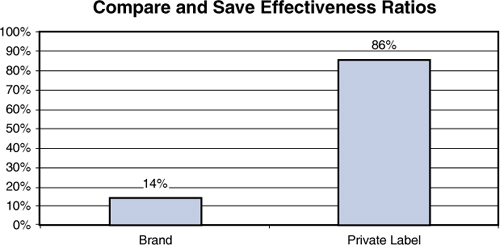
Source: POPAI (2004) Measuring At-Retail Advertising in Chain Drug Stores
Learning Eight: Shopper Actions Differ from Words
What shoppers say and what they do vary in significant ways. In general, shoppers say that they make their decisions in a logical manner, and shopper interviews generated a hierarchy of preferred retail marketing executions, with promotions and savings at the top, followed by benefits/execution, and ending with brand pictures and logos. In fact, actions were driven by a combination of logical and emotional triggers. As previously discussed, educational triggers work much better for planned purchases, whereas price and brand photos and messages are powerful for impulse brands (see Figure 4.18).13
Figure 4.18 Consumer Interview Versus Actions
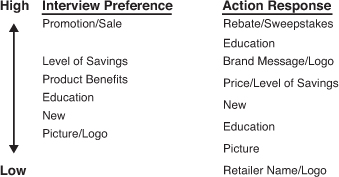
Source: POPAI (2004) Measuring At-Retail Advertising in Chain Drug Stores
Learning Nine: RFID Tracking Delivers Reliable, Real-Time Data
At one retail chain, RFID measured display compliance with Goliath Solutions providing technical support. In a sampling of stores within the chain, small chips were affixed to retail marketing material. A hub was placed in the store (generally in a closet or the ceiling). The hub captured data from the chips, enabling the chain to precisely identify not only whether the material was in the store, but also its precise placement location. This data was then transmitted to a central location for collection, analysis, and action. All data collection and transmission occurred without the involvement of any store personnel when the system was in place (see Figure 4.19).14
Figure 4.19 RFID Typical Placement
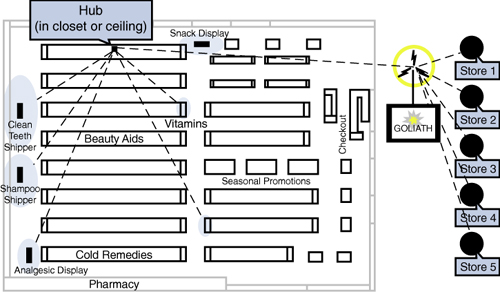
Source: POPAI (2004) Measuring At-Retail Advertising in Chain Drug Stores
The use of RFID enabled the chain to measure the placement of media and the length of time the retail marketing program was in use. The real-time reporting to headquarters enabled analysts to measure compliance against sales performance and communicate in real time with individual stores to remediate noncompliant situations. The daily placement and sales data were shared with managers within the retailer and participating brands to provide a more robust level of data analysis that could lead to the development of more effective future programs.
Learning Ten: Retail Audience and CPM Very Attractive
Measurement tools for determining the size of the retail audience were developed during the supermarket study and applied to all subsequent channel studies. The methodology included tracking both transaction counts and shopper trip frequency per week. The research team used this data to calculate an Opportunity to See (OTS) measurement that captured the differentiated audience for each channel. For example, the average convenience store had 4,470 transactions per week. With an industry average of 1.68 shopping trips per week for convenience store customers, the weekly reach per store is 2,660 people. In total, shoppers in the United States make more than 21 billion trips to retail stores per year—111 million households take an average of 189 annual trips (see Figure 4.20).15
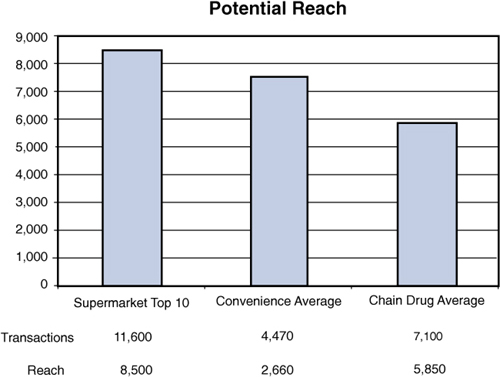
Source: POPAI (2004) Measuring At-Retail Advertising in Chain Drug Stores
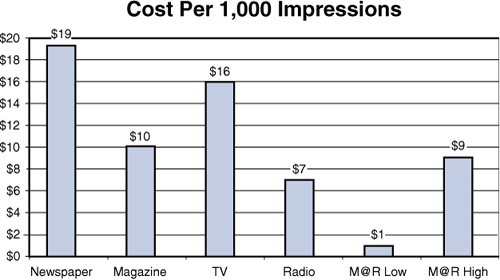
Similarly, the cost per thousand (CPM) to reach this audience compares favorably with other media options. Although the CPM for traditional media ranges from $7 for radio to $19 for newspaper, retail costs varied from $1 for signage to $9 for dedicated fixtures. To complete these calculations, Prime Consulting Group collected costs for retail marketing programs across all channels studied. These costs included both the material and the labor required to implement the program. The analysis excluded any licensing or design costs because these are typically not included in CPM calculations for other media. Although this methodology gives us an accurate CPM measure in terms equal to traditional media, it is important to remember the positive, immediate sales impact associated with retail marketing programs. More than any other media option, the store provides an environment for cost-effective advertising and immediate sales improvement (see Figure 4.21).16
Figure 4.21 Cost per 1,000 Impressions
Source: POPAI (2004) Measuring At-Retail Advertising in Chain Drug Stores
The chain drug study built on the methodology developed and knowledge gained from the supermarket and convenience store studies. Although the study reaffirmed many of the basic learnings from the first two research projects, by increasing attention on the impact of message and measuring the difference between what shoppers say and what shoppers do in-store, the chain drug study helped identify key performance drivers. RFID technology proved to be a reliable tool within test stores and provided many potentially useful benefits for mass measurement of retail execution, immediate remediation of suboptimized execution, and detailed retail marketing performance analyses. Through all three studies, retail marketing was shown to be a cost-effective medium that delivers large audiences to advertisers while also affording the additional opportunity for immediate sales lifts.
Endnotes
1. Doug Adams, “Measuring At-Retail Advertising in Chain Drug Stores: Sales Effectiveness & Presence Report,” (POPAI 2004) page 16.
2. Ibid., 22.
3. Ibid., 17.
4. Ibid., 17.
5. Ibid., 23.
6. Ibid., 31.
7. Ibid., 28.
8. Ibid., 21.
9. Ibid., 29.
10. Ibid., 27.
11. Ibid., 28.
12. Ibid., 28.
13. Ibid., 25.
14. Ibid., 36.
15. Ibid., 32.
16. Ibid., 33.