
Appendix D. Real-world use case
D.1 Fluentd use in a real-world use case
Throughout the book, we have focused on explaining how to use Fluentd. The explanations have focused on specific areas rather than providing a holistic view. This appendix seeks to redress that by providing a more holistic picture.
This appendix has taken several similar real-world scenarios and blended them to avoid giving any client information away. Blending the cases together has allowed us to also incorporate more lessons. We won’t go into the specific configuration details, as they’re covered in the core of the book, but this should help you understand why we value some features.
D.2 Setting the scene
Our organization started about 30 years ago as a single-country retailer that has grown rapidly. The growth has been driven by the following:
-
Acquiring its own manufacturing capabilities, as its offerings are custom to each client.
-
Expanding its retail scope to related product lines reflecting changes in the market.
-
Commercially the retail units are established as businesses in their own right and are either wholly owned by a subsidiary of the main corporation or are co-owned (with store directors); there are also a few traditional franchisees. This structure gives the stores a degree of autonomy and individual accountability. This has meant independent retailers can become part of the group, and external investment (share cost in co-ownership or franchise) has helped growth.
-
Technology adoption has been driven by goals to streamline processes and, therefore, more retail throughput. This has meant growth in mobile device adoption and, more slowly, engagement with internet-based sales channels.
-
International expansion has been driven in Europe, Asia Pacific (including China), and North America in the last 20 years.
Internally, the organization is split in terms of geographical business and operations. Within each organization, there are vertical domains of
A central IT function supports corporate systems, core solutions used at a regional or manufacturing site level, and retail IT solutions. Still, the level of autonomy the verticals have creates conditions where shadow or gray IT exists. This is further compounded by the regional operations having their own IT teams aligned to the regional businesses. Corporate HQ and the primary IT operations, including software development, are based in Europe.
Some IT solutions reflect the organization’s age and growth; some corporate solutions have seen years of cumulative extension, patching, and customization and are clearly aging and brittle. This has led to hesitancy to make changes and some significant programs having been started to replace some of the legacy with a COTS (commercial-off-the-shelf) or SaaS approach. Shadow IT has meant local pockets of SaaS and “integration” have sprung up. European IT is dominated by its own on-premises data centers. Still, the newer geographic regions are more quickly adopting cloud rather than seeking the capital outlay for their operational IT and support centers. Retail currently is an on-premises proposition, as wide area network communications are not considered robust enough to allow retail locations to continue operating in the event of an outage. In some parts of the world, the stores simply don’t have sufficient network quality, reliability, and bandwidth to support all the demands of hosting solutions remotely.
In addition to COTS, solutions developed in-house for retail and manufacturing often embody corporate IP or streamline business processes. The organization sees increasingly connected devices in the manufacturing and retail spaces. The connectivity is coming either because of the natural IT evolution or because of parts of the organization commissioning third parties to build solutions or unique customizations of standard commercial offerings delivered by tablets.
Much of the system integration has been achieved via messaging, shared databases, or FTP. The retail and manufacturing capabilities are the most message-based, as store orders to manufacturing are time-sensitive and reflect dynamic stock allocation (reflecting these solutions have been bespoke built).
The rollout of software changes tends to be slow, often coming from nervousness about brittle legacy solutions. Delays outside non-European geographies have been compounded by the lack of understanding of software change and operational support challenges that made people resistant to change. Ironically, this has compounded problems, as outward pressure from Europe for upgrades to be rolled out means the rollout often entails a lot of change.
Existing operational and monitoring maturity depends upon geography, with Europe being the most established and mature. However, monitoring is primarily an infrastructure-only engagement. Monitoring at the application level is weaker. Business-level monitoring comes through classic retail and supply chain reporting metrics (sales and orders) rather than from more contemporary views of how many tasks are at different stages of their process.
Some of the problems have come from the continual drive for growth in terms of geography and market leadership (market share, innovation, regulation change). These pressures, at times, don’t help with keeping on top of the nonfunctional considerations as they evolve with the growth and technical debt. This isn’t unusual for many established organizations, but the continued growth embedded into the organizational DNA increases the pressure. IT momentum is typically measured through new functional capability and certainly creates some challenges in addressing debt until debt impacts delivery.
As you can see, this is not a cloud-born organization, but it was starting to feel its way into the cloud and needs to understand how to solve monitoring both for on-premises and when dealing with the cloud.
D.2.1 The operational challenges
It’s worth looking at some of the operational problems that the organization has struggled with. Addressing such issues will bring business value that can be gained through the delivery of monitoring improvements, including the adoption of Fluentd.
Third- and fourth-line support for core systems comes from the IT development in Europe that doesn’t provide 24/7 support. Regional operations working in different time zones have to provide their own support for their own regional retail. Central support provided often comes down to organizational politics and the goodwill of staff to provide out-of-hours support.
European development, which could effectively support local geographies using basic DevOps practices, had an insufficient appreciation for the needs of other regions. DevOps often was a reason not to write things down, so locally, understanding was very much through verbal and collaborative behaviors. The different geographies not being an active part of the development process and not benefiting from the collaborative knowledge transfer meant they lacked understanding of in-house solutions. This has resulted in problems arising from people using solutions in a way they were not expected to be used. Fast and dirty processes to recover from problems resulting in the loss of insight into operational failures (no logs retained or environment imaging/snapshots) made it very difficult for European IT to investigate and develop preventative measures.
D.3 Introducing monitoring
The IT systems effectively formed a series of star structures from the store to regional operational hubs and from regional hubs to the corporate center. This can be seen in figure D.1. The manufacturing and distribution are also connected directly to hubs and to the global center. This lends itself to adopting monitoring as a series of concentrator networks. This also fits well because most of the hubs have the most significant volume of events/transactions passing through, meaning problems in these areas have the most significant commercial impact.

Figure D.1 The key “actors” in the business and their relationships (and flow of information) across the organization
The first goal was getting regional hub systems aggregating and unifying their log data. Working on an 80/20 principle, we looked for standard technologies and common systems (often those originating from the central IT capability) to create standardized log event capture configurations. Metrics data collection was also implemented with simple threshold alarms. Alarms reflected significant threshold breaches (before they went critical) and had log events generated. When investigating a problem through the logs, we could see historically that there might have been a performance issue of some sort (typically the most severe being disk storage exhaustion).
While aligning infrastructure logs with the application logs would have shown us these measures, wanting to combine infrastructure monitoring led to conflicting politics, as the infrastructure teams felt their monitoring was mature. They weren’t the source of the problems. This wasn’t helped by the fact that IaaS activities didn’t see the infrastructure teams being involved.
We pressed development teams to catalog exceptions and use error codes as a first step to building better support documentation. This provided a vehicle for the regional teams to attach and share their own operational processes. Over time, we got CI/CD code quality checks to detect the allocation of error codes and gamified the adoption.
Traction with unifying the logs progressed, and we had a better understanding of what might be happening in the different deployments—some of the warning signs of problems had been identified and weren’t being recognized until too late. Therefore, alerting was provided through the log monitoring for the well-understood indicators by using group emails.
Other candidate indicators started being watched, which triggered a script to gather more diagnostic information, such as message queue depths, capturing the last access time to a queue.
As confidence grew that the monitoring was producing results, with both local operational teams and central IT resources better seeing what was going on, the acceptance of extending monitoring was implemented. Forwarding specific events to the central IT team also helped confirm when data distribution processes from the corporate center became the source of issues. Some of the problems started to be identified by examining logs for what was expected to happen. Along with the incorporation of the capacity, flags were things like
-
Software deployments weren’t always followed as recommended by the central teams. As a result, automated processes didn’t fire when they were expected or needed to.
-
Manual housekeeping wasn’t consistently practiced, often because the additional housekeeping steps were passed around by email, which didn’t reach everyone, or were not added to documentation as a more structured process.
-
Some business processes took days or weeks longer than expected in different geographies. As a result, staging data built up more than was expected, creating issues.
-
Indications of warnings were not addressed when they needed to be.
-
Some application logic wasn’t very defensive, allowing users to do things that weren’t expected in other parts of the enterprise—for example, product images were GBs in size when the communication infrastructure assumed such data would only be a few Kb.
Some of these findings certainly had to be handled with a great deal of care, as the mistakes and issues of communication gave anyone with an organizational agenda fuel, and often a lot of finger-pointing could occur.
D.3.1 Extending monitoring
With good progress with the geographical hubs and labs, the same approach was repeated for retail operations. This had to be done with more care, as anything perceived as impacting retail operations was a sensitive issue. One of the key challenges was sending sufficient information back to the hubs to provide suitable value while not consuming precious bandwidth.
The log aggregation focused on the store’s server-side solutions rather than the mobile platforms with device-native applications. Understanding native applications to get meaningful insights ended up being an issue separated from the core monitoring efforts. As the store applications handled PII data, the store servers were tightly locked down and experienced the occasional erroneous entry to a UI of data that shouldn’t be there, resulting in PII data occasionally finding its way into log entries. The subsequent need to filter log events further led to applying data masking for log events, even locally.
D.3.2 Finessing of monitoring
With the operational insights starting to flow back to central IT teams, some development teams switched from using Java logging to files to logging directly to the Fluentd agent. Where this was adopted, we used a configuration during development that ensured the log events got written to a file rather than to a central log storage capability. Log centralization varied based on willingness to allow additional software to be deployed and who would deploy it. This meant developers didn’t see the introduction of Fluentd early in the process as a disruption, because they were used to looking at their log files to help confirm code was working as expected. But this also helped promote improvement in logging, as we could still put filters in to highlight potential issues, such as accidentally logging sensitive data items.
D.4 Cloud dilemma
While cloud impact was very much a SaaS or IaaS issue, increasingly the challenge we are seeing with matured PaaS is the use of Cloud Native services, rather than a “low code” style of PaaS, such as MuleSoft, Dell Boomi, and Oracle’s Integration Cloud, which are closed ecosystems, to varying degrees. AWS, Azure, Oracle, and Google all provide cloud native services that offer Fluentd-like capabilities for their Kubernetes services. Therefore, when building with AWS’s Kubernetes or Oracle’s Blockchain, should we use the vendor implementations or explicitly instantiate Fluentd and configure Kubernetes to use our Fluentd, not the out-of-the-box logging and monitoring? We can see this clearly in figure D.2 with a cloud host natural solution using cloud native technologies and a cloud host-aligned approach.

Figure D.2 This illustrates the difference between a cloud-neutral approach to logging using cloud-native solutions (top), where you will need to accommodate in the infrastructure as code the networking needs, versus a vendor-specific model, where all the log events will go into a transparent monitoring layer handled by the cloud vendor.
It isn’t necessarily an easy question to answer. If we use the services provided and benefit from integrating, self-scaling, auto-patching, and so on, we must accept the consequential vendor lock-in. Or we must go the IaaS approach and deploy Fluentd ourselves, meaning any IaaS cloud vendor can be used, but we have to patch and scale ourselves. We’ve settled on answering this with several questions:
-
For software vendors, the benefit is obvious—maximum potential in terms of the consumer base. But the reality is that you’ll probably eventually incorporate adaptors into the clouds you support the most, as this benefits the customer. There are the high-profile stories of Zoom being able to switch cloud vendors quickly to realize substantial savings and Dropbox’s decision to move off AWS as they reached a scale that meant private data centers offered a better economy.
-
Are you likely to need multiple cloud vendors or operate in a hybrid manner?
-
For truly global solutions, today’s reality is that you are likely to need to deploy to multiple clouds. This is simply because not every vendor has a substantial presence in every geography. You may bump up against specific country data restrictions, which may mean using a particular vendor (e.g., Azure at the time of writing doesn’t have a presence in Eastern Europe, and Google doesn’t have a presence in Africa).
-
Also, unless you’re a significant customer with deep pockets, you won’t be using the cloud in your data center solutions such as AWS’s Outpost or Oracle’s Cloud at Customer, where the entire cloud platform is deployed onto provided racks of servers that live in your data center. This means multiple implementation and configuration issues. This may not be an option if you want to operate in China, as many IT vendors have restrictions on where and what they will offer.
-
The more variations in how the same problem is solved, the more skills an IT team or department will need. Suppose your IT organization needs to be very lean in terms of people. In that case, a standard set of technologies has a lot going for it. The team can develop their expertise with a smaller, focused set of tools. Master those to greater depth and maximize the investment. We’re not suggesting that all monitoring problems can be answered by Fluentd, but why master three or four log unification tools if one is enough?
-
Are your monitoring needs or strategy likely to take you into specialist situations?
-
For those specialist situations, where a restrictive solution is likely to need a lot of working around or you’re pushing the boundaries of what is possible with standard tools, then a service model from the cloud vendors is likely to create more problems than solutions. You won’t be able to tailor their platform around your unique circumstances like you can when you have complete control of both code and deployment.
Exploring these questions will undoubtedly reveal whether adopting Fluentd or something like the ELK stack is the way to go.
D.5 Solution
The solution that we arrived at on a regional hub level looks like the diagram in figure D.3. The corporate monitoring would look pretty similar, although the number of sources grew significantly over time as monitoring became more standard practice.
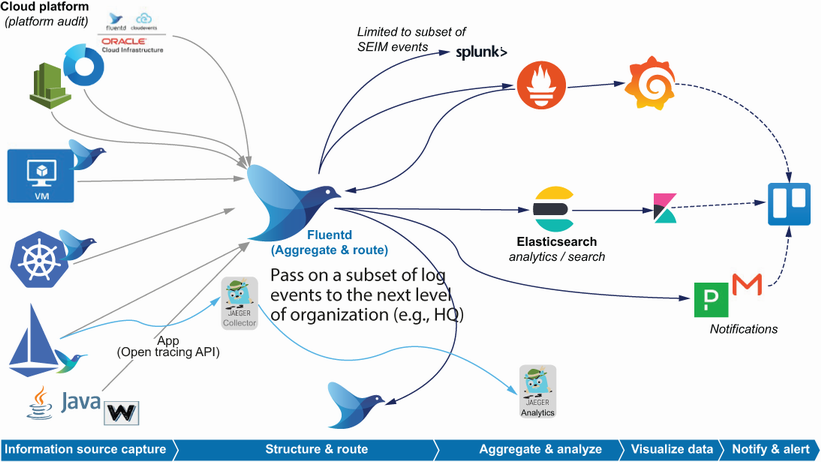
The stores and manufacturing centers would have some similarities, albeit a great deal simpler than the hubs, as they didn’t use containerization and had a smaller suite of systems in action.
D.6 Conclusion
Hopefully you’ll see from this that several of the Fluentd techniques we cover in the book helped deliver value to an organization with some challenges. You’ll have noticed that the application of Fluentd was not bound to any specific type of platform or technology. While Fluentd does come under the governance of the CNCF, this reflects the fact that it can help with modern cloud challenges, not that it was designed exclusively for this context.
One of our biggest takeaways from this lesson is the need for the organization implementing the monitoring capability to ensure that the culture and approach to implementing monitoring is ready and able to embrace the changes necessary. While hardware monitoring is taken as the norm (after all, you’ve made a significant capital outlay, so you want to ensure it is paying for itself), application monitoring and the use of logs often don’t get the same treatment. In the cases that formed this example, things had to become significantly problematic before a significant commitment was made to address them.