The previous chapter addressed generating static graphics. This chapter provides recipes for generating dynamic graphics. This includes animations of line and patch objects; utilizing uicontrol objects in figures; designing GUIs using the GUIDE development environment; and deploying your GUI as a MATLAB app. We present some tips for maximizing the performance of your dynamic graphics functions.
4.1 Creating a Simple Animation
Problem
You want a visualization that changes over time without generating hundreds of different figures.
Solution
You can create an animation by updating patch objects in a figure successively in a loop, Figure 4-1 shows one frame of such a animation.

Figure 4-1. Animation of a rotating box
How It Works
First, you create a graphic involving the 3D box from the previous chapter. Then you update it in a loop. This is most efficient if you can assign new data to the existing graphics object. This could be changing the color, style, or physical location of the object. Alternatively, you can delete and re-create the object in the current axes. In both cases, you need to store the graphics handle for the updates.
In this case, you update the vertices by multiplying by a rotation matrix b. You then pass the vertices to the patch via the handle using set (p, 'vertices', vK). Note the use of the transposes as the vertices are stored in an n × 3 array. A light object makes the resulting animation more interesting. You set 'linestyle' to 'none' for the patch object to eliminate the lines between triangles.
%% Animate a cube using patch
% Create a figure and draw a cube in it. The vertices and faces are specified
% directly. We only update vertices to get a smooth animation.
%% Box design
x = 3;
y = 2;
z = 1;
% Faces
f = [2 3 6;3 7 6;3 4 8;3 8 7;4 5 8;4 1 5;2 6 5;2 5 1;1 3 2;1 4 3;5 6 7;5 7 8];
% Vertices
v = [−x x x −x −x x x −x;...
−y −y y y −y −y y y;...
−z −z −z −z z z z z]'/2;
%% Draw the object
h = figure ('name','Box');
p = patch ('vertices',v,'faces',f,'facecolor',[0.5 0.5 0.5],...
'linestyle','none','facelighting','gouraud');
ax = gca ;
set (ax,'DataAspectRatio',[1 1 1],'DataAspectRatioMode','manual')
axis ([−3 3 −3 3 −3 3])
grid on
xlabel ('x')
ylabel ('y')
zlabel ('z')
view (3)
rotate3d on
light ('position',[0 0 1])
%% Animate
% We use tic and toc to time the animation. Pause is used with a fraction of a
% second input to slow the animation down.
tic
n = 10000;
a = linspace (0,8* pi ,n);
c = cos (a);
s = sin (a);
for k = 1:n
b = [c(k) 0 s(k);0 1 0;−s(k) 0 c(k)];
vK = (b*v')';
set (p,'vertices',vK);
pause (0.001);
end
toc
The full animation of four rotations takes about 16 seconds on a MacBook Pro laptop. About 10 seconds of this is expected to be from the pause command; that is, 10000 steps * 0.001 seconds. Using pauseallows you to slow down an animation that would otherwise be too fast to be useful. Remember that pause commands can be temporarily disabled by using pause off; this is useful when testing graphics functions that use pause.
Tip
Use pause to slow down animations as needed. Remember to use pause off to disable the pausing and run full speed during testing.
Check the execution time on your computer! Run the script twice, with pause turned off the second time.
>> pause on
>> PatchAnimation;
Elapsed time is 15.641664 seconds.
>> pause off
>> PatchAnimation;
Elapsed time is 0.780012 seconds.
Note that pause flushes the system graphics queue, drawing the updated patch to the screen. When pause is off, the graphics don’t update, and you see just the initial frame in the window. Also note that actual increase in time from the pause and the graphics updates was almost 15 seconds. To force a graphics update without using pause, use drawnow.
This script uses cells to allow the individual sections to be run independently. This means you can rerun the animation without re-creating the figure, by re-executing that cell. This can be done from the Run Section toolbar button or by keyboard command, such as Command-Enter on a Mac.
Suppose you want to add a text item to the animation that displays the angle of rotation. You can do this using title easily enough:
title(sprintf('Angle:⊔%f⊔deg',a(k)*180/pi));
However, you will be surprised at the performance impact. The animation now takes over 90 seconds! Displaying text is much less efficient than updating the graphics vertices. First, you can try directly using the handle to the axis title object and setting the string. However, this makes little difference, still taking about 90 seconds. Another solution would be to add an inner loop to update the title less often. Trial and error shows that an update every 50 steps has little impact on the runtime. The figure with the title is shown in Figure 4-2.

Figure 4-2. Animation of the box with a changing title
if rem(k,50)==0
set(ax.Title,'string',sprintf('Angle: %.5g deg',a(k)*180/pi));
end
Table 4-1 is a summary of the execution times on the reference MacBook. The times are as printed from toc; they are from a single run, not an average. Expect a variation in execution time of up to 10% across multiple runs.
Table 4-1. Execution Times for PatchAnimation
No title | |
|---|---|
pause off pause on (0.001 sec) | 0.780154 sec 17.254507 sec |
With title | |
Title | 90.761500 sec |
Set every step | 90.213318 sec |
Set every 50 steps | 20.218774 sec |
4.2 Playing Back an Animation
Problem
You want to store and play back an animation.
Solution
Save each frame of the animation into an AVI file using the VideoWriter class.
How It Works
In the following listing, you use VideoWriter to save the animation and read it into an AVI file. This line of code opens an AVI file:
vObj = VideoWriter('RotatingBox.avi');
The script is PatchAnimationStorage.m. The sections creating the box and figure aren’t shown because they are the same as the previous recipe. In this case, you only use 100 points for the four rotations; the execution time, including saving the movie, is about 4 seconds with pause off. Running the script in the Profiler shows that almost 90% of the execution time is spent in the writeVideo command.
%% Animate a cube using patch and store as an AVI file
% The figure and box are created as in PatchAnimation. This time we use a
% VideoWriter to store the frames in a movie.
%% Animate
n = 100;
a = linspace (0,8* pi ,n);
c = cos (a);
s = sin (a);
% Create a video file
vObj = VideoWriter('RotatingBox.avi');
open(vObj);
tic
for k = 1:n
pause (0.01);
b = [c(k) 0 s(k);0 1 0;−s(k) 0 c(k)];
vK = (b*v')';
set (p,'vertices',vK);
writeVideo(vObj, getframe (h));
end
toc
close (h)
close (vObj)
You can then play back your animation in any movie player, as shown in Figure 4-3.

Figure 4-3. Movie file playing back in a video player
4.3 Animate Line Objects
Problem
You would like to update a plot with line objects in a loop.
Solution
This is similar to Recipe 4-1, but you will update different properties of the graphics object. You’ll use the quad plot from Chapter 3 and add animation of a marker along the trajectory. This will also demonstrate adding a menu to a figure using uimenu.
How It Works
Start with the QuadPlot.m function. This creates four subplots to view a trajectory: one in 3D and three 2D views from different directions (see Figure 4-4). You must do a few things to add a marker that you can animate:
1. Add a time input.
2. Add a marker to each subplot and save the handles.
3. Add a text uicontrol to display the current time as the animation progresses.
4. Store the trajectory data and handles in the figure UserData.
5. Turn off the regular figure menu, and add an Animate menu with a Start function.
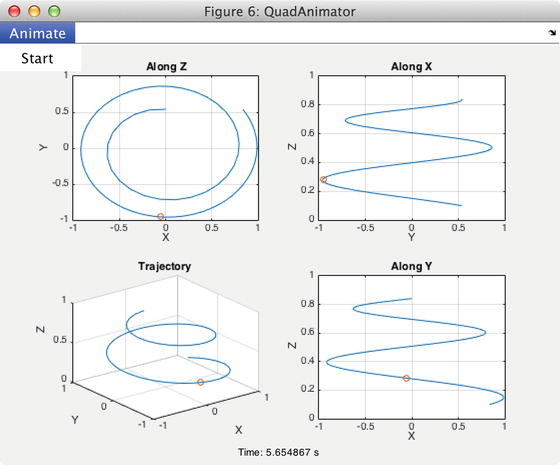
Figure 4-4. Frame of an animation of the quad plot
You use a nargin check to determine if you are creating the figure using t and x data, or entering a callback using the input 'update'. An alternative is to place the callback in a separate function; the figure executing the callback can be identified using a Tag property or using gcbf, as done here.
%% QUADANIMATOR Create a quad plot page with animation.
% This creates a 3D view and three 2D views of a trajectory in one figure. A
% menu is provided to animate the trajectory over time.
%% Form
% QuadAnimator( t, x )
%% Input
% t (1,:) Time data
% x (3,:) Trajectory data
%
%% Output
% None.
function QuadAnimator(t,x)
if nargin == 0
disp ('Demo of QuadAnimator');
t = linspace (0,4* pi ,101);
th = logspace (0, log10 (4* pi ),101);
in = logspace (-1,0,101);
x = [ sin (th).* cos (in); cos (th).* cos (in); sin (in)];
QuadAnimator(t,x);
return ;
end
if nargin ==2
h = figure ('Name','QuadAnimator');
set (h,'InvertHardcopy','off','menubar','none')
ma = uimenu (h,'Label','Animate');
ms = uimenu (ma,'Label','Start','Callback','QuadAnimator(''update'')');
m = Plot(x);
p = get (h,'position');
ut = uicontrol ('Style','text','String','Time: 0.0 s',...
'Position',[0 0 p(3) 20]);
d.t = t;
d.x = x;
d.m = m;
d.ut = ut;
set (h,'UserData',d);
else
h = gcbf;
d = get (h,'UserData');
Animate(d);
end
function m = Plot(x)
% Use subplot to create four plots of a trajectory
subplot (2,2,3)
plot3 (x(1,:),x(2,:),x(3,:));
hold on
m(3) = plot3 (x(1,1),x(2,1),x(3,1),'o');
hold off
xlabel ('X')
ylabel ('Y')
zlabel ('Z')
grid on
title ('Trajectory')
subplot (2,2,1)
plot (x(1,:),x(2,:));
hold on
m(1) = plot (x(1,1),x(2,1),'o');
hold off
xlabel ('X')
ylabel ('Y')
grid on
title ('Along⊔Z')
subplot (2,2,2)
plot (x(2,:),x(3,:));
hold on
m(2) = plot (x(2,1),x(3,1),'o');
hold off
xlabel ('Y')
ylabel ('Z')
grid on
title ('Along⊔X')
subplot (2,2,4)
plot (x(1,:),x(3,:));
hold on
m(4) = plot (x(1,1),x(3,1),'o');
hold off
xlabel ('X')
ylabel ('Z')
grid on
title ('Along⊔Y')
function Animate( d )
% Animate the markers on the subplots over time
for k = 1: length (d.t)
x = d.x(:,k);
set (d.m(3),'XData',x(1),'YData',x(2),'ZData',x(3));
set (d.m(1),'XData',x(1),'YData',x(2));
set (d.m(2),'XData',x(2),'YData',x(3));
set (d.m(4),'XData',x(1),'YData',x(3));
set (d.ut,'string', sprintf ('Time: %f s',d.t(k)));
drawnow ;
end
As can be seen, two subfunctions segregate the plotting and animating functionality. The animation sets the XData, YData, and ZData of the markers for the current time, and updates the text control. We used a drawnow to flush the events queue. The animation runs at a nice speed without requiring a pause command, but this may be different on your computer, so be prepared to experiment!
4.4 Implementation of a uicontrol Button
Problem
You want to use a button in a dialog box to stop a script as it is running.
Solution
Use uicontrol and figure to create a pop-up window with control, as shown in Figure 4-5.

Figure 4-5. UIControlDemo window
How It Works
Use two uicontrol calls in the script, UIControlDemo.m. The first puts a text box in the window. The second puts a button in the window. You don’t have to specify a style for a button, as this is the default style, but you may choose to specify it for clarity. The button control has a callback. A callback can be any MATLAB code or a function handle. In this case, just set the global stop to true to stop the loop. Note that we used true and false for the global boolean for clarity, although 1 and 0 will work.
%% Demonstrate the use of a uicontrol button with a callback
% Create a window with a button that interacts with a global variable in the script.
%% Build the GUI
% This is a global to communicate the button push from the GUI
global stop;
stop = false;
% Build the GUI
set (0,'units','pixels')
p = get (0,'screensize');
bottom = p(4) - 190;
fig = figure ('name','UIControlDemo','position',[340 bottom 298 90],...
'NumberTitle','off','menubar','none',...
'resize','off');
% The display text
speed = uicontrol ( 'Parent', fig, 'position', [ 20 40 280 15],...
'style', 'text','string','Waiting to start.');
% This has a callback setting stop to 1
step = uicontrol ( 'parent', fig, 'position',[ 40 40 40 20],...
'string','Stop', 'callback','stop = true;');
%% Run the GUI
for k = 1:1000
pause (0.01)
set ( speed, 'String', k );
if ( stop )
break ; %#ok<UNRCH>
end
%drawnow % alternative to pause
end
The position input is defined as
[left bottom width height]
The purpose of obtaining the computer’s screen size is to place the window near the top of the screen by assigning the bottom position parameter to the screen size minus the figure size (90 pixels tall), plus a 100 pixel margin; that is, p(4) − 190.
MATLAB’s code analyzer places an alert on the line with the break saying that the line is unreachable when stop is false. This is, in fact, the case, but you have the uicontrol to change that parameter. MATLAB can’t ascertain that, so you can add the %#ok<UNRCH> comment to suppress the warning. This comment can be automatically added by MATLAB (i.e., Autofixed), if you right-click the line with the warning and select “Suppress this statement...” in the pop-up menu.
Tip
Suppress warnings on lines with code that is reachable only by changes in your boolean logic.
Let’s check the execution time. Run the script with tic and toc twice, with pause turned off the second time.
>> tic; UIControlDemo; toc
Elapsed time is 11.601678 seconds.
>> pause off
>> tic; UIControlDemo; toc
Elapsed time is 0.147663 seconds.
If you want the animation to last more or less than the 11 seconds, you can adjust the pause time. You can see that the graphics loop alone takes only a small fraction of a second, despite updating 1000 times! This is because with pause off, the graphics are not forced to update every step of the loop. MATLAB flushes the graphics only when the script ends, unless you have one of the commands that flushes the system queue, such as pause, drawnow, or getframe. If you don’t want or need pause, use drawnow to force a graphics update every step of the loop. Table 4-2 shows the execution times with pause on or off and using drawnow instead. These are the times from a single run on the reference MacBook, not an average; expect a variation in runtimes of up to 10%.
Table 4-2. Execution Times for PatchAnimation
pause off | 0.147663 sec |
pause on (0.01 sec) | 11.601678 sec |
drawnow | 2.642504 sec |
pause AND drawnow | 13.785564 sec |
4.5 Display Status of a Running Simulation or Loop
Problem
You want to display the time remaining for a time-consuming task done in a loop.
Solution
Create a window with a text uicontrol to display the time remaining (see Figure 4-6).
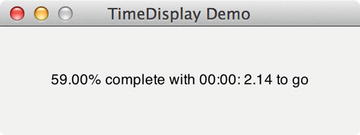
Figure 4-6. Time Display window
How It Works
TimeDisplayGUI implements the time window. It uses three actions with varargin. A persistent variable, hGUI, stores the steps and increments automatically for every update call. The following are some things to notice in this function:
The MATLAB function now is used to get the current date for timing purposes.
The number of steps completed is stored in hGUI.stepsDone.
The GUI only updates the text string every half second of real time.
It calculates an estimated amount of real time until script completion, assuming all steps take the same amount of time.
The built-in demo uses pause.
function TimeDisplayGUI( action, varargin )
%% TimeDisplayGUI Displays an estimate of time to go in a loop .
% Call TimeDisplayGUI( ' update ' ) each step; the step counter is incremented
% automatically using a persistent variable. Updates at 0.5 sec intervals .
%
% TimeDisplayGUI( ' initialize ' , nameOfGUI, totalSteps )
% TimeDisplayGUI( ' update ' )
% TimeDisplayGUI( ' close ' )
%
% You can only have one TimeDisplayGUI operating at once. The built-in demo uses
% pause to run for about 5 seconds.
%% Form:
% TimeDisplay( action, varargin )
%% Inputs
% action (1,:) ' initialize ' , ' update ' , or ' close '
% nameOfGUI (1,:) Name to display
% totalSteps (1,1) Total number of steps
%
%% Outputs
% None
persistent hGUI
if nargin == 0
% Demo
disp ('Initializing⊔demo⊔window⊔with⊔100⊔steps.')
TimeDisplayGUI( 'initialize', 'TimeDisplay⊔Demo', 100 );
for k = 1:100
pause (0.05)
TimeDisplayGUI( 'update' );
end
return ;
end
switch action
case 'initialize'
hGUI = BuildGUI( varargin{1} );
hGUI.totalSteps = varargin{2};
hGUI.stepsDone = 0;
hGUI.date0 = now;
hGUI.lastDate = now;
case 'update'
if ( isempty ( hGUI ) )
return
end
hGUI.stepsDone = hGUI.stepsDone + 1;
hGUI = Update( hGUI );
case 'close'
if ˜ isempty (hGUI) && ishandle(hGUI.fig)
delete ( hGUI.fig );
else
delete ( gcf )
end
hGUI = [];
end
function hGUI = Update( hGUI )
% Update the display
thisDate = now;
dTReal = thisDate-hGUI.lastDate; % days
if (dTReal > 0.5/86400)
% Increment every 1/2 second
stepPer = hGUI.stepsDone/(thisDate − hGUI.date0);
stepsToGo = hGUI.totalSteps − hGUI.stepsDone;
tToGo = stepsToGo/stepPer;
datev = datevec(tToGo);
str = FormatString( hGUI.stepsDone/hGUI.totalSteps, datev );
set ( hGUI.percent, 'String', str );
drawnow ;
hGUI.lastDate = thisDate;
end
function h = BuildGUI( name )
% Initialize the GUIs
set (0,'units','pixels')
p = get (0,'screensize');
bottom = p(4) − 190;
h.fig = figure ('name',name,'Position',[340 bottom 298 90],'NumberTitle','off',...
'menubar','none','resize','off','closerequestfcn',...
'TimeDisplayGUI(''close'')');
v = {'Parent',h.fig,'Units','pixels','fontunits','pixels'};
str = FormatString( 0, [0 0 0 0 0 0] );
h.percent = uicontrol ( v{:}, 'Position',[ 20 35 260 20], 'Style','text',...
'fontsize',12,'string',str,'Tag','StaticText2');
drawnow ;
function str = FormatString( fSteps, date )
% Format the time to go string
str = sprintf ('%4.2f%%⊔complete⊔with⊔%2.2i:%2.2i:%5.2f⊔to⊔go',...
100*fSteps, date (4), date (5), date (6));
The following script, TimeDisplayDemo, shows how the function is used. Figure 4-6 shows the resulting window.
%% Demonstrate a GUI that shows the time to go in a process
%% See also
% TimeDisplayGUI
%% Script constants
n = 10000;
dT = 0.1;
a = rand (10,10);
%% Initialize the time display
TimeDisplayGUI( 'initialize', 'SVD', n )
%% Loop
for j = 1:n
% Do something time consuming
for k = 1:100
svd (a);
end
% Display the status message
TimeDisplayGUI( 'update' );
end
%% Finish
TimeDisplayGUI( 'close' );
4.6 Create a Custom GUI with GUIDE
Problem
You have a repeating workflow and you would like to build a GUI to avoid changing parameters in your script repeatedly. For example, let’s take the rotating cube animation from Recipe 4-1 and put it in a GUI, so you can easily see the effect of different pause lengths.
Solution
You will use the GUI Design Environment (GUIDE) to create a GUI, starting from a blank figure. You need an edit box for the pause length, plus buttons for interaction.
How It Works
Type guide to start the GUIDE Quick Start window. From the Create New GUI tab, choose Blank GUI. This opens a blank figure entitled untitled1.fig in the editor, as seen in Figure 4-7.

Figure 4-7. Blank GUI in the GUIDE editor
Create the following items in the GUI using the buttons on the left:
Edit box for entering the pause time
Text label for the box
Button to start the animation
Start with the text label, which looks like a box with TXT inside. Click the button, then drag with the mouse until you have a good-sized box. It fills in with the words “Static Text”. Double-click the text box to open the control Inspector. From here, you can change the style and content of the text. Change the String to “Pause Duration (s)” and tab out of the field or hit Enter.
Next, add the edit box. This button looks like a box with EDIT inside. Draw the box for the edit box to the right of your text label. Double-click it to open the Inspector. Change the String to “0.01”, the default pause duration. Note that there is a Tag field below the String field. This is something like “edit1” by default. It is the identifier of the handle to this edit box in the GUI code. Change it to “pauseDur”.
Finally, add the button. This looks like a button with the letters OK on it. Place the button under your text and edit boxes. It reads “Push Button” by default. In the Inspector, change it to “Start”. Change the Tag to “startButton”.
You can change parameters of the figure itself as well by double-clicking the background, outside of your controls. Change the Color to the background color of your choice. Uncheck the box for InvertHardcopy, which allows your background color to show when you print the figure. The controls you added will be much easier to see with the altered background color.
There are options for implementing the animation. You can add an axes directly in the GUI, or maintain a separate window for the animation so that it looks the same as before. For now, you will use a separate figure window for the animation.
Resize the figure smaller if you like. Align your controls using Tools ➤Align Objects.... and save your new figure. Your figure should now look something like Figure 4-8.

Figure 4-8. Newly saved GUI
At this time, MATLAB creates an m-file to control the figure. The FIG-file maintains the geometry, style, and tag data that you saw in the Inspectors. The m-file handles the execution of the control callbacks. Figure 4-9 shows the list of functions in your new m-file, using the Tag names you specified when you edited the controls.

Figure 4-9. Functions in the newly saved GUI m-file
The main function, BoxAnimationGUI, contains a section of initialization code labeled DO NOT EDIT. You can add additional initialization code after this section, or in the OpeningFcn, where you have access to the handles data. The edit box, your control for entering the pause duration, has two related functions: a callback and a create function. The Start button has only a callback.
You need to do the following in the code:
1. Create the figure window and draw the cube in BoxAnimationGUI_OpeningFcn, storing the handle to the patch object so that you can access the vertices.
2. Convert the string in the edit box to a number and store it.
3. Run the animation in startButton_Callback.
There are two choices for converting the edit box contents string to a number. You can do it in the edit box callback, activated when the user tabs out of the box or hits Enter when it is active, or wait and convert the data only when the user pushes Start. This is an architectural decision that may, in a larger GUI, be impacted by relationships between the different parameters the user might be entering. In this simple case, it doesn’t make much difference, and you will convert it in the edit box callback. This does, however, bring up the issue of initialization of the data; you have to convert the default string for the pause duration into a double during initialization, or the user won’t be able to run the animation until activating the callback for the first time. Therefore, you need to add the following step to your list of coding tasks:
4. Initialize the value of the pause duration in pauseDur_CreateFcn.
Finally, you are creating an external figure with the GUI. With this default list of functions, there is no way to close the extra GUI when the main window closes. However, it is possible to add a close function that can take care of this cleanup step. From the FIG window, in the figure Inspector, the default CloseRequestFcn is closereq. If you click the small button to the left of this, MATLAB creates a close function and adds it to your m-file. This is your final piece of coding in the GUI:
5. Close the extra figure window in the figure1_CloseRequestFcn.
The fully realized GUI function is shown next. Note that the custom data fields that are added to the handles data structure are grouped together in a data substructure called data to avoid name clashes with the uicontrol handles. It is very easy to introduce bugs by inadvertently using the same name for a control object and the related parameter.
function varargout = BoxAnimationGUI(varargin)
% BOXANIMATIONGUI MATLAB code for BoxAnimationGUI.fig
% BOXANIMATIONGUI, by itself, creates a new BOXANIMATIONGUI or raises the existing singleton*.
%
% H = BOXANIMATIONGUI returns the handle to a new BOXANIMATIONGUI or the handle to
% the existing singleton* .
%
% BOXANIMATIONGUI( ' CALLBACK ' ,hObject,eventData,handles ,...) calls the local
% function named CALLBACK in BOXANIMATIONGUI.M with the given input arguments .
%
% BOXANIMATIONGUI( ' Property ' , ' Value ' ,...) creates a new BOXANIMATIONGUI or raises the
% existing singleton*. Starting from the left, property value pairs are
% applied to the GUI before BoxAnimationGUI_OpeningFcn gets called. An
% unrecognized property name or invalid value makes property application
% stop. All inputs are passed to BoxAnimationGUI_OpeningFcn via varargin .
%
% *See GUI Options on GUIDE ' s Tools menu. Choose "GUI allows only one
% instance to run (singleton)" .
%
% See also: GUIDE, GUIDATA, GUIHANDLES
% Edit the above text to modify the response to help BoxAnimationGUI
% Last Modified by GUIDE v2.5 25-Aug-2015 15:10:40
% Begin initialization code − DO NOT EDIT
gui_Singleton = 1;
gui_State = struct('gui_Name', mfilename, ...
'gui_Singleton', gui_Singleton, ...
'gui_OpeningFcn', @BoxAnimationGUI_OpeningFcn, ...
'gui_OutputFcn', @BoxAnimationGUI_OutputFcn, ...
'gui_LayoutFcn', [], ...
'gui_Callback', []);
if nargin && ischar(varargin{1})
gui_State.gui_Callback = str2func(varargin{1});
end
if nargout
[varargout{1: nargout }] = gui_mainfcn(gui_State, varargin{:});
else
gui_mainfcn(gui_State, varargin{:});
end
% End initialization code - DO NOT EDIT
% --- Executes just before BoxAnimationGUI is made visible .
function BoxAnimationGUI_OpeningFcn(hObject, eventdata, handles, varargin)
% This function has no output args, see OutputFcn .
% hObject handle to figure
% eventdata reserved - to be defined in a future version of MATLAB
% handles structure with handles and user data (see GUIDATA)
% varargin command line arguments to BoxAnimationGUI (see VARARGIN)
% ADDED CUSTOM CODE FOR RECIPE
% Design the box
x = 3;
y = 2;
z = 1;
f = [2 3 6;3 7 6;3 4 8;3 8 7;4 5 8;4 1 5;2 6 5;2 5 1;1 3 2;1 4 3;5 6 7;5 7 8];
v = [−x x x −x −x x x −x;...
−y −y y y −y −y y y;...
−z −z −z −z z z z z]'/2;
% Create the figure
h = figure ('name','Box');
p = patch ('vertices',v,'faces',f,'facecolor',[0.5 0.5 0.5],...
'linestyle','none','facelighting','gouraud');
ax = gca ;
set (ax,'DataAspectRatio',[1 1 1],'DataAspectRatioMode','manual')
grid on
axis ([−3 3 −3 3 −3 3])
xlabel ('x')
ylabel ('y')
zlabel ('z')
view (3)
light ('position',[0 0 1]);
% Choose default command line output for BoxAnimationGUI
handles.output = hObject;
% Additional variables required
handles.data.box = p;
handles.data.vertices = v;
handles.data. axis = ax;
handles.data. figure = h;
% END CUSTOM CODE
% Update handles structure
guidata (hObject, handles);
% UIWAIT makes BoxAnimationGUI wait for user response (see UIRESUME)
% uiwait(handles.figure1);
% --- Outputs from this function are returned to the command line .
function varargout = BoxAnimationGUI_OutputFcn(hObject, eventdata, handles)
% varargout cell array for returning output args (see VARARGOUT);
% hObject handle to figure
% eventdata reserved - to be defined in a future version of MATLAB
% handles structure with handles and user data (see GUIDATA)
% Get default command line output from handles structure
varargout{1} = handles.output;
function pauseDur_Callback(hObject, eventdata, handles)
% hObject handle to pauseDur (see GCBO)
% eventdata reserved - to be defined in a future version of MATLAB
% handles structure with handles and user data (see GUIDATA)
% Hints: get(hObject, ' String ' ) returns contents of pauseDur as text
% str2double(get(hObject, ' String ' )) returns contents of pauseDur as a double
% ADDED CUSTOM CODE FOR RECIPE
pauseDur = str2double ( get (hObject,'String'));
% Optional: add checking of pause value; can ' t be negative
handles.data.pauseVal = pauseDur;
guidata (hObject, handles);
% --- Executes during object creation, after setting all properties .
function pauseDur_CreateFcn(hObject, eventdata, handles)
% hObject handle to pauseDur (see GCBO)
% eventdata reserved - to be defined in a future version of MATLAB
% handles empty - handles not created until after all CreateFcns called
% Hint: edit controls usually have a white background on Windows .
% See ISPC and COMPUTER .
if ispc && isequal( get (hObject,'BackgroundColor'), get (0,'
defaultUicontrolBackgroundColor'))
set (hObject,'BackgroundColor','white');
end
% ADDED CUSTOM CODE FOR RECIPE
pauseDur = str2double ( get (hObject,'String'));
% Optional: add checking of pause value; can ' t be negative
handles.data.pauseVal = pauseDur;
guidata (hObject, handles);
% --- Executes on button press in startButton .
function startButton_Callback(hObject, eventdata, handles)
% hObject handle to startButton (see GCBO)
% eventdata reserved - to be defined in a future version of MATLAB
% handles structure with handles and user data (see GUIDATA)
% ADDED CUSTOM CODE FOR RECIPE
dT = handles.data.pauseVal; % pause duration from our edit box
p = handles.data.box; % handle to the patch object
v0 = handles.data.vertices; % initial vertices, before rotation
ax = handles.data. axis ; % axis, for updating title
n = 1000;
a = linspace (0,8* pi ,n);
c = cos (a);
s = sin (a);
for k = 1:n
b = [c(k) 0 s(k);0 1 0;−s(k) 0 c(k)];
vK = (b*v0')';
set (p,'vertices',vK);
if rem (k,25)==0
title (ax, sprintf ('Angle:⊔%.5g⊔deg',a(k)*180/ pi ));
end
pause (dT);
end
% --- Executes when user attempts to close figure1 .
function figure1_CloseRequestFcn(hObject, eventdata, handles)
% hObject handle to figure1 (see GCBO)
% eventdata reserved - to be defined in a future version of MATLAB
% handles structure with handles and user data (see GUIDATA)
% Hint: delete(hObject) closes the figure
delete (hObject);
% ADDED CUSTOM CODE FOR RECIPE
delete (handles.data. figure )
Tip
Store your added data in a unique substructure, so it can’t be confused with any of your graphics handles.
To run the GUI, either execute the m-file or use the Run button from the GUIDE figure editor. The GUI with the plot window opens, as shown in Figure 4-10.

Figure 4-10. Completed GUI with plot window
You can verify that changing the pause duration and running the animation works. Closing the GUI closes the plot with it. However, if you close the plot and try to run the GUI, you get an error; this is not a case that has been handled with this implementation. You could add a close function to the plot figure to either ask the user for confirmation using questdlg or close the GUI with it. Alternatively, the GUI could check that the figure window exists, and re-create it if it was inadvertently closed. In order to do this, the initialization code needs to be moved to its own function.
As an exercise, try implementing the pause time via a slider instead of an edit box, with a range of 0 to 0.1 seconds. You may also want to try adding additional controls for the number of steps in the animation.
4.7 Build a MATLAB App from Your GUI
Problem
You would like to share your new GUI with others as a packaged app.
Solution
MATLAB provides a utility to package a GUI (or script) as an app, which can then easily be installed and uninstalled by users. You will use the GUI created in the previous recipe as an example.
How It Works
You create an app by specifying the main file that runs it, or in this case, the main function for the BoxAnimationGUI from the previous recipe. The packaging utility performs a dependency check and includes any other related functions and files in your path. The resulting binary file can then be distributed and installed by others.
The app utilities are accessed from the Apps tab of the MATLAB Command Window. This tab has buttons to Get More Apps, Install App, and most importantly for this recipe, Package App. The tab also has a ribbon showing any apps you currently have installed. Clicking Package App opens a window where you enter the file and metadata information for your app.
The first step, starting from the upper left of the Package App window, is to select the main file for your app. Keep in mind that this doesn’t have to be a GUI; for instance, you could have a script that gathers user input from the command line using input or inputdlg. Click “Add main file” and select BoxAnimationGUI.m. MATLAB automatically fills in the name of the app from the name of your main file and does a dependency check. In this case, the only dependency is the corresponding FIG-file, BoxAnimationGUI.fig. In the bottom left you can add any additional shared resources that can’t be found by MATLAB’s search utility, such as files called via eval or load with string names.
In the center of the Package App window, you add additional information to describe the app. You can select an icon, including a custom icon if you have one; assign a version number; write a summary and a longer description; and provide a screenshot. The icon you choose is displayed in the Apps toolbar of MATLAB when users install your app.
Once you have entered all the information for the app and verified the dependencies, you package the files into the app on the right of the Package App window. You can change the output folder before creating the package; the app installer that is generated is saved with the .mlappinstall extension.
Your package data is saved in a project file with a .prj extension. This allows you to repackage your app as needed during development; you can increment the version number for bug fixes or major version changes.
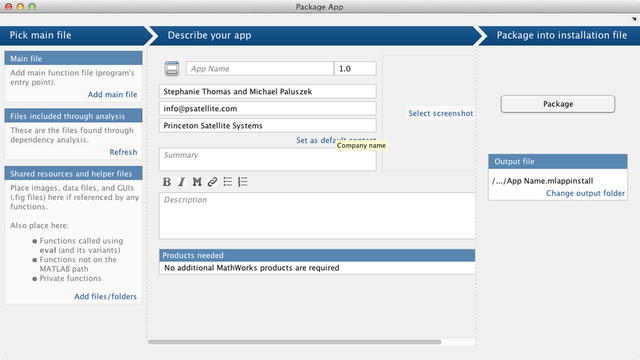
Figure 4-11. Package app window

Figure 4-12. Packaged app results with project file
Summary
This chapter introduced figure controls and updating graphics in a loop. MATLAB provides a rich GUI building environment, including buttons, sliders, list boxes, menus, and plot axes. You can create uicontrols directly or use the GUIDE tool to place controls with the mouse. It is important to consider performance when designing graphics that update, as some operations have widely disparate performance, such as strings vs. object geometry. Table 4-3 lists the code developed in the chapter.
Table 4-3. Chapter Code Listing
File | Description |
|---|---|
BoxAnimationGUI.fig | File with GUI definition. |
BoxAnimationGUI.m | MATLAB code implementing BoxAnimationGUI.fig. |
BoxAnimationGUI.prj | File storing information for creating an app from BoxAnimationGUI.m. |
PatchAnimation | Animate a 3D patch in a for loop. |
PatchAnimationStorage | Animate a cube using patch and store as an AVI file. |
QuadAnimator | Create a quad plot page with animation. |
TimeDisplayDemo | Demonstrate a GUI that shows the time remaining in a process. |
UIControlDemo | Demonstrate the use of a uicontrol button with a callback. |