
Chapter Ten
Quality Management Techniques
B. G. Dale, B. Dehe and D. Bamford
This chapter provides an overview of six core quality management techniques and of ‘Six Sigma’, a strategic improvement approach, often deployed in an organization's improvement process.
With thanks to I. Ferguson and B. G. Dale (2007) Quality Function Deployment (QFD) is a systematic procedure which is used to help build quality into the upstream processes and also into new product development. It helps to avoid problems in the downstream production and delivery processes and will consequently shorten the new product/service development time. The concept helps to promote proactive rather than reactive development by capturing and measuring the ‘voice of the customer’. QFD is a technique that is used in the first place for translating the needs of the customers into design requirements, being based on the philosophy that the ‘voice of the customer’ drives all company operations. It requires reliable data from the following diverse sources: customers, design functionality, costs and capital, reliability, reproducibility. It employs a step-by-step approach from customer needs and expectations through the four planning phases of:
The technique of QFD seeks to identify those features of a product or service which satisfy the real needs and requirements of customers (market- or customer-required quality). A critical part of the analysis is that it takes into account discussions with the people who actually use the product in order to obtain data on issues such as:
The voice of the customer is the cornerstone of QFD. Hence, talking and listening to the customer is paramount to understanding their real needs and requirements; of the three methods outlined below, the preferred method is direct contact with the customer.
In using these methods for understanding customer requirements typical issues that need to be considered include:
The main objectives are to:
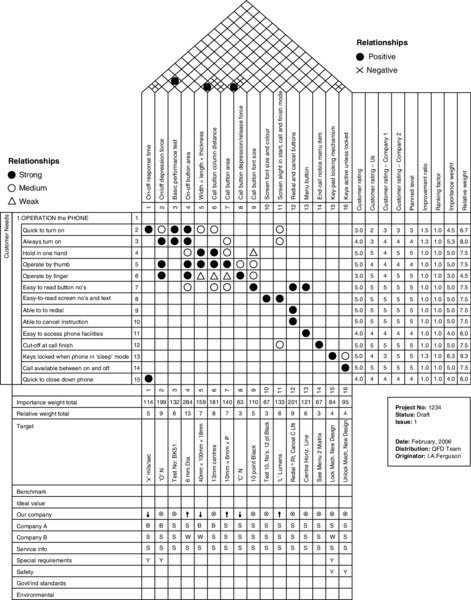
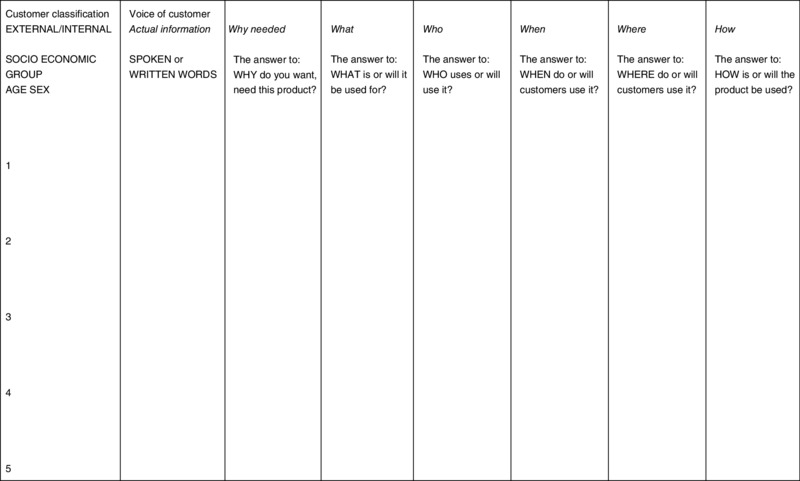
An example of the ‘house of quality’ derived from the product-planning phase of QFD is shown in Figure 10.1. Figure 10.1 The house of quality Source: Ferguson and Dale 2007:388 In simple terms, the key elements of the product planning stage comprise the following. The scope of the project should be clearly outlined, including targets, operating constraints and time scale. A clearly defined mission statement should be produced and a team formed. It is useful to create a business model which includes market definition and size, product life history, competitive products and prices, projected sales, prices and costs, and the estimated capital requirements and likely payback. Gathering the voices of customers can be done in different ways as previously detailed. The information gathered can be entered into a chart similar to that shown in Figure 10.2, complete with full information on why the product is needed, for what purposes, who uses it and when, and where and how it is used. This information provides the basis for more easily translating the customer's voice into customer needs which can be satisfied by design features. For example, ‘In the UK, mainly men will use the mobile phone while on the move’ will translate the needs of that group of customers into a requirement for one-handed operation of the phone, including the ability to dial and hold from the same hand. The phone will then conveniently have design features of the width and depth of the mobile phone, button areas and depression forces, etc. (see Figure 10.1). Figure 10.2 Gathering the voice of the customer and interpreting it into customer needs Source: Ferguson and Dale 2007:389 This is the key to prioritization and decision-making on critical design features, which will be a common thread throughout all the stages of the QFD process. The columns to the right in Figure 10.1 are used in the following way.
This is a very challenging step for engineers. The key is to look for characteristics, features and technical requirements that express the customers' needs and are recognizable as quality features of the product, rather than finite design specifications. This assists in examining the best option for a number of criteria. The centre block of the house of quality shown in Figure 10.1 represents the relationship strength of each customer need with every design feature. The solid circle symbol represents a strong relationship, the open circle a medium relationship, and the triangle a weak relationship. These relationships are usually equated to numbers 9, 3, and 1 respectively. The difference between them represents a means of emphasizing a design feature that is very important over one that is less so. If there is no relationship between a customer need and a design feature, this will be highlighted by an empty row, indicating that the need will not be satisfied. On the other hand, if there is no relationship between a design feature and a customer need, it will result in an empty column, indicating that the design feature is not necessarily required from a customer perspective. This calculation indicates the strength of each design feature required in relation to other design features, and the priority from the customer's perspective of the need that created the design feature. To achieve these two parts the weight of importance of each design feature is the multiplication of the relative weight of the customer need and the particular relationship that has been designated in the central matrix. For example, from Figure 10.1 ‘Quick to turn on’ is 6.7 in customer relative weight, satisfied by one of the design features ‘On/off response time’. The relationship between them is strong (9). Thus 9 × 6.7 = 60.3 is one component part of the importance weight of the ‘On/off response time’ design feature. Each design feature needs reconciling with other design features. This is recorded in the roof of the house of quality. Its purpose is to relate the interactions to the proposed target values of design features. A positive relationship is an opportunity to reduce a value that may help to reconcile an interacting negative relationship. Negative relationships require determined design alternatives to weaken the relationship, as they are potential sources of conflict and quality assurance problems. Each design feature should have a target value assigned to it in order to act as a benchmark in the choice of design concepts at a later stage in the process. The target value will normally be best in class and one that will satisfy the customer to the point of delight. The values are not design specifications and could well be enhanced as the QFD process proceeds. They will certainly be equal to or better than any competitively benchmarked design. These target values may be modified in the light of the information contained in the roof of the house. The reconciliation between relationships is helped by declaring the feature that is a constraint and adjusting the other value according to its ideal value. Technical comparisons are made with the design features, both from the company's existing product range and also those competitive ranges which are under investigation. The comparisons may be made on some form of quantitative scale or on a ‘same’, ‘better’, and ‘not so good’ basis. Reference will be made to competitive designs where the feature has a higher assessment, and if this cannot be bettered it should be adopted. The customer's evaluation of the company's product and that of its competitors should also be considered. In theory, the engineer's technical evaluation and the customer's evaluation should agree. If this is not the case then the target value chosen is not perceived as the best one. Service information affecting design features from warranty, complaints, field failures, defect records, internal quality costs, and product performance is recorded. The purpose of this is to ensure that concepts and design work later in the process will eliminate these faults. Safety items, special regulatory items, and environmental issues affecting any design feature are also recorded. The purpose of this is that any concept or product definition must be seen to satisfy these requirements. The following are key steps in the effective implementation of QFD:
The QFD process provides a powerful structure for product and process development. When it is used in an effective manner it can bring a correct customer focus to designs that will perform to a high degree of satisfaction with reliability and cost-worthiness. It shortens the development cycle for the design and results in fewer engineering changes. In this way the product/service which the customer receives not only meets their needs but also, if the customer interface has been done correctly, there can be unexpected product features which will cause delight and product loyalty. There will also be a common thread through all operations which is traceable back to what the customer really wants. With thanks to I. Ferguson and B. G. Dale (2007) The design of experiments is a series of techniques that involve the identification and control of parameters which have a potential impact on the performance and reliability of a product design and/or the output of a process, with the objective of optimizing product design, process design and process operation, and limiting the influence of noise factors. The methodology is used to analyse the significance of effects on system outputs of different values of design parameters. The objective is to optimize the values of these design parameters to make the performance of the system immune to variation. The concept can be applied to the design of new products and processes or to the redesign of existing ones, in order to:
There are several methodologies of experiments such as the trial and error, the full factorial, the fractional factorial and the Taguchi method. In this section only an overview of the Taguchi technique is provided. Design of experiments historically required a great deal of statistical knowledge and understanding, which most industrial users of experiments found somewhat intimidating. Over the years much effort has been devoted to simplifying the task of experimentation. In the late 1970s, the work of Genichi Taguchi on experimental design made what is regarded by many as a major breakthrough in its application. Dr Taguchi was a statistician and electrical engineer who was involved in rebuilding the Japanese telephone system, and has been involved in applying design of experiments in the Japanese electronics industry for over 30 years. Since the 1980s, Taguchi (1986) has been an acknowledged worldwide consultant in his methodology. He promotes three distinct stages of designing in quality:
Taguchi's approach also addresses the following:
Taguchi's methods (i.e. engineering, experimental design and data analysis) have proven successful both in Japan and the West, and those organizations which have adopted his methods have succeeded in making continuous improvement. There is little doubt that his work has led to increased interest by engineers in a variety of approaches and methodologies relating to design of experiments. He has provided a technique to analyse the effects of control factors on variability with respect to noise. However, it should not be overlooked that a number of other people have made significant improvements with the other approaches to experimental design. Based on Ferguson (1995) the key steps in designing and running a fractional factorial experiment are outlined in brief below.
Experimental design using a variety of matrices which suit different conditions is a key technique for understanding the effect of each controllable factor, be it a product or a process design, in minimizing variation while centring the output on a target value. It is a major technique in investigating quality problems. Statistical design of experiments is a complex subject, but it is possible to develop ‘easy-to-use’ methods. With thanks to J. R. Aldridge and B. G. Dale (2007) This section provides an overview of the concept of failure mode and effects analysis (FMEA), and its value as a planning tool to assist with building quality into an organization's product, service and processes (Dale and Shaw 1990a). The technique of FMEA was developed around 1962 in the aerospace and defense industries as a method of reliability analysis, risk analysis and risk management. It is a systematic and analytical quality planning tool for identifying, at the product, service and process design and development stages, what might potentially go wrong, either with a product (during manufacture, or during end-use by the customer), or with the provision of a service, thereby aiding fault diagnosis. The use of FMEA is a powerful aid to advanced quality planning of new products and services, and can be applied to a wide range of problems which may occur in any system or process. Its effective use should lead to a reduction in:
In addition, there will be improved customer satisfaction and confidence as products and services are produced from robust and reliable production and delivery methods. It also has relevance in the case of product liability. There are two categories of FMEA: design and process. A design FMEA assesses what could, if not corrected, go wrong with the product in service and during manufacture as a consequence of a weakness in the design. Design FMEA also assists in the identification or confirmation of critical characteristics. On the other hand, process FMEA is mainly concerned with the reasons for potential failure during manufacture and in service as a result of non-compliance with the original design intent, or failure to achieve the design specification. The procedure involved in the development of FMEA examines ways in which a product service or process can fail and is known as progressive iteration. In brief, it involves the following steps:
The RPN comprises an assessment of occurrence, detection and severity of ranking and is the multiplication of the three rankings:
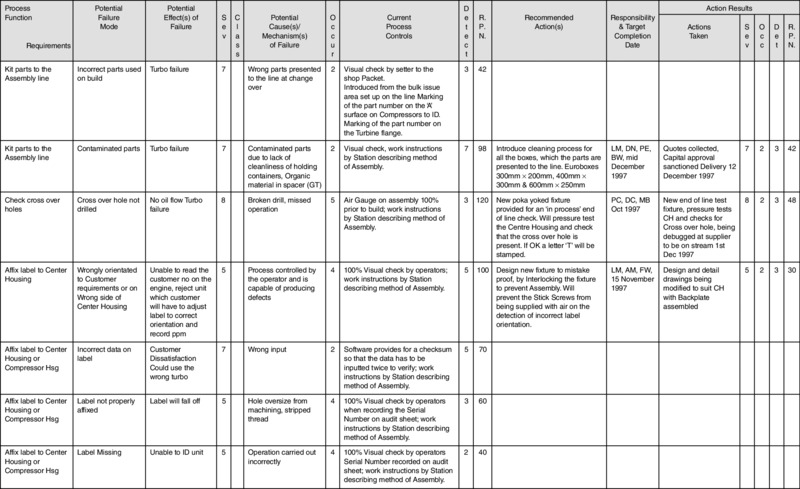
The resulting RPN should always be checked against past experience of similar products, services and situations. The requisite information and actions are recorded on a standard format in the appropriate columns. An example of a process FMEA from Allied Signal Automotive is shown in Figure 10.3. The FMEA is a live document and should always be modified in the light of new information or changes. Figure 10.3 Potential failure mode and effects analysis (process FMEA) Source: Dale and Shaw (2007:428) From the design FMEA, the potential causes of failure should be studied and actions taken before designs and drawings are finalized. When used in the proper manner, FMEA prevents potential failures occurring in the manufacturing, production and/or delivery processes or end product in use, and will ensure that processes, products and services are more robust and reliable. It is a powerful technique and a number of well-publicized product recall campaigns could conceivably be avoided by the effective use of FMEA. However, it is important that FMEA is seen not just as a catalogue of potential failures, but also as a means for pursuing continuous improvement. Nor should it be viewed as a paperwork exercise carried out to retain business, as this will limit its usefulness. The concept, procedures and logic involved with FMEA are not new: every forward-thinking design, planning and production engineer and technical specialist carries out, in an informal manner, various aspects of FMEA. In fact, most of us in our daily routines will subconsciously use a simple informal FMEA. However, this mental analysis is rarely committed to paper in a format which can be evaluated by others and discussed as the basis for a corrective action plan. What FMEA does is to provide a planned systematic method of capturing and documenting this knowledge. It also forces people to use a disciplined approach, and is a vehicle for obtaining collective knowledge and experience through a team activity. A pilot study carried out at Girobank within the data capture services of the headquarters operations directorate has confirmed that FMEA is of benefit in paper processing-type activities. The technique has since been incorporated into an interdepartmental improvement project to address sub-process improvement relating to a particular stream of work. One of the main benefits of process FMEA is that it has helped to address the complex internal customer–supplier relationship while improving sub-process procedures. The application of process FMEA is considered by the bank as a valuable improvement tool and will be developed alongside other such tools with Girobank's ongoing training initiatives (see
Gosling et al. 1992). For a design FMEA the potential failure mode may be caused, for example, by an incorrect material choice, part geometry, or inappropriate dimensional specification. The procedure then identifies the effects of each potential failure mode, examines the causes of potential failure and reviews current controls for the design FMEA, which usually include some form of design verification programme. In the case of a turbocharger this includes items such as material pull tests, heat-cycling tests of components subject to high temperatures, life cycle fatigue tests to failure, static engine testing, and dynamic engine testing on development vehicles. With regard to the latter, these tests are often carried out by the customers as part of their overall engine/vehicle evaluation programme. Past experience on similar products is often used to verify the validity of certain component parts for a design. The occurrence for a design FMEA is an estimate, on a scale of 1–10, of the potential failure occurring at the hands of the customer, a ranking of 1 indicating that the failure is unlikely (typifying a possible failure rate of <1 in a million), and a ranking of 10 indicating an almost inevitable failure (typically 1 in 2). The detection criterion rests on the likelihood of a current design verification programme highlighting a potential failure mode before it reaches the customer. A ranking of 1 indicates almost certain detection, and a ranking of 10 indicates that the current controls are very unlikely to detect the failure mode before dispatch to the customer. The severity-of-effect ranking is again on a 1–10 basis. A ranking of 1 indicates that the customer is unlikely to notice any real effect, in the case of a vehicle, on performance or the performance of the sub-system. A ranking of 10 implies that a potential failure mode could affect safe vehicle operation and/or non-compliance with government regulations. A severity ranking cannot be altered by any means other than by redesign of a component or assembly; it is a fixed feature. Clearly serious implications exist under product liability legislation for high-severity rankings and these high rankings must be addressed as a matter of urgency. The activity following the evaluation of current controls is the determination of the RPN. In the case of a process FMEA the potential failure mode may be caused by, for example, the operator assembling the part incorrectly, or by variation in the performance of the equipment or data entered incorrectly into a system by an operator. The procedure then, as in the case of a design FMEA, identifies the effects of each potential failure mode, examines the causes of the potential failure mode, and reviews the current controls. For a process FMEA the current controls might be operator-performed inspection or SPC information on the capability of the process. The occurrence for a process FMEA is again based on a 1–10 scale, with a ranking of 1 indicating that a failure in the manufacturing process is almost certain not to occur. This is based on past experience of a similar process, both within the factory and in the field with the customer, typically identified by a high process capability value. Conversely, a ranking of 10 indicates that the failure is almost certain to occur and will almost definitely reach the subsequent operation or customer if counter-measures and controls are not put in place. An occurrence ranking of 10 suggests, and indeed demands, that corrective action be undertaken because it highlights a potentially incapable process. Detection rankings for a process FMEA indicate for a ranking of 1 that the potential failure mode is unlikely to go undetected through the manufacturing process. A ranking of 10 suggests that current manufacturing inspection controls and procedures are unlikely to detect the potential failure mode in the component or the assembly before it leaves the factory, and that urgent corrective action is required. It is interesting to note that a successive inspection check (e.g. bolt torque conformance) does not result in the detection ranking being markedly reduced; it would still be assigned a ranking of between 7 and 10 since experience indicates that 100 per cent subsequent inspection is only capable of detecting 80 per cent or so of defects. The situation would be assessed differently in the case of automated inspection. A much better method of detection is to introduce a successive check at a subsequent operation whereby the operator is unable to perform his or her operation unless the previous operation has been correctly executed. This can be achieved by designing fixturing in such a way that it will only accept conforming parts from a previous operation. Another method is to install error-proofing devices at the source. The criterion for the severity-of-effect ranking is determined in a similar manner to that for a design FMEA. The activity following the evaluation of current controls for a process FMEA is again the determination of the RPN. To apply FMEA effectively it is necessary to obtain some real figures for the calculation of the RPN, in particular for internal and external failure rates. These can then be used for compilation of the occurrence ranking. This was achieved at the plant by analysing and summarizing external failure and internal reject data. External failure data are collated using computer aids by field service engineers. The data are obtained from visits to customers to review units which have failed, the disposition of which is determined (i.e. whether the failure liability is due to the plant or the customer or if, in some cases, there is in fact no fault found). Internal process failure rates are collated weekly by the quality assurance department. The data are obtained from rejection notes attached to non-conforming parts by production and inspection personnel. It is important to realize that if a process FMEA is being compiled for a new product, for which no internal or external failure rate history is known, then it is acceptable to use judgment on failure rates for a similar product. At the plant an analysis was performed of the external failure rates over a five-year period using a spreadsheet program on a computer. These failure rates were then ranked highest to lowest to identify the highest occurring items. The external data were then compared with the internal failure rate data and comparisons made to identify trends in which external and internal failure rates were correlated. When looking at external failure rates, a degree of caution needs to be exercised. In terms of the company's products, a guarantee is given, from the time a product is sold, to the end-user. It is impractical to consider the previous year of warranty data only, since for many applications, particularly for the commercial diesel business, the completed vehicle may not be put into use for up to 18 months following the date of manufacture. Additionally some customers are relatively slow in requesting visits for claims evaluation. This obviously leads to a distorted overall picture – which makes the five-year evaluation more realistic. Consideration must also be taken of any high-occurrence failures attributable to one cause. Investigation should be undertaken to see if the cause has been eliminated and, if so, then these should be ignored. The emphasis should be placed on identifying consistent patterns of regularly occurring effects of failure. These types of failure are the ones to which corrective action should be applied. Following the determination of the RPN it is usual to perform a Pareto analysis and address the potential failure modes in order of decreasing RPN. Determining the figure for an acceptable RPN is really a matter of the application of common sense. If 100 is assumed to be the acceptable maximum then this should be checked against past experience. The rule to be applied is to adopt a consistent approach for each of the rankings, and generally it will be found that the high RPNs are as expected. This takes the form of identifying recommended action(s) and assigning personnel to take appropriate improvement measures by a particular date, which should be before scheduled product release to the customer. Following satisfactory completion of the actions the RPN can be recalculated, and if it is below the agreed acceptable limits then the corrective action can be assumed to be adequate. If this is not the case, then the design or process must be readdressed by appropriate corrective actions. For a design FMEA the potential failure causes must be studied before drawings are released to production status. In the case of the process FMEA, all the controls and measures to ensure design intent which are carried forward into the final product must be implemented. If this is not done properly then problems relating to identified failure modes will occur during manufacture. In the case of a new process, potential failure modes may be overlooked because of lack of experience. However, if this is discovered at a later date, these must be included in both process and design FMEAs for future consideration. Finally, a few dos and don'ts are given which may help organizations to avoid some of the difficulties and traps typically encountered in the preparation and use of FMEA. Do Don't With thanks to B. G. Dale and P. Shaw (2007) Statistical process control (SPC) is not a new concept; its roots can be traced back to the work of Shewhart (1931) at Bell Laboratories in 1923. The control charts in use today for monitoring processes are little different from those developed by Shewhart for distinguishing between controlled and uncontrolled variation. Today, in the West, there is considerable interest in quality and how it might be improved effectively and economically. It is the pursuit of quality improvement that has promoted the revitalized interest in SPC. The aim of this section is to give an overview of SPC and its concepts, both statistical and philosophical, to examine the issues involved with implementation, and to illustrate some typical problems encountered in the introduction and application of SPC. For more detailed studies see Dale and Shaw (1989, 1990b and 1991) and Dale et al. (1990). Statistical process control is generally accepted as a means to control the process through the use of statistics or statistical methods. There are four main uses of SPC:
SPC is about control, capability and improvement, but only if used correctly and in a working environment that is conducive to the pursuit of continuous improvement, with the full involvement of every company employee. It is the responsibility of the senior management team to create these conditions, and they must be prime motivators in the promotion of this goal and provide the necessary support to all those engaged in this activity. It should be recognized at the outset that on its own SPC will not solve problems; the control charts only record the ‘voice of the process’ and SPC may, at a basic level, simply confirm the presence of a problem. There are many tools and techniques which guide and support improvement and, in many instances, they may have to be used prior to the application of SPC, and concurrently with it to facilitate analysis and improvement. The application of SPC can potentially be extensive. It is not simply for use in high-volume ‘metal cutting’; it can be used in most manufacturing areas, industrial or processing, and in non-manufacturing situations, including service and commerce. When first evolved, the control chart, using data that provided a good overall picture of the process under review, had control limits set out from the process average, which reflected the inherent variation of the process. This variation was established from an accurate review or study, and consequently the limits were deemed to reflect the actual ‘capability’ of the process. The charts so constructed were actually called ‘charts for controlling the process within its known capability’. As the word ‘capability’ has in the last decade been taken to mean something slightly different, the charts tend now to be called ‘performance-based’ charts (i.e. to control the process within its known performance). When this idea was discussed with potential users, the question was asked, ‘But what if the control limits are outside the specification limits?’ This resulted in the development of a chart where the control limits were set in from the specification limits. The distance these limits are set in is a function of the inherent variation in the process. Those processes with greater variation will have limits which are set in further from the specification limits than those with less variation. If an organization's quality objective is to produce parts or services to specification, the so-called tolerance-based chart may prove useful, and signals are given to alert operational personnel to the likelihood of producing out-of-specification products. This type of chart does not encourage the pursuit of improvement in process performance. Using the performance-based charts with limits which reflect the inherent variation of the process and having some statistical estimate of this variation, the objective is to establish its source(s), perhaps using experimental design tools and appropriate tools and techniques, and strive to reduce it on a continuous improvement basis. The consequence of this is that control limits should, over time, reduce, reflecting the reduction in process variation and thereby demonstrating an organization's commitment to continuous improvement. This reduction in variation is confirmed by increased values or measures of process capability. If an organization is not using SPC in this manner, management needs to critically evaluate their use of SPC. Products manufactured under the same conditions and to the same specification are seldom identical; they will most certainly vary in some respect. The variation, which may be large or almost immeasurably small, comes from the main constituents of a process – machine, manpower, method, material, and Mother Nature. The measuring system itself may also give rise to variation in the recorded measurement; this is why repeatability and reproducibility studies are so important.
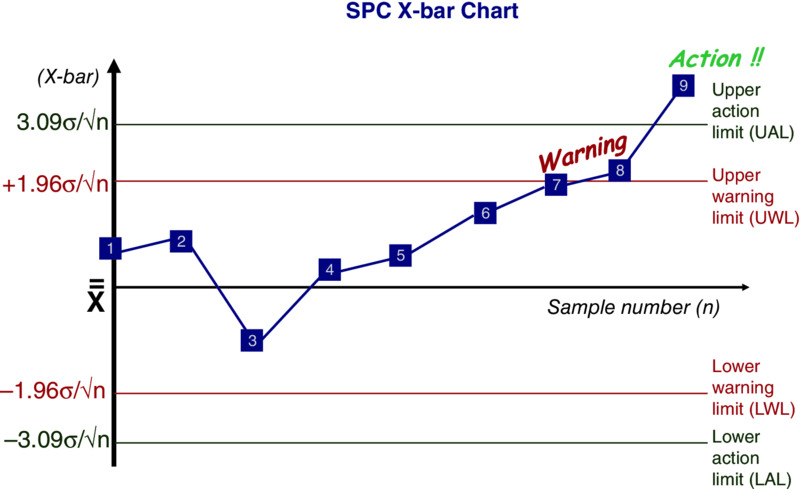
An important means of improvement is the reduction of variation. SPC is a very useful technique because, given the capability of the measuring system, it ascertains the extent of the variation and whether it is due to special or common causes of variation, process improvement being achieved by removal of either or both causes. It should be stressed that while SPC, if properly used, will give an indication of the magnitude of the variation, it will not give the source. The efforts of management, technical, engineering, and management services and site service activities should be directed at establishing the likely source or sources of variation and, more importantly, reducing them continuously. The first step in the use of SPC is to collect data to a plan and plot the gathered data on a graph called a control chart, as shown in Figure 10.4. Once the process is rendered stable by the identification and rectification of special causes of variation, its process capability can be assessed. The next task is to reduce, as much as possible, the common causes of variation so that the output from the process is centred around a nominal or target value. This is a continuing process in the pursuit of continuous improvement. It is not the natural state of a process to be in statistical control, and a great deal of effort is required to achieve this status and a great deal more to keep it so. The amount of this effort and its focus is a function of senior management within their overall remit. Figure 10.4 Sample SPC chart Special (or assignable) causes of variation influence some or all the measurements in different ways. They occur intermittently in the form of shocks and disturbances to the system and reveal themselves as unusual patterns of variation on a control chart. Special causes should be identified and rectified and hopefully, with improved process or even product design, their occurrence will in the long term be minimized. In the short term, their presence should be highlighted and a response programme established to deal with them. It is imperative in the management and control of processes to record not only the occurrence of such causes, but any remedial action that has been taken, together with any changes that may occur or have been made in the process. This provides a valuable source of information in the form of a ‘process log’, to prevent the repetition of mistakes and enable the development of improved processes. Typical special causes may be:
Common (or unassignable) causes influence all measurements in the same way. They produce the natural or random pattern of variation observed in data when they are free of special causes. Common causes arise from many sources and do not reveal themselves as unique patterns of variation; consequently, they are often difficult to identify. If only common cause variation is present, the process is considered to be stable, hence predictable. Typical common causes may be:
In the pursuit of process improvement it is important that a distinction is made between special and common cause sources of variation because their removal may call for different types and levels of resources and improvement action. Special causes can usually be corrected by operational personnel – the operator and/or first-line supervisor. Common causes require the attention of management, engineering, technical, management services, or site services personnel. Teams made up of relevant personnel are often set up to eliminate special and common causes of variation. Operational personnel often have a considerable knowledge of process parameters and they should be included in such teams. The capability of a process is defined as three standard deviations on either side of the process average when the process is normally distributed. The Cp index is found as the result of comparing the perceived spread of the process with the appropriate specification width or tolerance band.
Today, customers are specifying to their suppliers minimum requirements for Cp; for example:
In simple terms this means that all parts should lie comfortably inside the specification limits. Given that the process ‘spread’ is equal to six standard deviations the following should be noted:
It follows that:
As the Cp index compares the ‘spread of the process’ with the tolerance band, it is primarily concerned with precision – it takes no account of the accuracy or setting of the process. It is for this reason that Cp is often defined as ‘process potential’ capability, i.e. what the process is potentially capable of achieving. The Cpk index, however, takes into account both accuracy and precision by incorporating in the calculations, G or x-bar, i.e. the process (or grand) average. There are two formulae:
where USL is the upper specification limit, or:
and LSL is the lower specification limit. It is customary to quote the smaller of the two values, giving the more critical part of the measurements distribution. Similar minimum requirements are often prescribed for Cpk as for Cp mentioned above. Because Cpk indices assess both accuracy and precision, they are often defined as ‘process performance capability’ measures. That is, the Cpk gives an estimate of how the process actually performs (i.e. its capability) whereas the Cp gives an estimate of its potential (i.e. what it could do if the setting was on the nominal or target value of the specification). In the calculation of both Cp and Cpk it is necessary to know or obtain an estimate of the process standard deviation (H). The standard deviation can be estimated by using the formula:
where d2 is a constant derived from statistical tables and is dependent upon the sample size. This exploits the relationship between the range and the standard deviation which was mentioned earlier in the chapter. With reference to this the following points should be noted:
The comments made on capability relate to data collected over the long term (many days or shifts) from a stable, in-control and predictable process. Often short-term capability needs to be investigated, particularly for new products or processes (it may be required as part of supplier verification programme, i.e. initial sampling requirements or first article inspection). The time scale is then dramatically reduced to cover only a few hours' run of the process. It is recommended that data are collected in the same manner as for initial control chart study, but the frequency of sampling is increased to get as many samples (of size n) as possible to give a good picture of the process (i.e. about 20 samples of size n). Data are plotted on the control chart with appropriate limits, but the following indices are calculated:
The formula is exactly as for Cp and Cpk but the minimum requirements may be higher (e.g. Pp ≥ 1.67), i.e. 1.67 implies the tolerance band is 10 standard deviations wide and the process ‘spread’ equals six standard deviations, i.e.
It should not be forgotten that all capability indices are estimates derived from estimates of the process variation (σ). The reliability or confidence in the estimate of the process standard deviation is a function of:
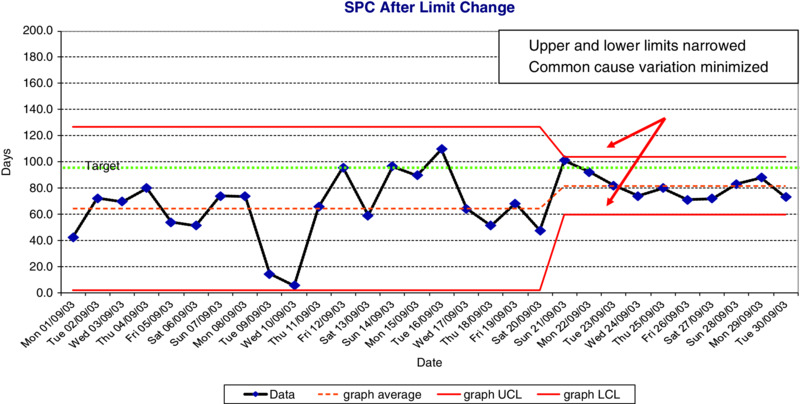
The purpose behind the application of SPC is straightforward – to reduce variation in process output, first by establishing whether or not a process is in a state of statistical control, and secondly, if it is not, getting it under control by eliminating ‘special’ causes of variation. Finally, SPC may be used to help reduce ‘common’ causes of variation, as shown in Figure 10.5. Figure 10.5 SPC Chart after limit change However, a number of organizations do encounter problems in the introduction and application of SPC. According to Dale and Shaw (2007) the top three difficulties in introducing SPC were:
The three main difficulties in its application were:
When the range of difficulties is studied further (see Dale et al. 2007) it is apparent that they can be categorized under two main headings: management commitment, and having the knowledge and confidence to use SPC successfully. It is clear that the majority of difficulties are caused by the lack of commitment, awareness, understanding, involvement and leadership of middle and senior managers. SPC, supported by the positive commitment of all employees in an organization within a framework of TQM and strategic process improvement, has proved to be a major contribution in the pursuit of excellence. It supports the philosophy that products and services can always be improved. However, it is a technique which, by itself, will do little to improve quality. It is basically a measurement technique and it is only when a mechanism is in place to remove ‘special’ causes of variation and to squeeze out of the process ‘common’ causes of variation that an organization will have progressed from simply charting data to using SPC to its fullest potential. Management commitment and leadership and a structured and ongoing training programme correctly used are crucial to the success of SPC. With thanks to R. Love and B. G. Dale (2007) From the late 1980s onwards there has been a growth of interest in the subject of benchmarking as part of the culture of continuous improvement. This has been triggered by the success of the improvement methods used by the Xerox Corporation and by the development of the self-assessment methods promoted by the MBNQA and EFQM models for business excellence. Benchmarking as it is known today originated in Rank Xerox. It is now well documented that when Rank Xerox started to evaluate its copying machines against the Japanese competition it was found that the Japanese companies were selling their machines for what it cost Rank Xerox to make them. It was assumed that the Japanese-produced machines were of poor quality, but this proved not to be the case. This exposure of the corporation's vulnerability highlighted the need for change. In simple terms, the aim of benchmarking is to identify practices that can be implemented and adopted to improve company performance. Benchmarking is an opportunity to learn from the experience of others. It helps to develop an improvement mindset amongst staff, facilitates an understanding of best practices and processes, helps to develop a better understanding of processes, challenges existing practices within the business, assists in setting goals based on fact and provides an educated viewpoint of what needs to be done rather than relying on whim and gut instinct. Most organizations carry out what can be termed informal benchmarking. This traditional form of benchmarking has been carried out for years, beginning with military leaders. It takes two main forms:
This is often not done in any planned way; it is interesting but limited in its value owing to a lack of structure and clear objectives. This approach is often branded ‘industrial tourism’. To make the most effective use of benchmarking and use it as a learning experience as part of a continuous process rather than a one-off exercise, a more formal approach is required. There are three main types of formal benchmarking:
There are a number of steps in a formal benchmarking process. They are now briefly described:
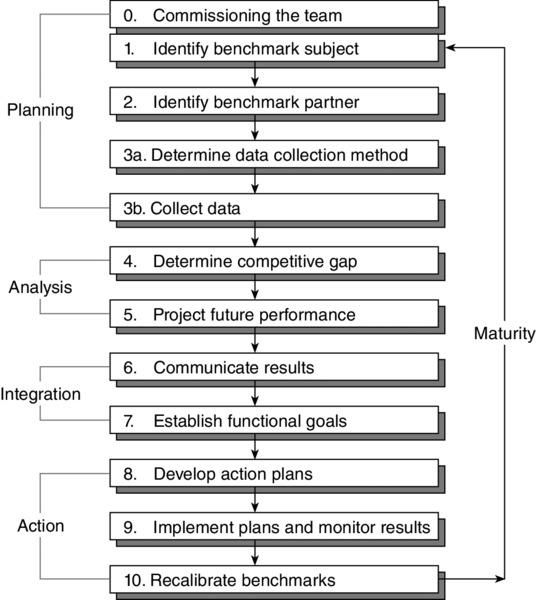
This section summarizes the main learning experiences as regards benchmarking from Dale et al. 2007. The ‘10-step’ benchmarking process, as shown in Figure 10.6, provides a good outline for benchmarking teams to follow. Figure 10.6 The United Utilities benchmarking process Source: Dale et al. 2007 The choice of benchmarking partners is critical in the success and failure of the project, so it is important that due care and attention are paid to the selection. When contacting potential benchmarking partners it is helpful to identify the specific areas of activity and the measurement of success which are to be discussed during the visit. It was found to be important to send out a pack of information to those organizations that, in principle, had agreed to participate in a benchmarking project. The following is typical of the information it needed to include:
The benchmarking teams rated and selected their partners on the basis of their critical success factors in terms of what needed to be achieved by the project as well as such aspects as comparable size, structure, geography (where deemed appropriate), reputation with respect to product and service quality and market position and segmentation using a criteria rating form to focus on the critical few. Consideration was also given to their understanding and experience with benchmarking. The key findings from each benchmarking visit were related to an action plan with respect to what was being/had been implemented. This helped to ensure that the best practices identified were captured and acted upon. In addition, it was found to be important that the analysis identified common threads from the benchmarking visits. Simple graphical displays were used to communicate to all concerned the comparison of the KPI of the process being benchmarked with that of the partners. This assisted with the acceptance of changes that needed to be made, as well as with regular communication of progress, which was built into the project plan after the completion of each phase so that everyone concerned was up to speed before being presented with the project findings. As benchmarking is about breakthrough improvement and the implementation of best practices, looking within the industry is insufficient as often the ‘best’ at particular practices are from diverse areas. This is a common problem for very specific benchmarking projects. It is important to contact the benchmarking partners early. It can be more difficult than expected with respect to the time involved and the issue of identifying the right partner(s). Desk research into the companies being considered as benchmarking partners should be undertaken before making a decision, although this does depend on time constraints and the type of project being tackled. It has been found useful to visit four to five organizations, and to make all the visits within a period of one month. However, as the company is looking for high gains in the long term from benchmarking it is worthwhile taking the time to ensure that the company being benchmarked is suitable for analysis. After each visit to a benchmarking partner it is important to detail and collate what has been learnt as quickly as possible while the experience is fresh in the team members' minds. It was also found helpful to summarize what the organization was doing better than the benchmark partner in a report format, identifying key points and providing quantitative as well as qualitative data. In order for a benchmarking project to be a success there are certain difficulties and pitfalls that must be avoided. Based on the projects undertaken the most common ones are:
Benchmarking is a technique for the continuous improvement of processes. It is therefore important to ensure that the process of benchmarking is thought of in a similar vein; the objective is the continual improvement of the benchmarking process used for each project by sharing each project's successes, pitfalls, and failures and thereby promoting continuous learning. There is also a need to ensure that benchmarking is incorporated into an organization's culture of continuous improvement. A benchmarking project is likely to generate other additional benchmarking projects within the process studied or with interfacing processes. A project, in addition to the savings generated, is also helpful in promoting understanding of KPIs and measures of quality; in other words, what do we need to have in place to understand what we do, how we do it, why we do it, and how well we do it? With thanks to J. Macdonald and B. G. Dale (2007) In recent times business process re-engineering (BPR) has emerged as the concept which enables an organization to take a radical and revolutionary look at the way in which it operates and the way work is done, and references to it abound in management and technical publications with such words as ‘radical’, ‘dramatic’, ‘rethinking’, ‘optimize’, and ‘redesign’. It has become popular in a short period of time, promising amazing results very quickly in relation to corporate and technological change, transformation and competitive pressures. The protagonists of BPR argue that it is a concept which enables an organization to make the necessary step changes, introducing originality and improvements to the business which will enable it to leapfrog the competition. While TQM is based, in general, on continuous improvement in processes over a relatively long period of time, BPR emphasizes structural process redesign, process re-engineering and fundamental rethinking of the business by ignoring the status quo, leading to claims of producing faster returns in a relatively short period of time through its one-step solution to a problem. They are both approaches to improve the performance of a business, but in the authors' view continuous improvement should come first and provide the base for the more radical change and improvements generated by BPR. It should also not be overlooked that TQM also drives breakthrough improvements. The underlying issues in BPR are not necessarily new, although the language and approach are modern. There is some confusion as to what constitutes BPR, what it covers, which initiatives it embraces, and its relationship with TQM. This is not helped by the variety of terms (e.g. business process improvement, business process redesign, business process re-engineering, core value-driven process re-engineering, process redesign, business restructuring, new industrial engineering, process simplification and value management) that authors use in their description of BPR, along with the lack of precision with which they use them. However, most of the terms refer to roughly the same type of activity, pointing out that gains in performance can be achieved by taking a holistic and objective view of business processes. The authors view TQM and BPR as complementary and integral approaches rather than ones that are in opposition to each other. In fact many of the tools and techniques which have been proved and used in continuous improvement are employed in BPR projects, and a number of the principles and practices of BPR are very similar to those which underpin TQM and strategic
process improvement. Our combined practical and research evidence points to the fact that those companies which have been successful in building continuous improvement principles into their business operation in an evolutionary manner have created the solid platform and environment in which to develop the concept of BPR. Those organizations starting with TQM will have a better understanding of processes, which is central to both TQM and BPR. Having learned how to change using the continuous improvement philosophy, they are more ready to deal with the increasingly radical designing of new processes that is demanded by BPR. In general, it has been service industries and public sector organizations that have taken up the theme of BPR rather than manufacturing industry. It would be argued by managers in the former that, without BPR having been undertaken as part of the natural management process of running a business, they would simply not have survived. In general, service industries and the public sector have only relatively recently felt the winds of change. The aim is to present, in simple terms, what BPR means, its main approaches and methods, techniques employed, and main principles and practices. The two main approaches employed in BPR are process redesign and process re-engineering, and these are examined below. The approaches are based on taking a holistic and objective view of the core processes that are needed to accomplish specific business objectives without being constrained by what already exists (i.e. ‘clean slate’). BPR covers a range of activities that result in radical change, to either individual processes or to the total organization. The main differences between the two approaches are that the latter involves greater structural change and risk while the former is quicker and less costly to implement but with potentially fewer benefits and improvements. Hammer and Champy (1993) point out that every re-engineering measure usually starts with process redesign. Process redesign can be carried out in many different ways depending on the degree to which the process is to be changed; it usually takes the existing process(es) as the base. It concentrates on those core processes with cross-functional boundaries and is generally customer-focused, with a view to process simplification, streamlining, mistake-proofing the process, efficiency and adaptability. It tends to seek answers to questions such as:
It also uses many of the techniques used in a TQM and strategic process improvement initiatives, such as the value stream mapping, and employs modern methods of information technology to best advantage, in particular for integrating process activities. Process re-engineering or new process design demands more imagination and inductive thinking and radical change than process redesign, with those charged with the implementation of a project encouraged to abandon their belief in the rules, procedures, practices, systems and values that have shaped the current organization. It raises and challenges assumptions such as make or buy decisions, structures, functional responsibilities and tasks, systems and documentation (e.g. supplier payment), elimination of specialist departments, etc. Hammer and Champy (1993) define re-engineering as:
A fundamental rethink and radical redesign of business processes to achieve dramatic improvements in critical contemporary measures of performance, such as cost, quality, service and speed. The approach is based on the view that continuous improvement is not sufficient to meet the organizational expectations for business development and change. Business process re-engineering seeks to make major fundamental, radical and dramatic breakthroughs in performance and is holistic in nature. The main focus is to ensure a ‘clean slate’ or ‘greenfield’ approach to processes, pinpointing that part of the organization on which to put the emphasis and highlighting the processes which add value. It is, however, not without risks and the demands on resources, time and costs which are associated with the efforts involved in a re-engineering project. The concept is based on making best use of information technology (IT) in terms of communication and information-handling systems. It harnesses the enablers of technology and the release of the innovative potential of people to achieve breakthrough improvements, requiring a change from functional thinking to process thinking. The fundamental principles of BPR represent good management practice. Despite the difference in emphasis and terminology used by various authors the principles and values remain relatively common. From publications such as Coulson-Thomas (1994), Hammer and Champy (1993), Macdonald (1995a, 1995b), and Tinnila (1995) the main principles of BPR can be summarized as follows:
Within a BPR initiative, it is critical to thoroughly understand and visualize the selected process in the first instance, and then to collect its associated performance data, in terms of cycle time, speed, quality and cost (Venkataraman et al. 2014). Hence value stream mapping (VSM) is a cornerstone technique within BPR. VSM builds on process maps and flowcharts to provide fact-based process description for understanding the current problems and thinking about the future states. It is powerful to allow the team to communicate and assess how the process should work and perform once the waste and non-added-value activities have been removed. It is an excellent vehicle for involvement and participation (Bicheno and Holweg 2009). George et al. (2005) explained that VSM is an elaborated process map encompassing data on WIP, set up time, processing time, error rates, idle time, etc., as well as the information regarding the flows. It is a fundamental technique as part of a Lean, Six Sigma, TQM or BRP approach (Gurumurthy and Kodaly 2011; Abdulmalek and Rajgopal 2006; and Winkel et al. 2015). It is relevant for the team to decide on the appropriate level and on the boundaries of the VSM. A high-level perspective is often recommended at the start in order to depict the major elements and their interactions. Bicheno and Holweg (2009) promote that VSM should consider and analyse the big picture (production, human resources, marketing, finance, engineering, etc.), which will allow to determine a strategic indication of the opportunities. However, a low-level view depicting the specific value-added and non-value-added activities will be essential to generate the breakthrough improvement aimed at. In this logic, it is appropriate to consider the current process first and then the ideal and future state. This should encourage the team to think outside of the constraints and think innovatively by stretching their imagination. George et al. (2005) provide a 7-step method to create a VSM:
Similarly Bicheno and Holweg (2009) suggested the following cycle to implement a VSM:
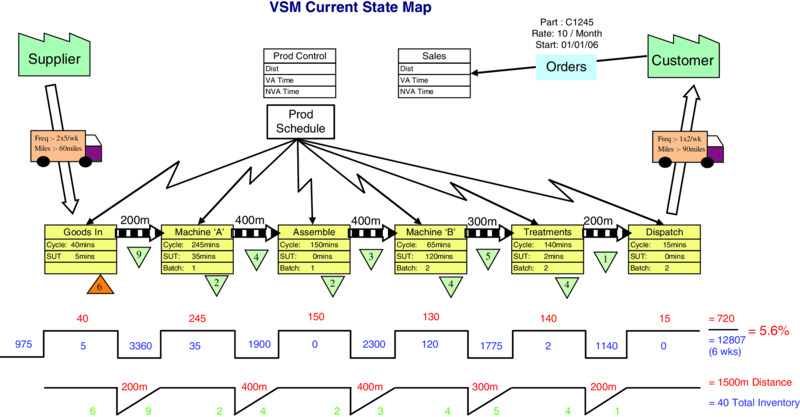
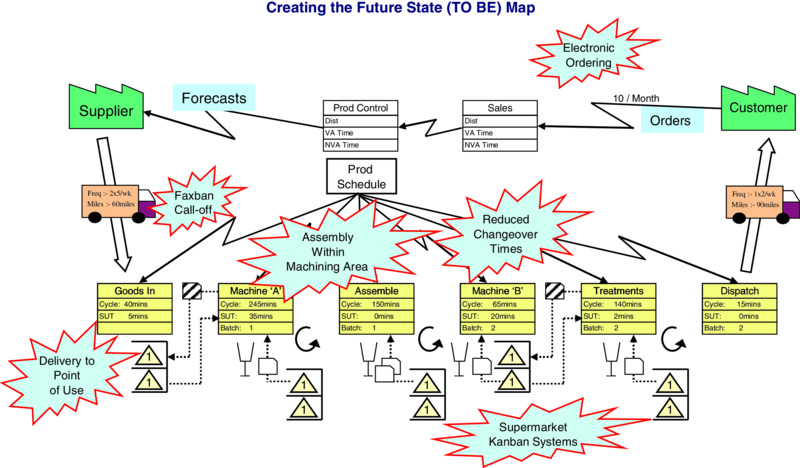
The core application of VSM involves creating a ‘Current State’ map (see Figure 10.7) then identifying the necessary improvements. Figure 10.7 VSM current state map These are agreed and defined; then communicated using a ‘Future State’ map (See Figure 10.8). Figure 10.8 VSM future state map The authors are of the view that BPR is complementary to TQM, rather than being an alternative or in opposition to it. For example, TQM can help to ‘hold the gains’ achieved through BPR and can create an environment that will help to ensure the success of BPR projects. BPR is based, in general, on radical and breakthrough change over a relatively short period and TQM is based, in general, on incremental improvement over the longer term and on working within existing framework systems and procedures by improving them. In the authors' view, aiming for large step changes makes a project riskier and more complex, and also involves greater expense. Incremental change is safer and costs less. The simplicity of incremental improvement often overshadows the fact that in practice it requires effort and constant application to implement in an effective and efficient manner. TQM and BPR do share common themes, such as a focus on customers, key processes, eliminating waste, and benchmarking. BPR tends to concentrate on one process at a time using a value stream mapping, whereas TQM takes a more holistic view of the organization culture, building improvement into all its areas of operation. TQM acts as the foundation for an organization's day-to-day functioning and continual improvement that allows and supports the development of BPR as an effective business improvement technique. To get the best out of both concepts they should be combined and integrated to produce a comprehensive approach to business improvement. TQM can sometimes stall and plateau, and other initiatives, within the overall framework of the approach, can often provide the spark to revitalize it. BPR could provide this type of excitement, but to do so it needs to be positioned within the broader TQM approach. BPR requires dedication, acceptance of risk and considerable upheaval. It is important that an organization is clear on this because it is so easy to find it in conflict with the potential cost savings. Not every organization is capable of accomplishing the level of change required, but any organization that has the ambition to be the best cannot ignore BPR but must accept the challenge. Some industries which operate in dynamic environments are more suited to taking on the risks associated with BPR than others, where the disturbance of processes could have severe consequences. It is also important for organizations to be clear on whether they need business process redesign or the more radical process re-engineering. Both are important to stimulate process innovation so that organizations can become more agile in responding to unpredictable changes and respond quickly to the needs and demands of customers. Managers are central to the success of re-engineering projects and they must be prepared to change their role and power structures and provide the necessary leadership. With thanks to A. van der Wiele, J. D. van Iwaarden, B. G. Dale and A. R. T. Williams (2007) In this last section of this substantive chapter, Six Sigma is going to be presented, discussed and reviewed. The authors consider Six Sigma as a data-driven integrated process improvement and problem-solving approach, which encompasses and is built on all of the techniques described previously in this chapter: QFD, DoE, FMEA, SPC, Benchmarking and BPR and VSM, and many more. Motorola created the concept of Six Sigma in the mid-1980s to improve the performance, productivity and quality of their key processes. The main factor behind its development was continuous improvement in the manufacture of complex devices involving a large number of parts with a high probability of defects in the end product. At the same time, customers were demanding that Motorola improve quality in their final product offerings. This external driver supported the need for continuous improvement. The goal of Six Sigma is value creation through quality improvement. The process by which this is attained would involve training of employees in tools and techniques as well as a problem-solving protocol. Six Sigma makes use of quality engineering methods within a defined problem-solving structure to identify and eliminate process defects and solve problems, and in this way improve yield, productivity, operating effectiveness and customer satisfaction (Bhote and Bhote 1991; Harry and Schroeder 1999; McFadden 1993; Pande et al. 2000; Pyzdek 2003; Gijo et al. 2014; Jesus et al. 2015). It is based on the well-established quality management ideas of understanding and eliminating the causes of variation and robust designing for manufacture and assembly. Therefore, its roots are in Statistical Process Control (SPC). The well-publicized bottom-line benefits achieved by Motorola (De Feo 2000) led to its adoption by high-profile organizations such as AlliedSignal (now Honeywell) and General Electric. Interest is currently very high and a wide range of organizations are following the adoption of Six Sigma. The concept is variously described in books and papers (Breyfogle 1999; Harry and Schroeder 1999; Snee and Hoerl 2003; Linderman et al. 2003; De Mast and Lokkerbol 2012; Shafer and Moeller 2012), and its protagonists claim it is a complete management system. Many of the objectives of Six Sigma are similar to those of Total Quality Management (e.g. customer orientation and focus, team-based activity, comprehensive education and training, and problem-solving methodology) and it undoubtedly builds on TQM. There is no doubt that Six Sigma brings engineering and statistical analysis back into quality and is returning quality back to its roots. Many of the success stories in the literature are from American organizations. AlliedSignal and General Electric have both used the financial benefits achieved through Six Sigma to persuade financial analysts that their firms' stock prices should be higher. This is perhaps the first time that executives have been able to argue that their quality initiatives will result in financial benefits that should be taken into account in the valuation of their companies. It seems that Six Sigma is interpreted by different organizations in different ways. Some organizations interpret it simply as a measurement and improvement device, while others use it as a label for their organization-wide quality approach (Breyfogle 1999; Dusharme 2001; Harry and Schroeder 1999; Snee and Hoerl 2003; Jacobs et al. 2015). A sigma is a statistical indication of variation in terms of the standard deviation of the characteristic under consideration. It indicates the spread of each unit around the target value, and therefore it is essentially an indication of how good a product or service is. Traditionally, designers used the three-sigma rule to evaluate whether or not a part would meet specification. When a part's specifications are consistent with a spread of six standard deviations of process variation (three sigma to either side of the target value), around 99.73 per cent of the parts for a process which is centred would be expected to conform to specification. The higher the sigma value, the lower the number of defects associated with the process, the lower the costs of rework and scrap and the lower the cycle time of the process. In essence, sigma measures the capability of a process to produce defect-free work and is a means of calibrating process performance to meet the requirements of customers. For example, a process that is at a quality level of three sigma means 66,807 defects per million opportunities (DPMO), while Six Sigma is 3.4 DPMO. Other sigma levels and their corresponding number of defects are presented in Table 10.1. Table 10.1 Six Sigma and defects per million opportunities The question of how organizations perceive Six Sigma and what they are doing under the umbrella of a Six Sigma approach has been the focus of research undertaken by van Iwaarden et al. (2008). They conducted a survey project amongst British, American and Dutch companies that use Six Sigma. Their results indicate that the Six Sigma approach is universal in the three countries surveyed, and that Six Sigma improves efficiency and profitability. The latter issue is the major driving force for organizations to start a Six Sigma implementation process. Looking into the tools and techniques that are found to be important within the context of a Six Sigma approach, it is clear that the basic (statistical) quality tools and techniques are seen as the cornerstone of Six Sigma. However, many of these tools and techniques were found to already be in place before the companies started implementing Six Sigma, indicating that Six Sigma is usually based on existing knowledge and practices. Six Sigma, like any major organizational change programme, is not easy. Its success will depend on at least four major factors. Firstly, it involves high levels of commitment and involvement of management. It is based on an understanding of statistics and this is not a popular area for most managers. It also requires that high-performing managers are released to be trained and, after training, that they commit a significant amount of their time to the Six Sigma concept. So it needs to be led by senior management. Secondly, it cannot be treated as yet another stand-alone activity. Like TQM, it requires adherence to a whole philosophy rather than usage of a few tools and techniques, however sophisticated. A Six Sigma-style initiative demands a degree of sophistication from the organization adopting it and the organization must be ripe for the change. For example, the organization must be used to working with cross-functional teams and should have its major processes identified and under some degree of control. In short, it must have many of the fundamentals of TQM already in place. Thirdly, Six Sigma is about reducing defects. Improvement depends on how opportunities for defects or failure are defined and measured (i.e. the possible defects). What matters in a Six Sigma approach, as in any other quality approach, is what the customer wants or needs; this is why QFD (see above) is also a technique strongly associated with Six Sigma. The most critical effects or failures are those that most concern the customer. Fourthly, Six Sigma needs to be concentrated on those elements of a business which will result in customers perceiving that they would rather deal with them than with one of its competitors. Therefore Six Sigma, like any performance improvement drive, should start from strategy – where does a company want to be? What will really make a difference to getting there? And, therefore, where must it concentrate its improvement drives? For many organizations the key factors influencing whether they will achieve their desired strategy are: How many customers will stay loyal? What really governs a customer's actual purchasing behaviour (as opposed to what he or she says governs it)? Will enough customers continue to be willing to pay a slight premium for their products? Can the organization increase its market share? In the aforementioned international survey project on Six Sigma by van Iwaarden et al. (2008), respondents were asked what was the required level of quality experience at the start of the Six Sigma implementation, and what factors influenced the sustainability of a Six Sigma approach. From the survey it was concluded that a successful Six Sigma implementation had to build on experience of earlier quality management programmes. Having developed quality awareness and a quality culture, and having reached a certain level of quality management maturity, are essential prerequisites for the success of Six Sigma. For the sustainability of a Six Sigma approach, a wide range of items were found to be important, indicating that it is difficult, as with any management approach, to follow a specific approach over a long period of time. There will always be potential obstacles: the benefits of projects may diminish over time, management's focus may shift to other priorities, and important players in the organization may lose interest. Six Sigma builds on a range of improvement methods that have proven to be effective. This can be seen in its central themes, which can be considered to be the following:
Six Sigma improvement projects adhere to strict problem-solving approaches. Depending on the organizational processes to which they are applied (i.e. existing processes or new processes), improvement projects use either the DMAIC or DMADV approach. In the practice of consultancy firms, new acronyms are occasionally developed; however, they do not differ markedly from DMAIC and DMADV. A number of writers (e.g. Eckes 2000; Pande et al. 2000) outline how the implementation of Six Sigma involves three aspects of process development:
This primarily concerns the elimination of the root causes of process problems and is clearly associated with continuous improvement activities (i.e. improve what you already have). Most Six Sigma activities are initially based on process improvement. It involves the identification of the vital few (Xs) that influence results (Ys). The DMAIC structured problem-solving approach, which is employed in making improvements to existing processes and products, is related to other problem-solving approaches, including Deming's PDCA cycle. The DMAIC approach takes the following steps:
This is normally the second stage after process improvement. The emphasis is on new processes rather than fixes to existing ones and in this there are similarities to Business Process Re-engineering (see Chapter 10). The method used is the DMADV approach, also called design for Six Sigma (DFSS). The steps are different from those of the DMAIC method, and can be described as:
This third phase reflects a change of emphasis from oversight and direction of functions to understanding and process facilitation. The key activities include: processes are managed end to end; customer requirements are clearly identified; meaningful measures of input, process activities, and output are developed. A Six Sigma approach can be considered to have the following five stages:
Six Sigma is a well-structured improvement approach with verifiable financial results. However, organizations' quality initiatives should not be driven solely by the savings needed to impress the financial analysts. This can be a dangerous approach because its focus is too short-term. Most organizations need a longer-term focus on customers, and not solely on suppliers of capital. A successful Six Sigma implementation should build upon a number of prerequisites such as an existing quality culture and a certain level of quality maturity. The sustainability of Six Sigma in the long term depends on many factors, such as top management commitment, being able to show successful projects, high investment in training, high investment in management time, and the involvement of key players in the organization. Six Sigma can revolutionize an organization and it will go deep into its fabric; it therefore needs top management drive behind it. It must be seen as part of a total approach, and it demands a level of quality competence from the organization before the benefits can begin to be delivered. Quality improvement methods such as Six Sigma may be very powerful but they have to be directed and need a clear strategy to measure and interpret customers' needs successfully. Managers must also realize that, if their organization has no clear power structure and the desired level of competence is not present, then a Six Sigma programme is unlikely to work.Introduction
Quality Function Deployment
Understanding Customer Needs
The QFD Road
The project
Customer needs
Customer priorities and competitive comparisons and planned improvements
Design features or requirements
The central relationship matrix: the whats vs. the hows
Relative weights of importance
Design feature interactions: the hows vs. the hows
Target values
Technical comparisons
Service information and special requirements
Implementation of QFD
Summary of QFD
Design of Experiments
Taguchi: An Overview of his Approach
Steps in Experimental Design
Summary of DoE
Failure Mode and Effects Analysis
What is Failure Mode and Effects Analysis?
Development of a Design FMEA
Development of a Process FMEA
Analysis of Failure Data
Recommended Actions for Design and Process FMEA
Summary of FMEA
Statistical Process Control
Introduction
What is Statistical Process Control?
The Development of Statistical Process Control
Variation and Process Improvement
What are special and common causes of variation?
Process Capability
![]()

![]()
![]()
![]()
![]()
![]()
![]()
Difficulties Experienced in Introducing and Applying SPC
Summary of SPC
Benchmarking
Introduction
Success Factors
Difficulties and Pitfalls
Summary of Benchmarking
Business Process Re-engineering and Value Stream Mapping
Introduction
Approaches Used in BPR
Business process redesign
Business process re-engineering
The Principles of BPR
Value Stream Mapping
Summary of BPR and VSM
Six Sigma
Introduction
What Does Six Sigma Mean?
Sigma
Defects per million opportunities (DPMO)
2
308,537
3
66,807
4
6,210
5
233
6
3.4
Six Sigma Prerequisites
Six Sigma Core Elements
Structured Problem-Solving Approaches
Process improvement
Process design/redesign
Process management
Summary of Six Sigma
References