CHAPTER THREE
Developing a Performance Framework: Program Logic Models and Performance Measures
What are the aspects of program or organizational performance that would be important to monitor on a regular basis in a performance management system? What does the effectiveness of a particular public program or the quality of the services it provides entail? What does efficiency mean with respect to a given program, or the productivity of employees working in a service delivery system?
In order for a measurement system to be useful, it must focus on the most appropriate aspects of performance. To ensure that a measurement system is results oriented as opposed to being data driven, it should be guided by a clear performance framework, a structure that identifies the parameters of program or organizational performance and may outline the presumed relationships among them. This chapter addresses the what of performance measurement: What are the important dimensions of program performance to address, and what are the principal kinds of performance measures to track them? More specifically, the chapter discusses one principal type of performance framework, program logic models. These logic models focus primarily on program performance, reflect a results-oriented perspective, and are appropriate for programs delivered by both public and nonprofit organizations. Chapter 4 then discusses goal structures as performance frameworks, a very different yet complementary, and by no means incompatible, type of approach.
Program Logic
Developing useful measures of program performance requires a clear understanding of what a program does and the results it is intended to accomplish (Poister, 1978; Wholey, 1979; Broom, Harris, Jackson, & Marshall, 1998; Sowa, Selden, & Sandfort, 2004; McDavid & Hawthorn, 2006). Program logic models are schematic diagrams that represent the logic underlying a program's design, indicating how various components are expected to interact, the goods or services they produce, and how they generate the desired results—the logic by which program activities are expected to lead to targeted outcomes (Poister, 1978; Poister, McDavid & Magoun, 1979; Hatry, Van Houten, Plantz, & Greenway, 1996; Funnell & Rogers, 2011; Knowlton & Phillips, 2012). Clarifying desired outcomes and the underlying logic by which they are expected to be achieved is essential for effective performance management, and a good logic model can provide the scaffolding for building a performance measurement system (Frechtling, 2007). Once a logic model has been developed and adopted, the relevant performance measures can be identified systematically and confidently.
Program Logic Models
Public programs should be planned and managed with an eye toward specifying and achieving desirable results. They should be viewed as interventions involving service delivery or enforcement activity designed to address some problem, meet some need, or have a favorable impact on some unsatisfactory condition in a way that has been defined as serving the public interest. The positive impacts so generated constitute the program's intended results, which would justify support for the program in the first place. A program's intended results, or its outcomes, occur “out there” in the community, within a targeted area or target population, or across the nation or state or local jurisdiction generally, not inside the program itself or the agency or organizational unit that operates it. Obviously the intended results should be clearly understood and monitored on a regular basis. If a programmatic entity cannot articulate worthwhile results and provide evidence that programmatic activity is indeed producing them, continued support should be questioned at the very least.
Thus, any sound program design must be based on a set of assumptions regarding the services it provides, the clients it serves or the cases it treats, its intended results, and the logic of how the use of resources in particular programmatic activities is expected to produce these results. This set of assumptions constitutes a theory of action or intervention logic that embodies a theory of change regarding the way programmatic processes bring about desired changes in individuals, groups, or communities that can be represented schematically by a logic model (Funnell & Rogers, 2011). Figure 3.1 shows a generic program logic model that can help clarify these assumptions for any public program. Such a model can be used as an organizing tool for identifying the critical variables in program design, the role each plays in the underlying logic, and the presumed relationships among them.
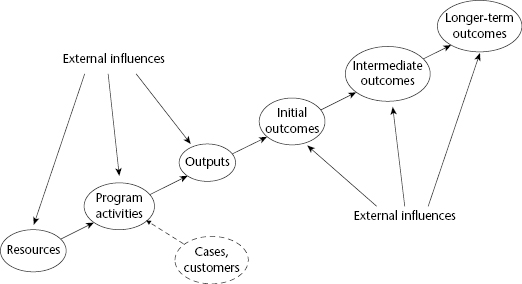
Resources are used to carry on program activities and provide services that produce immediate products, or outputs. These outputs are intended to lead to outcomes, which are the substantive changes, improvements, or benefits that are supposed to result from the program. Frequently these outcomes themselves occur in sequence, running from initial outcomes to intermediate and longer-term outcomes. Usually the logic underlying a program design is also predicated on a flow of customers who are served by a program or a set of cases the program deals with. In addition, it is important to recognize the external factors in a program's environment or operating context, which may influence its performance.
The sets of activities that make up the work of most public programs involve the provision of services or the enforcement of laws or regulations (or both). For example, the principal activities in a neighborhood health clinic might include conducting physical examinations and well-baby checks, giving inoculations, and prescribing treatments and medications for illnesses and chronic conditions; in the criminal investigations unit of a local police department, the principal activities would include examining crime scenes, interviewing witnesses, examining physical evidence, checking out leads, and gathering additional information. These programmatic activities and the outputs they produce need to be identified clearly, whether they are carried on by public sector employees working in the program or by private firms or nonprofit organizations that are contracted to carry out service delivery.
The principal resources that most public and nonprofit programs use are personnel, physical facilities, equipment, materials, and contract services. Personnel may include volunteers as well as employees, and sometimes it is helpful to break them down into occupational categories, tracking, for example, the numbers of uniformed patrol officers, detectives, crime lab personnel, and support staff in order to gauge labor productivity in a local police department.
In many public programs, especially those carried on by production-type agencies, the work performed and the results obtained apply to cases or groups of cases that come into the program or are treated by the program in some fashion. Frequently the cases are the program's primary customers (or consumers or clients). This is almost always true for human service and educational programs—patients treated in public hospitals, children served by a foster care program, clients aided in a counseling program, or students enrolled in a community college, for example—but customers are also often the principal cases in other types of programs, for instance, disabled persons using demand-responsive transportation services or the number of families living in dwelling units provided by a public housing authority.
However, with some programs, the most likely definition of cases may be something other than customers. For example, while the customers of a state highway maintenance program are individual motorists, it makes more sense to think of the cases to be processed as consisting of road miles or road segments to be maintained. Similarly, the implicit customer of the Keep Nebraska Beautiful program is the public at large, but the “cases” treated by this program consist of small, targeted geographical areas. While the cases processed by a state's driver's license permitting program are individual applicants, the customers, the cases processed by a state's vehicle registration program, are probably best defined as the vehicles rather than the customers who are registering them. Often a public or nonprofit program may define its cases in more than one way. For example, the US Internal Revenue Service may consider the individual customer as the case with respect to its tax preparation assistance function but focus on the tax return as the case in terms of its collections and auditing functions.
It is important to identify external influences in thinking about a program's logic because they may be critical in either facilitating or impeding success. Many of these external influences concern client characteristics or the magnitude or severity of need for the program, but they are by no means limited to that. Any factor or condition—physical, social, economic, financial, psychological, or cultural—that is likely to influence program performance and is largely beyond the control of the program or agency may be relevant to track as an external influence. For example, winter weather conditions may explain differences in the performance of a highway maintenance program from year to year, while differences in labor market conditions may explain differences in the effectiveness of similar job training programs in different localities, and variation in local industrial base, land use patterns, and commuting behavior are likely to influence the federal Environmental Protection Agency's success in enforcing clean air standards in different parts of the country. Such external factors are important to take into account in clarifying a program's underlying logic because they can be extremely helpful in interpreting the meaning of performance data.
Outputs versus Outcomes
The most important distinction to be made in identifying program logic is that between outputs and outcomes. Outputs represent what a program actually does and what it produces directly; outcomes are the results it generates. Operations managers appropriately focus on the production of high-quality outputs in an efficient manner, but managers who are concerned with overall performance must look beyond outputs to outcomes because they represent program effectiveness. In terms of program logic, outputs have little inherent value because they do not constitute direct benefits, but they are essential because they lead directly to these benefits or trigger the causal sequences of changes that lead to the desired results.
Outputs are best thought of as necessary but insufficient conditions for success. They are the immediate products or services produced by a program, and without an appropriate mix and quality of outputs, a program will not be able to generate its intended results. However, if the underlying program logic is flawed—if the assumptions of causal connections between outputs and results do not hold up in reality—the desired outcomes will not materialize, at least not as a result of the program. Usually the production of outputs is largely, although not exclusively, under the control of program managers, but outcomes tend to be influenced more strongly by a wider array of external factors beyond the program's control. Thus, the production of outputs is no guarantee that outcomes will result, and it is important therefore to measure outcomes directly in order to monitor program performance. Table 3.1 shows typical outputs and outcomes for a few selected public services.
Table 3.1 Illustrations of Outcomes versus Outputs
| Program or Activity | Outputs | Outcomes |
|---|---|---|
| Crime control | Hours of patrol conducted Response to calls for service Crimes investigated Arrest made Crime solved | Reduction in crimes committed Reduction in injuries and fatalities due to crimes Reduction in property damage or loss due to crime |
| Highway maintenance | Project designs completed Highway miles constructed Highway miles reconstructed | Improved traffic flow Reduced travel times |
| AIDS prevention and treatment | Seminars conducted Brochures mailed AIDS antibody tests given Hot-line calls responded to Group counseling sessions conducted AIDS patients treated Number of referrals given to clients | Increased awareness and knowledge regarding AIDS Decrease in risky behavior Decrease in incidence and prevalence of AIDS Reduction in AIDS-related fatalities Reduction in number of babies testing positively for HIV |
| Juvenile justice boot camps | Physical training units completed Educational units completed Vocational training units completed Youths discharged After-care activity hours conducted | Fewer legislation passed Policy changes implemented New programs authorized Changes in program strategy or design implemented Alternative service delivery arrangements implemented |
| Policy research, planning, and evaluation | Policy analyses completed “White papers” distributed Policy briefings conducted Program designed and revised Needs assessment completed New program plans developed Client surveys conducted Program evaluations completed | Proposed legislation passed Policy changes implemented New programs authorized Changes in programs strategy or design implemented Alternative service delivery arrangements implemented |
Outputs often represent the amount of work performed or the volume of activity completed, such as hours patrolled by the police, miles of highway constructed, AIDS education seminars conducted or antibody tests given, or the number of vocational training classes conducted in a juvenile justice boot camp. Sometimes outputs are measured in terms of the number of clients or cases treated, for example, the number of crimes investigated or calls for service responded to by the police, the number of AIDS patients given treatment or counseling, or the number of youths discharged from juvenile boot camps.
Outcomes are the substantive results generated by producing these outputs. Criminal investigations and arrests do not really count for much—for instance, if the police are not able to solve the crimes they are working on, and reconstructed highway segments do not serve any particular public interest or create value if they do not result in improved flow of traffic and reduced travel times for the motorists using them. Similarly, AIDS-awareness seminars are not particularly worthwhile if they do not lead to decreases in the kinds of risky behavior—unprotected sex and use of dirty drug needles, for example—that spread the HIV virus. And training units and hours spent in after-care activity are not effective in attaining their rehabilitative purposes if the youths discharged from boot camps are not productively engaged in school or work and refraining from further criminal activity. Outcomes are the ultimate criteria for gauging program effectiveness, but as direct products of program activity, outputs are critical for achieving intended outcomes.
Given this careful distinction, however, it must be noted that the connections between outputs and outcomes are often more fluid than a simple dichotomy. It could be argued, for example, that arrests made by the police as the result of criminal investigations are really outcomes rather than outputs, although certainly not the ultimate outcome of their work. Similarly, it might make sense to think of services provided as outputs but to consider services consumed as outcomes. For example, the number of training programs offered might be considered as a program's principal output, while the number of participants completing these programs could be thought of as an outcome. The number of participants trained, however, is probably a better reflection of the amount of activity completed, or an output. Rather than a very strict, dichotomous distinction between outputs and outcomes, what is important is an identification of the real results targeted by a program and the sequence of accomplishments that must occur in order to achieve them. This might be thought of as a results chain—a sequence from outputs to impacts, or the logic of program activities, outputs, initial outcomes, intermediate outcomes, and longer-term outcomes, the format used in this book.
The distinction between outputs and outcomes may also vary depending on the perspective from which they are viewed. For a staff support function such as policy research, planning, and evaluation in a federal agency, for example, typical outputs might be policy analyses completed, program designs revised, needs assessments completed, and program evaluations conducted. In some cases, producing these outputs might be intended to lead to such outcomes as additional legislation passed or new programs authorized by the Congress. Whereas the implementation of policy changes, revised program strategies, or service delivery arrangements by the agency in response to recommendations from the policy research would constitute outputs for the agency as a whole, these same measures would constitute outcomes for the office of policy research, planning, and evaluation itself.
Diverse Logic Models
Outputs, outcomes, and other elements can be identified in logic models that may be as general or detailed, or as simple or complex, as needed. Although it is always a mistake to bend reality to fit a preconceived model, the kind of program logic models presented here are quite flexible and can be adjusted to represent any public or nonprofit program. For example, the set of program components to be included can range from only one to numerous activities, and the connections between outputs and desired outcomes may be very direct, or they can occur through numerous initial and intermediate results. Similarly, the strands of logic that connect outputs to various outcomes can converge at different points and in different sequences along the way.
Although these models show the logic generally moving from left to right, they are not necessarily designed to represent the chronological order in which treatments are provided. These are logic models, not flowcharts that show the sequence in which individual cases move through a system.
A Crisis Stabilization Unit
Figure 3.2 shows a logic model for a two-county crisis stabilization unit in suburban Atlanta, Georgia. The mission of this program is to provide effective and safe stabilization to persons experiencing symptoms of decompensation due to psychiatric illnesses or substance abuse or dependence. The consumers treated by the program have subacute psychiatric diagnoses or a history of continuous substance abuse such that abrupt stoppage would cause physiological withdrawal. The principal resources of the unit are the facilities and supplies, along with medical, professional, and support staff. The services they provide include medical assessment and treatment, psychiatric assessment, medication management, crisis intervention, case management, and individual and group therapy.

The crisis stabilization unit produces a variety of outputs that reflect the work performed in providing services, such as medical assessments and nursing assessments conducted, physical examinations conducted, medical detoxifications completed, psychiatric assessments, education program modules, therapy sessions, Alcoholics Anonymous (AA) meetings, and referrals or placements. The initial outcomes produced by these service outputs are substance abuse consumers who have been stabilized through detoxification without physiological withdrawal symptoms and the number of psychiatric consumers who have been stabilized with medication. A complementary initial outcome is consumers who have been empowered through counseling, educational programs, and support groups to make more responsible decisions regarding their own behavior. For the substance abusers, the intermediate outcomes are that they enter appropriate long-term or day-patient treatment programs and continue to abstain from drugs and alcohol over the long run. For the psychiatric consumers, the intermediate outcomes are that after being discharged from the unit, they return to baseline or desired behavior levels and continue to take their appropriate medications. For both clientele groups, the intended longer-term outcomes are that they resume normal patterns of work, family, and community life and that all of this results in reduced needs for acute care for them.
A Vocational Rehabilitation Program
Figure 3.3 represents the logic underlying a vocational rehabilitation program provided by a state human services department. The clients of this program are individuals with disabilities due to birth defects, injuries, or progressive long-term illnesses that present special challenges in finding work and holding a job. The mission of the program is to help these clients prepare for resuming their occupations or learning new ones, securing suitable jobs, and remaining employed. To pursue this mission, the vocational rehabilitation agency provides a number of interdependent services, including counseling and guidance, occupational and related training, the provision of specialized equipment, employer development and job development, placement assistance, and on-the-job evaluations of clients' ability to do the required work.

The initial outcome of all this activity is that clients have developed the knowledge and skills needed to engage in occupations that are viable for them and that they apply for suitable jobs in the competitive marketplace or, in some cases, sheltered workshops. The intermediate outcome is that the clients are placed in suitable jobs. Once clients have secured suitable jobs, the program may provide on-the-job evaluations with recommendations to assist them in adjusting to new jobs. This is all aimed at helping clients to continue working in suitable jobs and being successfully employed over the long run. To the extent this longer-term outcome is achieved, the program's mission is being met effectively.
State Highway Safety Program: A Supraprogram Logic Model
Individual public programs often cluster into larger sets of related programs in which their results chains interact in pursuit of broader goals even though they are delivered separately by different agencies or organizational units. For example, figure 3.4 shows a logic model for a state government's highway safety program consisting of four major components: driver licensing, highway patrol, safety promotion, and traffic engineering. In some states, all four of these functions are the responsibility of a single agency, but that is often not the case. In Georgia, for instance, driver licensing is the responsibility of the Department of Driver Services, highway patrol is performed by the Georgia State Patrol, safety promotion efforts are led by the Governor's Office of Highway Safety, and traffic engineering is within the purview of the Georgia Department of Transportation.

However, since these four functions are collectively concerned with reducing highway crashes, injuries, and fatalities resulting from crashes and the cost and suffering that derives from them, a central executive agency such as a state's office of planning and budget might well benefit from monitoring their performance on a coordinated basis. While each of these agencies delivers its own outputs, which are expected to generate particular kinds of initial outcomes, the driver licensing, highway patrol, and safety promotion programs are all aimed at ensuring safe driving behavior as an intermediate outcome, and the safety promotion program is also expected to lead directly to fewer highway-related injuries and fatalities, while the traffic engineering program is intended to lead directly to the longer-term outcome of fewer highway crashes. The combined logic also holds that the first three programs will contribute indirectly to fewer crashes, and all four programs should lead to the longer-term outcome of reduced costs and suffering resulting from highway crashes. Tracking the performance of these four programs in concert as they form a larger system provides a more comprehensive picture of the effectiveness of a state's overall highway safety program.
The Sexually Transmitted Disease Prevention System
Traditionally sexually transmitted disease (STD) prevention programs in the United States operated through direct service delivery—screening, diagnosis, treatment, and partner services—provided by local STD clinics supported in part with funding from the US Centers for Disease Control (CDC) primarily through state health departments. A decade or so ago, however, as a result of environmental and program assessments, CDC staff became convinced that this approach was no longer adequate, due largely to increasingly fragmented health care delivery systems, the lack of coordination among related health programs at the local level, and the fact that the clinics did not have a strong track record in reaching some of the most critical target populations. Thus, they concluded that STD prevention programs needed to implement a broader range of strategies to leverage impact on a variety of other stakeholders, such as managed care organizations, private medical practices, schools, detention and corrections facilities, and community-based organizations in order to reach out to at-risk persons and effectively contain the spread of syphilis, gonorrhea, and chlamydia.
Figure 3.5 shows the logic model that was developed as the performance framework for the STD prevention system envisioned under this new paradigm. It is important to understand that this was an early attempt to model the comprehensive national STD prevention system rather than the CDC's STD prevention program itself. This model represents the logic by which a variety of system components bring about intermediate outcomes involving safer-sex behaviors, increased use of condoms, and decreased duration of STD infections, which are expected to lead to decreased exposure, incidence, and prevalence of the targeted STDs.

Note: NGO stands for nongovernmental organizations and CBO stands for community-based organizations.
While these longer-term outcomes continued to be monitored in terms of incidence and prevalence rates, however, interest began to focus more on the earlier-stage outputs and immediate outcomes so that the CDC could begin to monitor the extent to which state and local STD prevention programs were having impacts on the larger system in productive ways. This would require local grantees to report STD prevention- and control-related activities on the part of schools, health networks, and even jails in addition to their own activities and outputs.
Performance Measures
The purpose of developing a logic model is to clarify what goes into a program, identify its customers, pinpoint the services it provides, identify the immediate products or outputs it produces, and specify the outcomes it is supposed to generate. Once this logic has been articulated, in a narrative or in a schematic, or both, the most relevant measures of program performance can be identified on a systematic basis. Although they are often combined into different categories, for the most part the relevant types of performance measures are measures of outputs, efficiency and productivity, service quality, outcomes, cost-effectiveness, and customer satisfaction. One additional type of performance measure, system productivity indicators, can also be included in many measurement systems.
Depending on the purpose of a given performance measurement system and the level of detail on which the monitoring may focus, various of these types of performance measures will be of paramount importance, but it usually makes sense to consider all of them in designing a performance measurement system. For any given program, all of these types of performance measures can generally be derived directly from the logic model. In addition, other types of measures, in particular resources and workload measures, are often monitored on a regular basis in performance measurement systems, even though they are not usually considered to be performance measures in their own right. Beyond performance measures, external variables representing environmental or contextual factors, including needs indicators that are likely to influence programmatic results, might also be included in performance measurement systems.
Output Measures
Output measures are important because they represent the direct products of public agencies or programs. They often measure volumes of programmed activity, such as the number of training programs conducted by a job training program, the number of seminars presented by an AIDS prevention program, the miles of new four-lane highways constructed by a state transportation department, or the hours of routine patrol logged in by a local police department. Outputs are often measured in terms of the amount of work that is performed—for example, the number of detoxification procedures completed by a crisis stabilization unit, the number of job interviews arranged for clients of a vocational rehabilitation program, or the gallons of patching material used on roads by highway maintenance crews. Finally, output measures sometimes represent the number of cases that are dealt with by a program, such as the number of flight segments handled by the nation's air traffic control program, the number of AIDS clients who receive counseling, or the number of crimes investigated by the police.
Outputs are sometimes measured at different stages of the service delivery process, and we can think of outputs chains occurring in some programs. For instance, the outputs of crime investigation are usually specified as the number of initial responses to crimes reported, the number of crimes investigated, and the number of arrests made. Juvenile justice boot camps often measure the numbers of juveniles under their charge who complete various training modules and receive other services and the number of juveniles who are discharged from the camps, as well as the number of after-care visits or activities reported. All of these stages of outputs are relevant to track because they provide some indication of the amount of activity or work completed or the number of cases being treated in some way.
Efficiency and Productivity Measures
Efficiency measures focus on the operating efficiency of a program or organization, relating outputs to the resources used in producing them. They are most frequently operationalized as unit cost measures expressed as the ratio of outputs to the dollar cost of the collective resources consumed in producing them. Thus, the cost per crime investigated, the cost per highway project design completed, the cost per AIDS seminar conducted, the cost per ton of residential refuse collected, and the cost per training program completed are all standard efficiency measures. While the operating efficiency of the air traffic control program could be measured by the cost per flight segment handled, a measure of the efficiency of a state board of nursing's disciplinary program would be the cost per investigation completed.
It may be appropriate to track a variety of efficiency measures for a given program. For example, the cost per psychiatric assessment completed, the cost per detoxification procedure conducted, the cost per therapy session conducted, and the cost per support group meeting might all be relevant for a crisis stabilization unit if it has an activity-based accounting system that can track the actual costs for these separate activities. More general measures are often employed, such as the cost per highway lane mile maintained or the cost per case in a child support enforcement program, but they are really based more on workload than outputs. One particular efficiency measure that is often used along these lines is the per diem—the cost per client per day in such residential programs as hospitals, crisis stabilization units, juvenile detention centers, and group homes for mentally disabled persons operated by nonprofit agencies.
While operating efficiency is most commonly expressed by these unit cost measures, however, it is also measured in terms of cycle times, the average time required to produce a single unit of output. With respect to a driver licensing program, for example, the process for renewing licenses in a given drivers' licensing center might generate a renewed license every two minutes on average, while the average time required for a state board of nursing to complete an investigation regarding a reported violation of the authorized scope of practice for nurses licensed in a given state might be 168 days. Such time-based efficiency measures can also be expressed as the volume of output produced in a certain period of time, for example, the feet of guardrail installed per day by a highway maintenance program or the number of claims cleared per month by a disability adjudication process.
Productivity indicators are a special type of efficiency measure that focus on the rate of output production per some specific unit of resource, usually staff or employees. Since public service delivery tends to be labor intensive, labor productivity measures are prevalent in performance monitoring systems focusing on the production of outputs. To be meaningful, they also must be defined in terms of some particular unit of time. For example, the number of flight segments handled per air traffic controller per hour and the number of lane-miles of highway resurfaced per maintenance crew per day are typical measures of labor productivity, as is the number of nursing violation investigations completed per investigator per year.
In some cases, labor productivity ratios use the unit of measurement in both the numerator and denominator, for example, the number of task hours completed per production hour worked on a highway maintenance activity or the number of billable hours of work completed per production hour worked in a state government printing plant. Beyond labor productivity, in some cases the specific resource used as the basis for a productivity indicator may measure equipment rather than personnel, for example, the number of standard images printed per large press per hour in a government printing office or the number of revenue vehicle miles operated per month per bus in a public transit agency's fleet.
Staff-to-client ratios are sometimes loosely interpreted as productivity measures, but this may be misleading. For example, the number of in-house consumers per full-time staff member of a crisis stabilization unit may represent productivity because those consumers are all receiving treatment. However, the number of cases per adjuster in a state workers' compensation program does not really provide much information about the productivity of those employees because some or many of those clients or cases may generate very little, if any, activity. The number of clients per employee in a vocational rehabilitation program may not be particularly useful either, again because the services being provided vary so widely from one client to the next, but the number of clients counseled per vocational rehabilitation counselor would be more meaningful because it represents the amount of work performed per staff member.
Service Quality Measures
The concept of quality pertains most directly to service delivery processes and outputs because they define the service that is being provided. When we think about measuring outputs, we tend to think first of quantity—how much service is being provided—but it is equally important to examine the quality of outputs as well. However, this is not primarily a distinction between hard and soft measures. While service quality is usually assessed subjectively at an individual level, performance measurement systems track quality using more objective, quantitative data in the aggregate.
The most common dimensions of the quality of public and nonprofit services are turnaround time, accuracy, thoroughness, accessibility, convenience, courtesy, and safety. For example, people who are trying to renew their driver's license tend to be most concerned about the accessibility of the location where they do this, the convenience afforded in completing the process, the total time including waiting time that it takes to complete the transaction, and, of course, the accuracy of the paperwork that is processed (so that they won't have to return or repeat part of the process). In the Federal Aviation Administration's air traffic control program, the most important indicator of service quality is the number of controller errors (instances in which controllers allow pilots to breach minimum distances to be maintained between airplanes) per 1 million flight segments handled.
Frequently measures of service quality are based on standard operating procedures that are prescribed for service delivery processes. Quality ratings of highway maintenance crews, for instance, are usually defined by the extent to which the establishment of the work site, handling of traffic through or around the work site, and the actual work of patching potholes or resurfacing pavement comply with prescribed operating procedures for such jobs. Juvenile justice detention centers have operating procedures regarding such processes as safety inspections, fire prevention, key control, perimeter checks, the security of eating utensils, supervision, and the progressive use of physical force or chemical agents in order to ensure the security of the facility and the safety of the juveniles in their custody. Quality assurance ratings are really compliance measures, defined as the extent to which such processes are performed in compliance with prescribed procedures. Yet other quality indicators, such as the number of escapes from juvenile detention facilities or reported instances of child abuse, probably more meaningful in terms of overall program performance, are defined more directly in terms of desired outputs, juveniles detained safely and securely in this example.
Outcome Measures
It is fair to say that outcome measures constitute the most important category of performance measures because they represent the degree to which a program is producing its intended outcomes and achieving the desired results. These may relate to initial, intermediate, or longer-term outcomes. Outcome measures for the air traffic control program, for example, might include the number of near misses reported by pilots, the number of midair collisions, and the number of fatalities per 100 million revenue passenger–miles flown.
The most important outcome measures tie back to the basic purpose of a program. For example, the crisis stabilization unit exists to stabilize persons with psychiatric or drug-induced mental crises and help them modify behaviors in order to avoid falling into these same circumstances again. Thus, a key effectiveness measure might be the percentage of all initial admissions that constitute readmissions within thirty days. Similarly, the most important indicator of the effectiveness of a vocational rehabilitation program is probably the number or percentage of clients who have been successfully employed in the same job for six months. Along these same lines, the most relevant effectiveness measures for a juvenile detention center are probably the percentage of discharged youth who are attending school or engaged in gainful employment and the percentage who have not recidivated back into the criminal justice system within one year of having been discharged. Effectiveness measures for an AIDS prevention program would be likely to include morbidity and mortality rates for AIDS, along with the percentage of newborn babies who test positive for HIV.
Cost-Effectiveness Measures
Whereas indicators of operating efficiency are unit costs of producing outputs, cost-effectiveness measures relate cost to outcome measures. Thus, for the crisis stabilization unit, cost-effectiveness would be measured as the cost per stabilized consumer. For the vocational rehabilitation program, the most relevant indicators of cost-effectiveness would be the cost per client placed in suitable employment and the cost per client successfully employed for six months or more. The cost-effectiveness of criminal investigation activity would probably be measured as the cost per crime solved.
Effectiveness measures often become more esoteric and present more difficult methodological challenges in operationalizing indicators. For example, the cost-effectiveness of highway construction might well be conceptualized as the cost per person-hour of reduced travel time, while the most relevant cost-effectiveness indicator for an AIDS prevention program would probably be the cost per AIDS fatality avoided. Both of these make complete sense in terms of program logic, but they are difficult to operationalize.
Customer Satisfaction Measures
Measures of customer satisfaction are often closely related to service quality indicators, but the two are not identical and should be considered separate categories of performance measures. Similarly, customer satisfaction measures are often associated with effectiveness measures, but they provide a different perspective on overall program performance. For example, measures of customer satisfaction with a vocational rehabilitation program might be based on data from client evaluation forms asking how satisfied they were with training programs they participated in, counseling services they received, and assistance that was provided to them in finding a job. These all focus on program outputs. In addition, clients who have been placed in jobs might be surveyed after several months to assess their satisfaction with these jobs, focusing on program effectiveness. These customer satisfaction ratings may or may not square with more tangible measures of program outputs and effectiveness, but they do provide a complementary perspective.
One way of gauging customer satisfaction is to track complaints. For example, a public library system might monitor the number of complaints received from patrons per week in each branch library. Second, some public and nonprofit agencies use customer response cards to solicit immediate feedback regarding specific instances of service delivery. A government printing office, for instance, might track the percentage of its customers who rate their products as “good” or “excellent.” Probably the most frequently used means of soliciting customer feedback is the customer survey, for example, the percentage of victims reporting that they were “satisfied” with the initial police response to their case. Similarly, a crisis stabilization unit might track the percentage of consumers rating their services as “good” or “excellent,” while a highway maintenance operation might estimate the percentage of motorists who are “satisfied” or “very satisfied” with the condition of the roads they travel on.
System Productivity Measures
Although the term does not appear often in typologies of performance measures, another useful type of performance measure consists of system productivity measures. These measures examine the ratio of outcome measures to related output measures in order to gauge the effectiveness of a public agency or program in converting outputs to outcomes. For example, public transit agencies often monitor the number of passenger trips carried on the system, the principal outcome measure, per vehicle mile or vehicle hours operated, which are standard output measures. Along the same lines, police agencies can track the number of convictions obtained (outcome) to the number of arrests made or cases solved (output), and child support enforcement programs can measure the number of cases with support payment obligated per absentee parent located, while housing rehabilitation programs can monitor the number of dwelling units brought into compliance with codes per loan made under the program. In each of these cases, the system productivity measure provides a clear indication of the extent to which producing specified outputs leads to the accomplishment of desired outcomes.
Resource Measures
Two other types of indicators, resource and workload measures, are usually not thought of as performance measures in their own right, but they are often used in computing other performance measures and are sometimes used in conjunction with other performance measures. All the various types of resources supporting a program can be measured in their own natural measurement units—for example, number of teachers, number of school buildings or classrooms, number of computer work stations in a local school system—or they can be measured and aggregated in their common measurement unit, which is dollar cost. Although resource measures constitute investment at the front end rather than something produced by the program, when managerial objectives focus on improving the mix or quality of resources—maintaining a full complement of teachers, for instance, or increasing the percentage of teachers with a master's degree—then it may be appropriate to track resource measures as indicators of performance. However, the principal use of resource measures in tracking program performance is as a basis for computing efficiency measures, such as the cost per hour of classroom instruction, or cost-effectiveness measures, such as the cost per student graduated.
Workload Measures
Workload measures are often of great concern to managers because they represent the flow of cases into a system or numbers of customers who need to be served. When work standards are in place or average productivity rates have been established, workload measures can be defined to represent resource requirements or the backlog of work in a production system—for example, the number of production hours needed to complete all jobs in the queue in a government printing office or the number of crew-days required to complete all the resurfacing projects that would be needed to bring a city's streets up to serviceable standards. In some cases, when managerial objectives focus on keeping workloads within reasonable limits—not exceeding two workdays pending in a central office supply operation, for example, or keeping the workweeks pending within two weeks in a disability determination program, or reducing the number of cases pending in a large county's risk management program by closing more cases than are opened in each of the next six months—then workload measures may appropriately be viewed as performance measures.
External and Other Environmental Measures
In addition to actual performance measures, it is often helpful for performance monitoring systems to track other measures—variables external to a program itself—which are likely to influence programmatic outcomes and perhaps the production of outputs, efficiency, and service quality as well. For example, the principal outcomes of public transit systems have to do with ridership measured by such indicators as passenger trips carried per month, and ridership is expected to be influenced by such programmatic factors as the amount of transit service provided, the quality of that service, and the fares that are charged. However, other environmental factors, such as unemployment rates, automobile ownership, and the price of gasoline, are likely to exert strong influence on the ability of a transit system to attract ridership as well. Similarly, the success of a city's housing rehabilitation program in raising the percentage of dwelling units that meet decent, safe, and sanitary conditions may depend heavily on the quality of the existing housing stock, the percentage of absentee ownership, socioeconomic characteristics, percentage of vacant properties, the quality of neighborhood schools, and the extent of community cohesion in targeted areas.
In the real world, public and nonprofit programs are designed and delivered within the context of a constant cause system in which an often complex web of physical, social, economic, cultural, political, and interpersonal factors exerts strong causal influence on the kinds of problems that programs are intended to address and the outcomes they are intended to generate. Such programs operate in open systems within which these exogenous variables pertain to the public sector (e.g., other departments and related programs, elected officials, funding agencies) as well as society at large (McDavid & Hawthorn, 2005). While it may be helpful for program planners to first develop system dynamics models (Funnell & Rogers, 2011) of these causal systems and then identify likely intervention points and develop a logic for intervening in the system in order to improve outcome conditions, this is not necessary or particularly helpful for purposes of performance measurement and monitoring.
However, such external factors that are well beyond the control of the program may have an overwhelming influence on its ability to generate the desired kinds of outcomes. Thus, although these external factors do not constitute part of the program logic itself, logic models should not be developed in ignorance of these factors, and it can be very helpful to reference them in conjunction with logic models in order to provide an understanding of the context within which the program logic is expected to operate (Frechtling, 2007).
Given their importance in influencing the extent to which a program's logic is likely to function as anticipated, it can be extremely helpful to track these kinds of external nonprogrammatic factors along with the actual performance measures in order to help interpret and understand the meaning of performance data on a given program over time or data that are monitored to compare the performance of similar types of programs or organizations over time. Because these external factors can facilitate or constrain the performance of public programs and organizations, these kinds of contextual data can be essential for making sense of performance data, and thus it may be helpful to build the relevant environmental variables into monitoring systems along with the actual performance measures.
Needs Indicators
One special type of external variable that bears mention here is needs indicators, measures that represent the extent and characteristics of the need for a public program. While for a public transit agency a principal needs measure might be the percentage of the population in its service area that is transit dependent, needs indicators for a housing rehabilitation problem might be the percentage of dwelling units that are not in compliance with local building and sanitation codes or the percentage of households living in substandard dwelling units. Similarly, the need for an HIV/AIDS treatment program might be measured by the percentage of the population living with HIV or the percentage of new babies born with HIV. The need for a high school student retention program would likely be measured by the dropout rate before the end of the junior year in a local school district.
While such needs measures obviously play a crucial role in needs assessments and program planning efforts, they are germane to program evaluation and performance monitoring systems as well. Since needs indicators represent the kinds of problematic conditions that public programs are often designed to remediate, outcome measures often focus on the extent to which needs have been addressed. For example, one needs indicator for local police agencies is the number of personal and property crimes reported per 1,000 population each month. Principal outcome measures for police work include the percentage of crimes solved and the percentage of reported crimes for which a conviction is obtained. If police efforts are successful over time in both taking criminals out of the general population and deterring other potential perpetrators from committing crimes, we might well expect overall crime rates in the local community to decrease. Thus, one longer-term outcome might be measured as the percentage reduction in overall crime rates, the other side of the coin of the original needs indicator representing baseline crime rates. Tracking needs indicators in ongoing performance monitoring systems, then, can often provide a complementary indication of a program's overall effectiveness over time.
Integrated Sets of Performance Measures
When a good logic model has been developed for a public program, one can identify the kinds of measures that would be appropriate to include in a performance monitoring system directly from the model. It is important to understand that we are not referring to the actual performance indicators at this point; these will have to be operationalized in terms of data sources, observations, and definitions regarding what should count and what should not count, as discussed fully in chapter 4. However, when we are working with a good logic model, what we should try to measure—the products and services, knowledge, capabilities, behaviors and actions, conditions and results, and so forth that constitute performance—should become readily apparent. First, the outputs and the outcomes shown in the logic model translate directly into output and outcome measures. Productivity measures will be based on ratios of those outputs to various categories of resources going to the program, and efficiency measures will be based on ratios of those same outputs to the dollar value or time invested in producing them.
To identify the appropriate measures of service quality requires examining the outputs specified in the model and identifying the important dimensions of the quality of the outputs or the activities or processes associated with producing them. Customer satisfaction measures will focus on satisfaction with the service delivery processes that customers or clients have experienced, the outputs that have been produced, or the outcomes they have experienced. Cost-effectiveness measures will consist of ratios of the resulting outcomes to the dollar value of the resources invested in producing the outputs that have led to these outcomes.
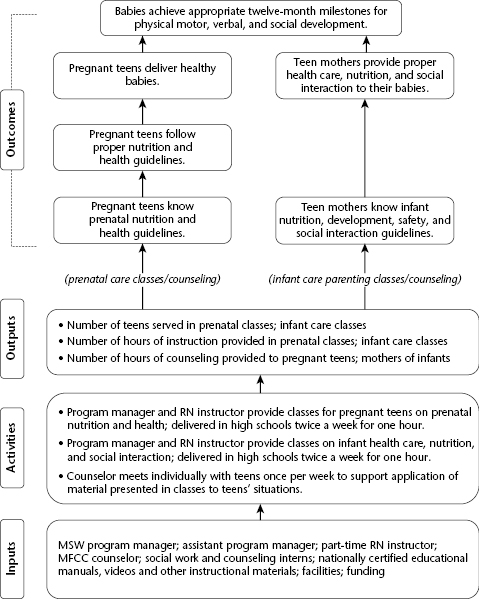
Teen Mother Parenting Education Program
Figure 3.6 presents a logic model for a teen mother parenting education program operated by a nonprofit organization in a particular local area. The goals of the program are to help ensure that pregnant teenagers deliver healthy babies, that they are equipped to care for their babies, and that they don't have additional pregnancies until they are ready to care for additional babies. Service delivery consists of conducting classes on prenatal care and infant parenting, and the program's outputs could be measured in terms of the number of classes conducted or, more meaningfully, the number of pregnant teenagers completing the program.
Source: United Way of America (2002). Used with permission.
The outcomes that the classes are intended to produce occur in three strands of logic. First, teens who complete the program will be knowledgeable about prenatal nutrition and healthy habits. This will lead to their following proper guidelines regarding nutrition and health, and this will lead to a higher probability of the desired outcome of delivering healthy babies. Second, as an initial outcome of the classes, these teens will also be more knowledgeable about the proper care, feeding, and interaction with their infants, which will lead to the intermediate outcome of their actually providing the same to their babies once they are born.
Then the delivery of healthy babies and assurance that they will be provided with proper care should result in these babies achieving appropriate twelve-month milestones regarding physical, verbal, and social development. The third strand of logic really leads to a different longer-term outcome: having completed the classes, these pregnant teenagers are also more knowledgeable about birth control options and parental responsibilities. This is supposed to lead to more responsible sexual behavior—abstinence or use of birth control methods—to ensure that they do not have additional pregnancies until their education is complete and they are married with adequate family resources in place to provide responsible parenting to additional children they might have.
Indicators in each of these categories can potentially be identified to measure the performance of most programs provided by governmental and nonprofit organizations. For example, table 3.2 illustrates the kind of performance measures that might be appropriate for monitoring the performance of the teen mother parenting education program. These measures are derived directly from the program logic model presented in figure 3.6. The program outputs are the number of courses conducted and the number of participants completing the program. Thus, operating efficiency would be measured by the cost per course conducted and the cost per participant completing the program, and labor productivity could be measured by the number of pregnant teens completing the program per staff-hour invested in its delivery. Service quality in this case might be measured by some professional assessment of the quality of the materials used in the course, teaching techniques employed, and the actual delivery of the course or, as suggested in table 3.2, we might rely on course evaluations from program participants.
Table 3.2 Teen Mother Parenting Education Performance Measures
| Outputs |
| Number of prenatal classes conducted |
| Hours of instruction in prenatal classes |
| Number of infant care classes conducted |
| Hours of instruction in infant care classes |
| Number of participants completing prenatal classes |
| Numbers of participants completing infant care classes |
| Hours of counseling provided to pregnant teens |
| Hours of counseling provided to mothers of infants |
| Operating Efficiency |
| Cost per course completed |
| Cost per instructional hour |
| Cost per pregnant teen completing the program |
| Cost per counseling hour |
| Labor Productivity |
| Number of pregnant teens completing program per staff-hour invested |
| Service Quality |
| Course evaluation ratings by participants |
| Effectiveness |
| Test scores regarding prenatal care and the care and feeding of and interaction with babies |
| Percentage of participants who eat at least four calcium servings and one serving of each of the other nutritional food groups daily |
| Percentage of participants who do not smoke |
| Percentage of participants who take a prenatal vitamin daily |
| Percentage of participants within proper ranges for prenatal weight gain |
| Percentage of newborn babies weighing at least 5.5 pounds and scoring 7 or above on the Apgar scale |
| Percentage of attendees observed to provide proper care and feeding of and interaction with babies |
| Percentage of attendees' babies clinically evaluated as achieving appropriate twelve-month milestones |
| Cost-Effectiveness |
| Cost per healthy baby achieving appropriate twelve-month milestones |
| Customer Satisfaction |
| Percentage of program completers reporting satisfaction with program after babies are born |
Numerous outcome measures are shown because the program logic model shows three strands of results with multiple outcome stages in each. So the effectiveness measures range from scores on tests regarding the kind of knowledge the program is designed to impart, to the percentage of participants delivering healthy babies, the percentage of these babies achieving appropriate twelve-month developmental milestones, the percentage of these mothers subsequently reporting abstinence or the use of recommended birth control techniques, and the percentage of these teenage mothers who are high school graduates, married, and in no need of public assistance at the time of their next pregnancy. Cost-effectiveness measures might be defined by relating costs to any of these outcomes, but the most compelling ones might be the cost per healthy baby achieving appropriate twelve-month milestones and the cost per repeat premature pregnancy avoided. Finally, the most meaningful indicator of customer satisfaction might be the percentage of teens completing the program who report overall satisfaction with it at some time well after their babies have been born.
Canadian Pension Plan Disability Program
As a second example, consider the logic model proposed for the Canadian Pension Plan Disability (CPPD) Program shown in figure 3.7. The principal components of this entitlement program include outreach to potentially eligible recipients of the program, eligibility determination, client recourse system, case management, and workforce reintegration. The first four of these components feed into each other in a pipeline sequence leading to individuals who qualify for the disability benefits applying to the program, being found eligible for benefits, and receiving monthly benefit checks. Through periodic assessments of recipients' capabilities for reentering the workforce and the provision of vocational rehabilitation services, the fourth program component assists clients in reintegration into the workforce and leaving the benefit program when feasible.

Table 3.3 shows suggested performance measures running from outputs to intermediate outcomes for each of these program components, as well as measures relating to the longer-term outcome of enhanced social and economic inclusion of persons with disabilities in Canadian society. For each component of the CPPD program, a set of measures has been identified, including output and outcome measures, along with a mix of efficiency, labor productivity, service quality, and customer satisfaction measures in order to provide a balanced portrait of that component's performance. While the output measures and various stages of outcome measures are drawn directly from the logic model in figure 3.7, the efficiency and productivity measures are developed based on ratios of outputs to units of resources, and the service quality and customer satisfaction measures are intuited from the model by asking, “What are the most relevant quality dimensions of these outputs and the service delivery processes associated with them?” and, “What are the most important aspects of service delivery, outputs, and/or outcomes in terms of customer satisfaction?”
Table 3.3 Performance Measures for the Canadian Pension Plan Disability Program Workforce Reintegration Component
| Outputs | Number of clients receiving vocational rehabilitation services |
| Number of return-to-work assessments completed | |
| Operating efficiency | Cost per client in caseload |
| Cost per return-to-work assessments completed | |
| Immediate outcomes | Number of clients assessed as being ready to work |
| Number of clients who have returned to work | |
| Number of clients who have left disability program benefits | |
| Percentage of clients who remain off benefits for six months or longer | |
| Percentage of clients who return to benefits using the fast track application process | |
| Cost-effectiveness | Program cost per client who returns to work |
| Program cost per client who leaves benefits | |
| Program cost per client who remains off benefits for six months or more | |
| Longer-term outcomes—CPPD program | Percent of twenty-two- to sixty-four-year-old population receiving CPPD benefits |
| Mean average benefit payout to recipients and families | |
| Percentage of total net income of recipients provided by CPPD | |
| Percentage of CPPD recipients who are benefiting from the disability tax credit | |
| Percentage of clients returning to work | |
| Cost-effectiveness | Administrative cost per client receiving benefits |
| Administrative cost per $100 of benefits received | |
| Operating cost per client receiving benefits |
Developing Logic Models
Obviously a critical first step in developing performance measures for public and nonprofit programs is to identify what should be measured. The program logic models presented in this chapter encourage focusing on end results, the real outcomes that a program is supposed to generate, and the outputs or immediate products that must be produced in order to bring about those results. Developing such logic models helps to identify what is important to measure.
But how does one go about developing a logic model for a particular public or nonprofit program? Looking at formal statements of mission and, especially, goals and objectives is a good place to begin because they should articulate the kinds of outcomes that are expected to be produced. Since results-oriented management systems require performance measures that are directly tied to goals and objectives, this linkage is discussed in greater detail in chapter 4. Beyond goal statements regarding outcomes, the logic outlined by a program logic model is based on theory, experience, and research. Thus, reviewing relevant academic literature on intervention theories, program plans and other descriptions, and evaluation studies in particular substantive areas, along with engaging knowledgeable stakeholders in discussions regarding intervention strategies and program design, can help provide the kind of information needed to flesh out a logic model.
There is a wide variety of program logic models in terms of scope and complexity, level of detail, formatting, and strategies for articulating the flow of logic leading to outcomes that goes far beyond the scope of this book. The goal should always be to develop a coherent model that clearly communicates the logic by which programmatic activities are expected to lead to the intended outcomes. Some books that provide in-depth discussion of logic models and their development and serve as useful resources in this regard include McDavid and Hawthorn (2006), Frechtling (2007), Funnell and Rogers (2011), and Knowlton and Phillips (2012). In addition, the outcome indicators project has developed prototype logic models and illustrative sets of performance measures for fourteen specific program areas of interest to nonprofit organizations (www.urban.org/center/cnp/projects/outcomeindicators.cfm) and a report published by United Way of America (Hatry, Van Houten, Plantz, & Greenway, 1996) provides guidelines for developing performance frameworks and measures for nonprofit organizations. Selected tips for creating useful logic models culled from these sources include the following:
- State constructs in the model as simply and precisely as possible.
- Distinguish accurately between outputs and outcomes.
- Identify outcomes as intended results rather than specific measures.
- Focus on the key elements, and remove nonessential elements.
- Include interactions and feedback loops when appropriate, but avoid unnecessary arrows.
- Avoid dead-ends—elements that do not lead directly or indirectly to intended outcomes.
- Identify expected time frames for immediate, intermediate, and long-term outcomes to occur.
- Employ the appropriate level of granularity—the level of detail that will be most helpful given the purpose of the performance measurement system.
- Ensure readability, and avoid mysterious acronyms.
A backward-mapping approach beginning with identification of longer-term outcomes is often helpful in delineating the logic underlying program logic models, especially in program planning but also in performance measurement. With a clear understanding of what the desired longer-term outcomes are, you can ask, “What are the impediments to these outcomes occurring on their own, and what has to happen in order to generate these longer-term outcomes?” Answering these questions will help to identify the necessary initial and intermediate outcomes that must be generated. They in turn should tie directly to outputs being directly produced by the program. While beginning at the outset of the program logic by identifying activities and outputs and then identifying subsequent outcomes may be effective in developing a logic model, a backward-mapping approach may at least in some cases lead to a more appropriate logic model because it is rooted in the desired results from the outset. Combining the two approaches by beginning with outcomes but then working both “back and forth and up and down” through the various components is often a central part creating a sound logic model (Frechtling, 2007, 90).
Either way, developing a program logic model will usually be most successful when approached as a collaborative process (Funnel & Rogers, 2011). In addition to program managers, it often helps to engage employees, service delivery staff, consumers, agency clients, program advocates, governing board members, and other concerned parties in the process. While it may be very helpful for an analyst or program staff to sketch out an initial version of the model to get the process moving, it will usually be much more effective in the long run to involve other parties in fleshing it out, refining it, and moving toward a final product. Thus, developing a logic model may be an iterative process with a few rounds of review and revision. However, if consensus on the model can be built among these various stakeholders through such a process, the probability that the performance measures derived from the model will be broadly supported is greatly increased.
Whatever approach is used in a particular performance measurement effort, the cardinal rule should be never to bend reality to fit a preconceived model. What is important is to model the program or organization as it is or as it should be; the model should be thought of as a tool for understanding how the program is intended to operate. Fortunately, the program logic methodologies presented here are very flexible and should be adaptable to almost any programmatic or organizational setting. Once the model has been developed and a strong consensus has been built around it as an appropriate performance framework, it tends to become the arbiter of issues regarding what aspects of performance should be included in a monitoring system, and measures of outputs, quality, efficiency, productivity, effectiveness, cost-effectiveness, and customer satisfaction can be defined with confidence.
References
- Broom, C., Harris, J., Jackson, M., & Marshall, M. (1998). Performance measurement concepts and techniques. Washington, DC: American Society for Public Administration/Center for Accountability and Performance.
- Frechtling, J. A. (2007). Logic modeling methods in program evaluation. Hoboken, NJ: Wiley.
- Funnell, S. C., & Rogers, P. J. (2011). Purposeful program theory: Effective use of theories of change and logic models. San Francisco: Jossey-Bass.
- Hatry, H., Van Houten, T., Plantz, M. C., & Greenway, M. T. (1996). Measuring program outcomes: A practical approach. Alexandria, VA: United Way of America.
- Knowlton, L. W., & Phillips, C. C. (2012). The logic model guidebook: Better strategies for great results. Thousand Oaks, CA: Sage.
- McDavid, J. C., & Hawthorn, L.R.L. (2006). Program evaluation and performance measurement: An introduction to practice. Thousand Oaks, CA: Sage.
- Poister, T. H. (1978). Public program analysis: Applied research methods. Baltimore, MD: University Park Press.
- Poister, T. H., McDavid, J. C., & Magoun, A. H. (1979). Applied program evaluation in local government. Lexington, MA: Lexington Books.
- Sowa, J. E., Selden, S. C., & Sandfort, J. R. (2004). No longer unmeasurable? A multidimensional integrated model of nonprofit organizational effectiveness. Nonprofit and Voluntary Sector Quarterly, 33(4), 711–728.
- United Way of America. (2002). Teen mother parenting education program logic model. Unpublished chart.
- Wholey, J. S. (1979). Evaluation: Promise and performance. Washington, DC: Urban Institute.