
6
Limit Order Flow, Market Impact, and Optimal Order Sizes: Evidence from NASDAQ TotalView-ITCH Data
6.1 INTRODUCTION
Electronic limit order book (LOB) systems are the dominant trading form of most financial markets worldwide, including leading exchanges like NASDAQ, NYSE, BATS, and Euronext, various Alternative Trading Systems (ATSs), and Electronic Communication Networks (ECNs). The recent decade witnesses substantial technological progress in trading systems as well as trade recording and an increasing importance of intraday trading. Transparency, low latency, high liquidity, and low trading costs attract an increasing number of intraday traders, long-horizon traders as well as institutional investors. Though electronic limit order book trading has already existed for many years, further developments in trading systems and structures are ongoing and are faster than ever before. The successive automatization of order management and execution by computer algorithms, the growing importance of smart order routing as well as changes of market structures and trading forms challenge empirical and theoretical market microstructure research.
The objective of this chapter is to provide new empirical evidence on order activities and market dynamics at NASDAQ – the largest electronic market for equities in the US By employing TotalView-ITCH data containing information directly stemming from the NASDAQ data feed, our study sheds some light on recent order arrival rates, execution rates, cancellation rates, and the price impact of incoming quotes. Particularly, the market impact of a limit order is a key parameter for trading decisions and plays a crucial role for (algorithmic) trading strategies. Also theoretical studies, such as, for example, Harris (1997), Parlour and Seppi (2008), Boulatov and George (2008), or Ro![]() u (2010), predict that the revelation of a trading intention by limit order placements can indeed adversely affect asset prices. Despite its importance, empirical evidence on the influence of incoming limit orders is still limited. Only very recently, Hautsch and Huang (2012), Eisler et al. (2011) and Cont et al. (2011) analyzed the price impact of limit orders and found significant effects. In this study, we employ Hautsch and Huang's (2012) framework, which extends the approach by Engle and Patton (2004) and provides deeper insights into the market impact of limit orders in recent NASDAQ trading. Of particular interest is whether the magnitudes of price impacts identified in other markets are also found in the extremely liquid NASDAQ market and which limit order sizes can be ultimately posted without significantly moving the market.
u (2010), predict that the revelation of a trading intention by limit order placements can indeed adversely affect asset prices. Despite its importance, empirical evidence on the influence of incoming limit orders is still limited. Only very recently, Hautsch and Huang (2012), Eisler et al. (2011) and Cont et al. (2011) analyzed the price impact of limit orders and found significant effects. In this study, we employ Hautsch and Huang's (2012) framework, which extends the approach by Engle and Patton (2004) and provides deeper insights into the market impact of limit orders in recent NASDAQ trading. Of particular interest is whether the magnitudes of price impacts identified in other markets are also found in the extremely liquid NASDAQ market and which limit order sizes can be ultimately posted without significantly moving the market.
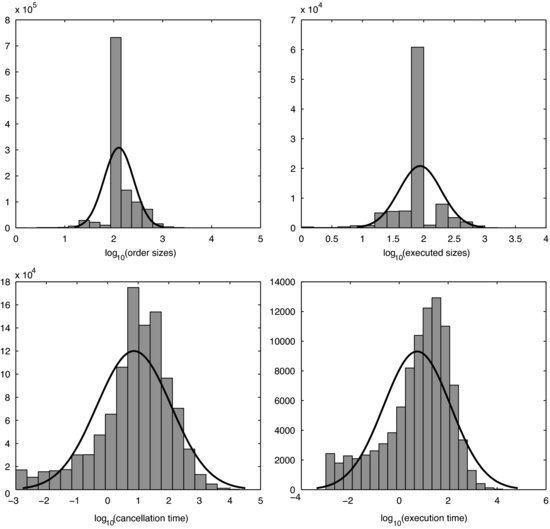
TotalView-ITCH data contains all order messages and thus allows us to reconstruct the NASDAQ limit order book in a very precise way, particularly accounting for all high-frequency limit order activities including also so-called fleeting orders. The latter are present for only a few seconds and have the purpose of testing for hidden orders placed in the bid-ask spread. A detailed analysis of the NASDAQ order flow in October 2010 provides the following major results. First, the number of limit order submissions is twenty to forty higher than the number of trades. Second, limit order sizes are typically small and clustered at round lot sizes of a hundred shares. Third, more than 95 % of all limit orders are cancelled without getting executed, with most of them being cancelled nearly instantaneously (less than one second) after their submission, reflecting the proliferation of algorithmic trading at NASDAQ. Fourth, volume-weighted execution times are significantly greater than average execution times, indicating that large orders face more execution risk than small ones.
The market impact of limit orders is quantified by modeling ask and bid quotes and several levels of depth in terms of a cointegrated vector-autoregressive (VAR) system, which is updated in event time. Short-run and long-run quote reactions are quantified by impulse-response functions. As proposed by Hautsch and Huang (2012), this framework allows us to estimate the impact of specific limit order activities including limit order submissions, cancellations, and executions (corresponding to trades), which are represented as shocks to the system. Our empirical results show that the short-run and long-run quote reaction patterns after the arrival of a limit order are indeed quite similar to those, for example, found for Euronext Amsterdam (see Hautsch and Huang, 2012). Buy (sell) limit orders cause permanent quote increases (decreases) and a temporary decline of the spread. Moreover, we find that the permanent impact of a limit order posted at the best quote is in most cases approximately 25 % of that of a trade of similar size. However, this magnitude can be much smaller when hidden orders are placed inside of the spread. As on other liquid markets, only aggressive limit orders posted on the first or second order level induce significant price impacts whereas orders posted with greater distance to the market have virtually no effect.
Finally, using the estimates of market impacts, we suggest a way to compute the optimal size of a limit order given its expected price impact. The implied order size is calculated by inverting the closed form of the permanent impact, yielding a function of the current limit order book and the given market impact control level. This provides useful information to control risks in trading strategies.
The remainder of the chapter is organized in the following way. Section 6.2 briefly introduces the market environment and the data. Section 6.3 provides an explorative analysis of the order flow. The econometric framework is reviewed in Section 6.4. Section 6.5 gives empirical evidence of short-run and long-run quote reactions on order activities. In Section 6.6, we propose a method to compute the optimal order size subject to its position in the book and the expected market impact. Finally, Section 6.7 concludes.
6.2 MARKET ENVIRONMENT AND DATA
The NASDAQ stock market is the largest electronic stock market (in terms of trading volume) in the world. In 2006, its traditional market center, Brut and INET electronic communication networks (ECNs), were integrated into a single system. This system offers a single execution algorithm based on price and time order precedence for both market makers and participants of ECNs. During the continuous trading period between 9:30 and 16:00 EST, limit orders are submitted to a centralized computer system where they are matched to prevailing limit or hidden orders on the opposite side. If there is no match or the standing volume in the system is insufficient to execute the incoming order fully, the remaining order volume is placed in the order book. NASDAQ supports various order types like pure market orders (immediate order execution without a price limit), stop orders (automatic issuing of limit orders or market orders when a given price is reached), immediate-or-cancel (IOC) orders, reserve orders, and nondisplay orders, among others.
In this study, we use TotalView-ITCH data containing rich information on order activities. The database includes limit order submissions, cancellations, executions, and hidden order executions for every trading day since 7:00 a.m. EST when the system starts accepting incoming limit orders. The system is initialized by an empty order book where all overnight limit orders are resubmitted automatically at the beginning of each day. Therefore, we can exactly reconstruct the order book at any time by aggregating the existing visible limit orders according to their limit prices. Furthermore, NASDAQ TotalView, surpassing NASDAQ Level 2, is the standard NASDAQ data feed for displaying the full order book depth for market participants. Hence, the reconstructed order book exactly represents historical real-time-disseminated order book states. Trades are identified via the records of limit orders and hidden order executions. Since the trading direction of limit orders and hidden orders is recorded, we can exactly identify whether a trade is buyer-initiated or seller-initiated. Finally, TotalView-ITCH data record a unique identification of any limit order, which allows it to track the order and to compute, for instance, its lifetime.1
Note that a market order, especially when its order size is comparably large, is likely to be filled by several pending limit orders. This results in multiple limit order executions corresponding to a sequence of same-type (sub)trades within a short time interval. We identify transactions as subtrades if they occur in less than half a second after the previous trade and have the same initiation types. All corresponding subtrades are consolidated to a single trade representing a market order. Furthermore, to avoid erratic effects during the market opening and closure, our sample period covers only the continuous trading periods between 9:45 and 15:45.
We select ten assets out of the 200 biggest stocks listed at NASDAQ according to their market capitalization on 1 October 2010. To obtain a representative cross-section, we first divide the 200 stocks into twenty blocks and then randomly select one stock from each category. Table 6.1 summarizes fundamental characteristics of these stocks extracted from the Center for Research in Security Prices (CRSP) database.
Table 6.1 Summary statistics of selected stocks. The variables are calculated for each stock using data from the Center for Research in Security Prices (CRSP) database. The sample period covers October 2010, including 21 trading days. MktCap is the market capitalization by 1 October 2010. AvgVol denotes the average daily volume (in thousand shares). MedTurn is the median daily turnover. AvgPrc denotes the average daily closing price. StdRet gives the standard deviation of daily returns
Table 6.2 Limit order activities at NASDAQ. These are calculated for each stock using TotalView-ITCH messages. The sample period covers October 2010, including 21 trading days. NumLO is the average daily number of standing limit orders. AvgSZ denotes the average size of limit orders. NumALO is the average daily number of limit orders placed inside the spread (“aggressive” limit orders). NumALO (in %) gives the percentage of aggressive limit orders. NumExe is the number of limit orders being (possibly partially) executed. MedETim denotes the median execution time of limit orders. VWETim is the volume-weighted execution time. NumCanc (in %) is the percentage of limit orders that are cancelled without (partial) execution. MedCTim denotes the median cancellation time. NumACan (in %) is the cancellation rate of aggressive limit orders. MedACTim gives the median cancellation time of aggressive limit orders
Figure 6.1 Histogram of order sizes, execution sizes, cancellation times, and execution times of limit orders. The black line denotes kernel density estimates. Zero cancellation times and execution times are discarded. Trading of WCRX on NASDAQ in October 2010.
6.3 MAJOR ORDER FLOW AND ORDER BOOK CHARACTERISTICS
Electronic limit order book markets are characterized by high transparency and low latency. They enable most market participants having a view on the current state of the market via real-time updated order books. Traders’ instructions are transmitted to the trading platform and executed with extremely short time delays (usually only a few milliseconds).2 As a consequence, sophisticated trading strategies minimizing trading costs and exploiting high-frequency price movements are performed using computer algorithms. Triggered by technological advances, systematic trading is highly sophisticated nowadays. For instance, in order to make a profit from high frequency price fluctuations and liquidity rebates, many high frequency trading algorithms post a huge number of limit orders, which are again cancelled almost immediately if they are not executed. As a consequence, enormous limit order activities on extremely high frequencies are observed.
Table 6.2 summarizes the limit order activities of selected stocks and Figure 6.1 shows the histograms of constructed variables for one illustrating stock, Warner Chilcott plc (ticker symbol WCRX).3 The following main findings can be summarized:
Note that the quickly cancelled limit orders change the order book but reverse it back immediately. This nearly instantaneous change is virtually unobservable for humans but can be captured only by trading algorithms run by high-speed computers connecting to exchanges with very low latency.4 Though such limit order activities do not generally provide any liquidity to the market, they are indispensable for analyzing order book dynamics.
Table 6.3 gives summary statistics of market order activities. The number of market orders is substantially smaller than the number of (incoming) limit orders. Interestingly, most market orders are filled by standing limit or hidden orders pending at prices better than or equal to the best quote. Hence, we hardly find market orders walking through the order book.
Table 6.3 Market order activities. These are calculated for each stock using TotalView-ITCH messages. The sample period covers October 2010, including 21 trading days. NumMO is the average daily number of market orders. AvgSZ denotes the average size of market orders. NumIS (in %) is the percentage of market orders completely filled by hidden orders placed in the spread. NumL1 (in %) is the percentage of market orders filled at the best displayed quote. NumL2 (in %) is the percentage of market orders walking through the book up to the second level. NumL3 (in %) is the percentage of market orders walking through the book up to (or deeper than) the third level
Table 6.4 gives descriptive statistics of the order book data used in the chapter. We observe significantly more order book updates in the first three order levels than transactions. Moreover, on average, second level market depth is higher than the first level depth while it is lower than the depth on the third level.
Table 6.4 Summary of order books. The variables are calculated for each stock using reconstructed order book data. The sample period covers October 2010, including 21 trading days. AvgObs(![]() ) is the average number of observations per day. AvgTrd is the average number of daily trades. AvgAsk is the average of the best ask quote in order books. AvgBid is the average of the best bid quote. AvgSpr ($) is the average dollar spread in cents. AvgSpr (%) is the average relative spread. L1 to L3 denote the average pending volume on the best quote up to the third best quote
) is the average number of observations per day. AvgTrd is the average number of daily trades. AvgAsk is the average of the best ask quote in order books. AvgBid is the average of the best bid quote. AvgSpr ($) is the average dollar spread in cents. AvgSpr (%) is the average relative spread. L1 to L3 denote the average pending volume on the best quote up to the third best quote
6.4 AN ECONOMETRIC MODEL FOR THE MARKET IMPACT OF LIMIT ORDERS
To estimate the market impact of limit orders, we apply the framework proposed by Hautsch and Huang (2012). The major idea is to model the limit order book in terms of a cointegrated VAR model for quotes and order book depth and to back out the price impact of specific types of limit orders based on impulse response functions.
6.4.1 A cointegrated VAR model for the limit order book
Denote t as a (business) time index, indicating all order book activities, i.e., incoming limit or market orders as well as limit order cancellations. Furthermore, pat and pbt denote the best log ask and bid quotes instantaneously after the tth order activity and va,jt and vb,jt, ![]() , define the log depth on the jth best observed quote level on the ask and bid side, respectively. Moreover, to capture dynamic interactions between limit order and market order activities, we define two dummy variables,
, define the log depth on the jth best observed quote level on the ask and bid side, respectively. Moreover, to capture dynamic interactions between limit order and market order activities, we define two dummy variables, ![]() and
and ![]() , indicating the occurrence of buy and sell trades. Then, the resulting
, indicating the occurrence of buy and sell trades. Then, the resulting ![]() -dimensional vector of endogenous variables is given by
-dimensional vector of endogenous variables is given by
The quote levels associated with va,jt and vb,jt are not observed on a fixed grid at and behind the best quotes. Consequently, their price distance to pat and pbt is not necessarily exactly j−1 ticks but might be higher if there are no limit orders on all possible intermediate price levels behind the market. However, Table 6.3 shows that trades “walking through the book”, i.e., trades absorbing more than one price level in the limit order book, occur extremely rarely. Consequently, we expect that an augmentation of the system by the inclusion of level-specific limit prices does not provide significantly additional information but just increases the dimension and the complexity of the system.
Note that market depth enters the vector yt in levels and thus is treated as a possibly nonstationary variable. Since market depth is highly persistent and (on very high frequencies) reveals features of a near-unit-root process, Hautsch and Huang (2012) recommend treating this variable as being possibly nonstationary. This guarantees consistency of estimates, even if market depth is truly stationary.
Following Hautsch and Huang (2012) we model the process in terms of a restricted cointegrated VAR model of the order p (VAR(p)) with the vector error correction (VEC) form for ![]() :
:
where ut is white noise with covariance matrix ![]() ,
, ![]() is a constant,
is a constant, ![]() with
with ![]() is a
is a ![]() parameter matrix, and
parameter matrix, and ![]() and
and ![]() denote the
denote the ![]() loading and cointegrating matrices with r<k. By treating the trading indicators
loading and cointegrating matrices with r<k. By treating the trading indicators ![]() and
and ![]() as stationary variables, the two first columns of
as stationary variables, the two first columns of ![]() are restricted to
are restricted to ![]() and
and ![]() .
.
The corresponding reduced VAR representation in levels of yt is given by
where ![]() with Ik denoting a
with Ik denoting a ![]() identity matrix,
identity matrix, ![]() with 1<i<p, and
with 1<i<p, and ![]() . As illustrated by Hautsch and Huang (2012), the model (6.2) can be estimated by a full information maximum likelihood (FIML) according to Johansen (1991) and Johansen and Juselius (1990).
. As illustrated by Hautsch and Huang (2012), the model (6.2) can be estimated by a full information maximum likelihood (FIML) according to Johansen (1991) and Johansen and Juselius (1990).
Table 6.5 shows the estimated cointegrating vectors for a representative trading day, where we omit the two known cointegrating vectors associated with the (stationary) trading indicators and all corresponding elements in the remaining cointegration vectors. The resulting vectors are ordered according to their corresponding eigenvalues, reflecting their likelihood contributions.
Table 6.5 Representative estimates of cointegrating vectors. The vectors are sorted according to their corresponding eigenvalues in Johansen's ML approach. Overall there are nine cointegrating vectors. Two of them are known, i.e., ![]() and
and ![]() , representing the stationary trading indicators. Accordingly, the elements corresponding to BUY and SELL in
, representing the stationary trading indicators. Accordingly, the elements corresponding to BUY and SELL in ![]() to
to ![]() are set to zero and are omitted as well. Trading of WRCX at NASDAQ on 1 October 2010
are set to zero and are omitted as well. Trading of WRCX at NASDAQ on 1 October 2010
We observe that the first five and the last cointegration relations are mostly linear combinations of spreads and depths. Specifically, the first one is quite similar to a linear combination mimicking the bid-ask spread. The most interesting relationship is implied by the vector ![]() , revealing relatively large (and different) coefficients associated with the depth variables. This indicates that depth has a significant impact on the long-term relationship between quotes. Intuitively, the connection between ask and bid quotes becomes weaker (and thus deviates from the spread) if the depth is less balanced between both sides of the market. Hence, depth has a significant impact on quote dynamics and should be explicitly taken into account in a model for quotes. These results strongly confirm corresponding findings by Hautsch and Huang (2012) for trading at Euronext.
, revealing relatively large (and different) coefficients associated with the depth variables. This indicates that depth has a significant impact on the long-term relationship between quotes. Intuitively, the connection between ask and bid quotes becomes weaker (and thus deviates from the spread) if the depth is less balanced between both sides of the market. Hence, depth has a significant impact on quote dynamics and should be explicitly taken into account in a model for quotes. These results strongly confirm corresponding findings by Hautsch and Huang (2012) for trading at Euronext.
Finally, note that model (6.3) can be further rotated in order to represent dynamics in spreads, relative spread changes, midquotes, midquote returns as well as (ask-bid) depth imbalances. Hence, the model is sufficiently flexible to capture the high frequency dynamics of all relevant trading variables. In this sense, the approach complements dynamic models for order book curves such as proposed by Härdle et al. (2009) and Russell and Kim (2010).
6.4.2 Estimating market impact
The market impact of limit orders can be backed out by representing an incoming order as a shock to the dynamic order book system, as specified in Equation (6.3). Whenever an order enters the market, it (i) will change the depth in the book, (ii) may change the best quotes depending on which position in the queue it is placed, and (iii) will change the trading indicator dummy in case of a market order. Consequently, the direct effects of a limit order can be represented in terms of a “shock” vector ![]() , where
, where ![]() denotes a
denotes a ![]() vector containing shocks in quotes,
vector containing shocks in quotes, ![]() is a
is a ![]() vector representing shocks in depths, and
vector representing shocks in depths, and ![]() denotes a
denotes a ![]() vector containing changes of the trading indicator
dummy.
vector containing changes of the trading indicator
dummy.
Following Hautsch and Huang (2012), we design the impulse response vectors associated with four scenarios commonly faced by market participants. As graphically illustrated by Figures 6.2 to 6.4, a three-level order book is initialized at the best ask pat=1002, best bid pbt=1000, second best ask 1003, second best bid 999, and depth levels on the bid side vb,1t=1, vb,2t=1.5, vb,3t=vb,4t=1.4. The following scenarios are considered:5
Figure 6.2 (Scenario 1a (normal limit order)) An incoming buy limit order with price 1000 and size 0.5. It affects only the depth at the best bid without changing the prevailing quotes or resulting in a trade.
Source: Figure from Hautsch and Huang, 2012.
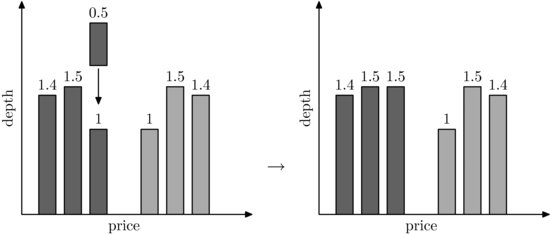
Figure 6.3 (Scenario 2 (aggressive limit order)) An incoming buy limit order with price 1001 and size 0.5 improving the best bid and changing all depth levels on the bid side of the order book.
Source: Figure from Hautsch and Huang, 2012.
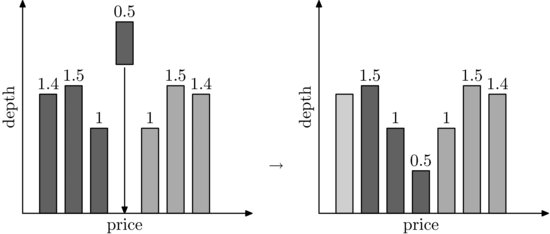
Figure 6.4 (Scenario 3 (normal market order)) An incoming buy market order with price 1002 and size 0.5, which results in a buyer-initiated (buy) trade.
Source: Figure from Hautsch and Huang, 2012.
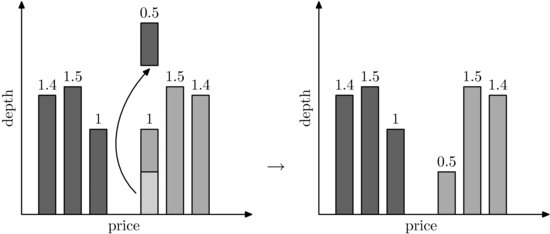
Table 6.6 summarizes the shock vectors implied by the illustrating scenarios.
Table 6.6 Shock vectors implied by the underlying four scenarios. Initial order book: best ask pat=1002, best bid pbt=1000, second best ask =1003, second best bid = 999. Volumes on the ask/bid side: va/b,1t=1 at the best bid, va/b,2t=1.5 at the second best bid, and va/b,3t=va/b,4t=1.4 at the third and fourth best bids, respectively. Notation: ![]() denotes changes in market depths;
denotes changes in market depths; ![]() denotes changes of the best bid and best ask;
denotes changes of the best bid and best ask; ![]() denotes changes of the trading indicator variables.
denotes changes of the trading indicator variables.
Source: Table from Hautsch and Huang, 2012.
The market reactions induced by incoming limit orders are captured by the impulse response function
where the shock on quotes, depths, and trading indicators is denoted by ![]() and h is the number of periods (measured in “order event time”).
and h is the number of periods (measured in “order event time”).
Note that the impulse responses do not need to be orthogonalized as contemporaneous relationships between quotes and depths are captured by construction of the shock vector. Moreover, our data are based on the arrival time of orders avoiding time aggregation as another source of mutual dependence in high-frequency order book data. The impulse-response function according to Equation (6.4) can be written as
(6.5) ![]()
where
Given the consistent estimator ![]() for
for ![]() in (6.3)
we have
in (6.3)
we have
![]()
Lütkepohl (1990) shows that the asymptotic distribution of the impulse-response function is given by
(6.6) ![]()
where ![]() . This expression can be explicitly written as
. This expression can be explicitly written as
(6.7) 
The permanent impact of limit order can be deduced from Ganger's representation of the cointegrated VAR as
where
6.5 MARKET IMPACT AT NASDAQ
We model the best quotes and market depths up to the third level. The computational burden is reduced by separately estimating the model for each of the 21 trading days. The market impact is then computed as the monthly average of individual (daily) impulse responses. Likewise, confidence intervals are computed based on daily averages. For the sake of brevity we refrain from presenting all individual results for the ten stocks. We rather illustrate representative evidence based on Warner Chilcott plc (ticker symbol WCRX) using a cointegrated VAR(10) model. The results for the remaining stocks are provided in a web appendix on http://amor.cms.hu-berlin.de/∼huangrui/project/order_impact_nasdaq/.
Figure 6.5 depicts the market impact of buy and sell limit orders posted at the best quotes as shown in Scenario 1 in Section 6.4.2.6 The impact starts at zero since such a limit order does not directly change quotes. As expected, both ask and bid quotes significantly rise (decline) after the arrival of a buy (sell) limit order. In the long run, both quotes converge to a permanent level at which the information content of the incoming limit order is completely incorporated. We observe that the long-run price change is approximately 0.3 basis points. In the short run, ask and bid quotes adjust in an asymmetric way, where bid (ask) quotes tend to react more quickly than ask (bid) quotes after the arrival of a buy (sell) limit order. This adjustment induces a one-sided and temporary decrease of the bid-ask spread.
Figure 6.5 Changes of ask and bid quotes induced by buy/sell limit orders placed at the market (level one) with a size equal to half of the depth on the first level. The marked number on the vertical axes indicates the magnitude of the permanent impact. The dashed lines indicate the corresponding 95 % confidence intervals. Trading of WCRX at NASDAQ in October 2010. LO: limit order.
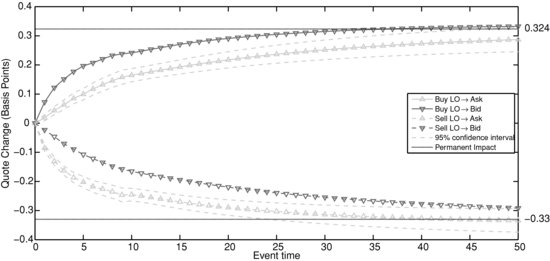
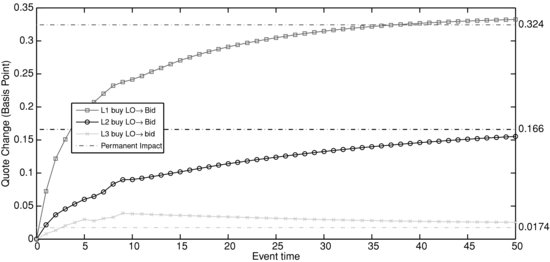
Figure 6.6 Changes of bid quotes induced by buy limit orders placed at the market (level one) and behind the market (levels two and three). The order size equals half of that at the best bid. The initial order book equals the corresponding monthly average shown in Table 6.4. The marked number on the vertical axes indicates the magnitude of the permanent impact. Trading of WCRX at NASDAQ in October 2010. L1: level one; L2: level two; L3: level three; LO: limit order.
The significant permanent impact induced by an incoming limit order indicates that it contributes to price discovery. Thus, market participants perceive that limit orders carry private information, which is in contrast to the common assumption in theoretical literature that informed traders only take liquidity but do not provide it. On the other hand, it is supported by the experiment by Bloomfield et al. (2005) showing that informed traders use order strategies involving both market orders and limit orders optimally to capitalize their informational advantage.
To explore the role of the order's position in the book, Figure 6.6 depicts the impact on the bid quote induced by a buy limit order placed at the market (level one) and behind the market (levels two and three). We observe that the magnitude and speed of the quote reaction are negatively correlated with the order's distance from the spread. Specifically, for orders posted deeper than the third level in the order book, virtually no market impacts can be identified.
Figure 6.7 (left) Changes of quotes induced by buy limit orders placed inside of the spread with a size equal to the depth at the bid. (right) Changes of bid quote induced by buy limit orders placed inside the spread with different sizes. The initial order book equals the corresponding monthly average shown in Table 6.4. Small size: depth at the bid. Mid size: 7 times the depth at the bid. Big size: 15 times the depth at the bid. Trading of WCRX at NASDAQ in October 2010. LO: limit order.
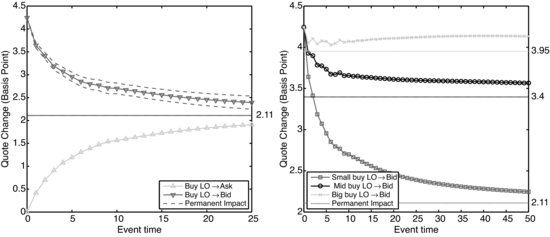
Limit orders placed inside the spread perturb the order book dynamics in a more complex way, as shown in Scenario 2 in Section 6.4.2. They directly improve the ask or bid, resulting in an immediate narrowing of the spread and a shift of one side of the order book. Hence, the system seeks the new equilibrium on a path recovering from an immediate quote change and a simultaneous rebalancing of liquidity. Figure 6.7 shows the reactions of bid and ask quotes induced by an aggressive buy limit order. Given our setting, a buy limit order induces a 4.3 basis point increase of the bid quote (corresponding to approximately one cent). However, the long-run price change is just 2.11 basis points. The immediate quote reversal is induced either by sell trades picking up the volume or by cancellations on the bid side. Likewise, the ask quote shifts upward. We hence observe an asymmetric rebalancing of quotes and a corresponding rewidening of the spread.
The right plot of Figure 6.7 shows how the size of incoming aggressive limit orders affects quote reactions. In the case of a comparably small order, the posted volume is likely to be quickly picked up or cancelled, shifting back the bid quote. In contrast, large volumes over-bid the prevailing quote, causing a significant long-run impact. This confirms findings by Hautsch and Huang (2012) for Euronext Amsterdam and shows that aggressive limit orders with large order sizes carry information and serve as pricing signals.
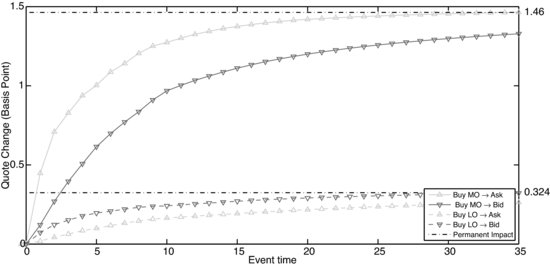
Figure 6.8 compares the market impact induced by a buy market order and a similar buy limit order posted at the bid. We observe that both bid and ask quotes sharply increase after the arrival of a buy market order. The permanent shift of quotes induced by a market order is approximately 4 times greater than that by an incoming limit order. This finding supports theoretical predictions by Ro![]() u (2010). Moreover, in the case of a market order, the ask reacts more quickly than the bid. Hence, we observe an asymmetric adjustment of the two sides of the market, resulting in a temporary widening of spreads.
u (2010). Moreover, in the case of a market order, the ask reacts more quickly than the bid. Hence, we observe an asymmetric adjustment of the two sides of the market, resulting in a temporary widening of spreads.
Figure 6.8 Changes of ask and bid quotes induced by a buy market order and a buy limit order of similar size placed at the market. The order size is half of the depth at the best bid. The initial order book equals the corresponding monthly average shown in Table 6.4. Trading of WCRX at NASDAQ in October 2010. LO: limit order; MO: market order.
Since the market impact of limit orders depends not only on the market microstructure but also on the characteristics of the individual stock, an ultimate comparison of estimated market impacts on NASDAQ with those on Euronext (see Hautsch and Huang, 2012) is rather difficult. Nevertheless, we do find a significant difference when comparing the market impact of trades to that of limit orders. While on Euronext Hautsch and Huang (2012) find robust evidence for the market impact of trades trading at best quotes being approximately four times the market impact of a limit order of similar size, this does not necessarily hold for all stocks at NASDAQ, such as, for example, GOOG, STRA, and UTHR. We explain this finding by the existence of hidden liquidity inside bid-ask spreads, as shown in Table 6.3. When the market participant expects a better price than the best quote to be available inside the spread, he or she would naturally interpret a market order placed at the best quotes as being comparably more aggressive as it walks through the (hidden) price levels. As a consequence, the reaction to an incoming market order becomes stronger. Similarly, an incoming limit order is interpreted as being comparably more passive. Consequently, the market impact of limit orders decreases.
6.6 OPTIMAL ORDER SIZE
The expected price impact induced by a limit order placement is a key parameter in trading decisions. Therefore, in trading strategies, it might be of particular interest explicitly to control the expected market impact. The estimates of the price impact provided in the previous section can be used to back out the size of an order (given its position in the queue), which is necessary to cause a given expected price impact.
In fact, due to the discreteness of prices, the magnitude of a price impact can be interpreted in a probabilistic context. Given a minimum tick size at equity markets like NASDAQ, a practitioner who prefers not to shift the price with probability ![]() must design the order such that the expected price shift, i.e., the magnitude of the impact, is less than
must design the order such that the expected price shift, i.e., the magnitude of the impact, is less than ![]() ticks. This is straightforwardly seen by noticing that when the probability is exactly
ticks. This is straightforwardly seen by noticing that when the probability is exactly ![]() , the minimum level of the market impact is
, the minimum level of the market impact is
In the following we shall illustrate how to compute explicitly the optimal order size subject to the given control level ![]() . For ease of illustration, consider a bid limit order with size m placed at the second best bid. In our setting based on a three-level order book, it is represented as a ten-dimensional shock vector with only one nonzero element at the
ninth row according to the order of variables in Equation (6.1):
. For ease of illustration, consider a bid limit order with size m placed at the second best bid. In our setting based on a three-level order book, it is represented as a ten-dimensional shock vector with only one nonzero element at the
ninth row according to the order of variables in Equation (6.1):
![]()
By Equation (6.8), the corresponding permanent impact on the bid is given by
where c29 is the ninth element in the second row of matrix C in (6.9). Plugging (6.11) into (6.10) and solving for m gives
(6.12) ![]()
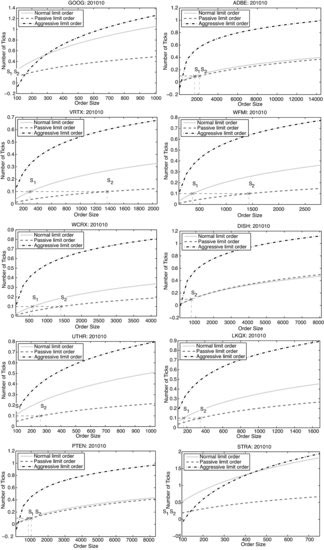
Figure 6.9 depicts the permanent impact on bid prices against order sizes for the ten selected stocks. Each curve in the subplots presents the permanent impact induced by the particular type of bid limit order, i.e., “limit orders placed at the second best bid”, “limit orders placed at the best bid”, and “limit orders placed inside the spread”. The order book is initialized at its average. For the sake of clarity, we change the unit of impacts (on the y axis) from basis points of bid prices to the number of ticks. Furthermore, the control level ![]() is set to 0.9 (corresponding to a permanent market impact of 0.1 ticks), represented by the horizontal dashed line. The intersections S1 and S2 correspond to optimal sizes of limit orders placed on the best bid and second best bid, respectively. For instance, for WCRX and subject to the condition that the market impact is less than 0.1 cent, the optimal size for a limit order placed at the best bid is around 600 shares. Likewise, the optimal size for a limit order placed at the second bid is around 1400 shares.
is set to 0.9 (corresponding to a permanent market impact of 0.1 ticks), represented by the horizontal dashed line. The intersections S1 and S2 correspond to optimal sizes of limit orders placed on the best bid and second best bid, respectively. For instance, for WCRX and subject to the condition that the market impact is less than 0.1 cent, the optimal size for a limit order placed at the best bid is around 600 shares. Likewise, the optimal size for a limit order placed at the second bid is around 1400 shares.
For the stocks GOOG, UTHR, and STRA, we observe that the market impact is so large that the intersection S1 corresponds to an order size of less than 100 shares. We explain this phenomenon in three reasons. First, the depth at the best bid is comparably small. Therefore, a 100 share order is a relatively large order given the available liquidity at the market. Second, as shown in Table 6.1, prices of these stocks are relatively high. Consequently, the relative minimum tick size is comparably small, implying lower costs of front-running strategies. Hence, the high market impact reflects a high probability of being affected by front-running. Third, the average absolute spread in ticks is large. Consequently, there is more room for other market participants to improve their quotes.
Finally, for some stocks, we observe zero or even negative permanent impacts of small orders placed inside the spread, as, for example, GOOG, ADBE, DISH, PTEN, and STRA. This is caused by the effect that small limit orders placed inside the spread are mainly submitted by trading algorithms and tend to be cancelled very quickly if not being executed. In other situations, they might be quickly picked up and trigger other algorithms issuing market orders and/or cancelling existing limit orders on their own side.
Figure 6.9 Permanent impacts against order sizes. The impacts are induced by bid orders. The initial order book is set to its monthly average. The order sizes at the x axis range from 100 shares to 5 times the depth at the best bid in the initial order book. The aggressive (in-the-spread) limit orders improve the bid price by 1 cent. The horizontal dashed line presents a subject control level corresponding to a permanent market impact of 0.1 cents. Trading of ten selected stocks at NASDAQ in October 2010.
6.7 CONCLUSIONS
In this chapter, we provide new empirical evidence on limit order submissions and market impacts in NASDAQ trading. Employing TotalView-ITCH data, we can summarize the following major findings. First, we observe huge numbers of order submissions per day with order sizes clustering around round lots. Second, most of the limit orders are cancelled before being executed. Cancellation times are hardly greater than one second. Third, the volume-weighted execution time of limit orders is substantially greater than its median, indicating that big limit orders face clearly more execution risk. Finally, we observe that only very few market orders tend to “walk through the book”.
We find the short-run and long-run price reactions induced by limit order placements to be consistent with those found by Hautsch and Huang (2012) for data stemming from the Euronext Amsterdam. This implies that these effects are quite stable across markets, despite differences in market settings. In particular, we find that incoming limit orders have significant short-run and long-run effects on ask and bid quotes. Buy (sell) limit orders increase (decrease) both ask and bid quotes while temporarily decreasing bid-ask spreads. Similar but stronger effects are found after arrivals of market orders with temporary increases of bid-ask spreads. For aggressive limit orders posted in the spread we find different effects depending on the order size. While the new quote level caused by a large aggressive order also holds in the long run, this is not true for small orders. Their direct effect on quotes tends to be reversed after a while as the order is picked up. Moreover, it turns out that only limit orders posted up to the second order level have significant market impacts. Orders that are placed even deeper in the book have virtually no effect on the market. Interestingly, we find that small orders placed inside the spread cause zero or even negative long-run impacts. We explain this finding by the existence of trading algorithms, which cancel such orders very quickly if they do not get executed.
Finally, we illustrate how to use the setup to compute optimal sizes of limit orders given a certain intended price impact. This might be helpful in controlling the risk in trading strategies.
ACKNOWLEDGMENT
This research is supported by the Deutsche Forschungsgemeinschaft (DFG) via the Collaborative Research Center 649 `Economic Risk'.
REFERENCES
Bloomfield, R., M. O'Hara and G. Saar (2005) The “Make or Take” Decision in an Electronic Market: Evidence on the Evolution of Liquidity, Journal of Financial Economics 75, 165–199.
Boulatov, A. and T.J. George (2008) Securities Trading when Liquidity Providers are Informed, Working Paper, University of Houston.
Cont, R., A. Kukanov and S. Stoikov (2011) The Price Impact of Order Book Events, Quantitative Finance, forthcoming doi:10.1080/14697688.2010.528444.
Eisler, Z., J. Bouchaud and J. Kockelkoren (2011) The Price Impact of Order Book Events: Market Orders, Limit Orders and Cancellations, Quantitative Finance, forthcoming doi: 10.1080/1469768832010.528444.
Engle, R.F. and A.J. Patton (2004) Impact of trades in an error-correction model of quote prices, Journal of Financial Markets 7, 1–25.
Härdle, W.K., N. Hautsch and A. Mihoci (2009) Modelling and Forecasting Liquidity Supply Using Semiparametric Factor Dynamics, Discussion Paper 2009/18, Collaborative Research Center 649 “Economic Risk”, Humboldt-Universität zu Berlin.
Harris, L. (1997) Order Exposure and Parasitic Traders, Working Paper, Marshall School of Business, University of Southern California.
Hasbrouck, J. and G. Saar (2009) Technology and Liquidity Provision: The Blurring of Traditional Definitions, Journal of Financial Markets 12, 143–172.
Hautsch, N. and R. Huang (2012) The Market Impact of a Limit Order, Journal of Economic Dynamics and Control 36, 502–522.
Huang, R. and T. Polak (2011) LOBSTER: The Limit Order Book Reconstructor, Discussion Paper, School of Business and Economics, Humboldt Universität zu Berlin, http://lobster.wiwi.hu-berlin.de/Lobster/LobsterReport.pdf.
Johansen, S. (1991) Estimation and Hypothesis Testing of Cointegration Vectors in Gaussian Vector Autoregressive Models, Econometrica 59, 1551–1580.
Johansen, S. and K. Juselius (1990) Maximum Likelihood Estimation and Inference on Cointegration – With Applications to the Demand for Money, Oxford Bulletin of Economics and Statistics 52, 169–210.
Lütkepohl, H. (1990) Asymptotic Distributions of Impulse Response Functions and Forecast Error Variance Decompositions of Vector Autoregressive Models, Review of Economics and Statistics 72, 116–125.
Parlour, C. and D. Seppi (2008) Limit Order Markets: A Survey, in Handbook of Financial Intermediation and Banking, A.W.A. Boot and A.V. Thakor (Eds), Elsevier.
Ro![]() u, I. (2010) Liquidity and Information in Order Driven Markets, Working paper HEC Paris, Available at SSRN:http://ssrn.com/abstract=1286193.
u, I. (2010) Liquidity and Information in Order Driven Markets, Working paper HEC Paris, Available at SSRN:http://ssrn.com/abstract=1286193.
Russell, J. and T. Kim (2010) A New Model for Limit Order Book Dynamics, in Volatility and Time Series Econometrics, Essays in Honor of Robert Engle, T. Bollerslev, J. Russell and M. Watson (Eds), Oxford University Press.
1 The limit order book reconstruction and limit order tracking is performed by the software “LOBSTER” (see Huang and Polak, 2011), which can be freely accessed at http://lobster.wiwi.hu-berlin.de.
2 There are indeed numerous brokers providing their clients direct market access (DMA).
3 The corresponding histograms for the other nine stocks are provided on the companion website http://amor.cms.hu-berlin.de/huangrui/project/order_impact_nasdaq/. They confirm that our findings are quite consistent across the market.
4 As a matter of fact, ITCH-TotalView has already reserved time stamps in nanosecond precision in order potentially to increase the time resolution in the near future.
5 For the sake of brevity, the scenarios are only characterized for buy orders. Sell orders are analyzed accordingly.
6 In all figures in this section, the notation “A ![]() B” is interpreted as “the impact on B induced by A”.
B” is interpreted as “the impact on B induced by A”.