1
Algorithmic Trading: Issues and Preliminary Evidence
1.1 INTRODUCTION
In 1971, while the organization of trading on the NYSE had not changed much since its creation in 1792, Fischer Black (1971) was asking whether trading could be automated and whether the specialist's judgement could be replaced by that of a computer (the specialist is a market-maker designated to post bid and ask quotes for stocks listed on the NYSE). Forty years later, market forces have given a positive reponse to these questions.
Computerization of trading in financial markets began in the early 1970s with the introduction of the NYSE's “designated order turnaround” (DOT) system that routed orders electronically to the floor of the NYSE. It was then followed with the development of program trading, the automation of index arbitrage in the 1980s, and the introduction of fully computerized matching engines (e.g., the CAC trading system in France in 1986 or the Electronic Communication Networks in the US in the 1990s). In recent years, this evolution accelerated with traders using computers to implement a wide variety of trading strategies, e.g., market-making, at a very fine time scale (the millisecond).
The growing importance of these “high frequency traders” (HFTs) has raised various questions about the effects of algorithmic trading on financial markets. These questions are hotly debated among practitioners, regulators, and in the media. There is no agreement on the effects of HFTs.1 As an example consider these rather opposite views of the HFTs' role by two Princeton economists, Paul Krugman and Burton Malkiel. Krugman has a rather dim view of HFTs:
High-frequency trading probably degrades the stock market's function, because it's a kind of tax on investors who lack access to those superfast computers – which means that the money Goldman spends on those computers has a negative effect on national wealth. As the great Stanford economist Kenneth Arrow put it in 1973, speculation based on private information imposes a “double social loss”: it uses up resources and undermines markets. (Paul Krugman, “Rewarding Bad Actors”, New York Times, 2 August 2009).
In contrast, for Malkiel, high frequency traders have a more positive function:
In their quest to find trading profits, competition among high-frequency traders also serves to tighten bid-offer spreads, reducing transactions costs for all market participants, both institutional and retail. Rather than harming long-term investors, high-frequency trading reduces spreads, provides price discovery, increases liquidity and makes the market a fairer place to do business. (Burton Malkiel, ``High Frequency Trading is a Natural Part of Trading Evolution'', Financial Times, 14 December 2010).
Concerns have also been voiced that HFTs could manipulate markets to their advantage, exacerbate market volatility and that high frequency trading could be a new source of fragility and systemic risk for the financial system. In particular, some have suggested that HFTs may have been responsible for the flash crash of 6 May 2010.
Not surprisingly, given these concerns and lack of consensus on the exact role of algorithmic traders, debates are now raging about whether actions should be taken to regulate algorithmic trading. A (certainly incomplete) list of questions raised in these debates is as follows (see SEC, 2010, Section IV, or CESR, 2010a and 2010b):
The goal of this report is to discuss some of these issues in the light of recent empirical findings. In Section 1.2, I first define more precisely what algorithmic trading is while in Section 1.3, I describe the close relationships between changes in market structures and the evolution of algorithmic trading. Section 1.4 describes possible costs and benefits of algorithmic trading while Section 1.5 reviews recent empirical findings regarding the effects of algorithmic trading.
Throughout this report I use results from various empirical studies. There are as yet relatively few empirical studies on algorithmic trading (especially high frequency trading) as it is a relatively new phenomenon and data identifying trades by algorithmic traders are very scarce. Consequently, one must be careful not to generalize the results of these studies too hastily: they may be specific to the sample period, the asset class, the identification method used for the trades of algorithmic traders, and the type of algorithmic trading strategy considered in these studies. For this reason, in Table 1.1 (in the Appendix), I give, for each empirical study mentioned in this article, the sample period, the type of asset considered in the study, and whether the study uses direct data on trades by algorithmic traders or has to infer these trades from more aggregated data.
1.2 WHAT IS ALGORITHMIC TRADING?
1.2.1 Definition and typology
Algorithmic trading consists in using computer programs to implement investment and trading strategies.3 The effects of algorithmic trading on market quality are likely to depend on the nature of the trading strategies coded by algorithms rather than the automation of these strategies in itself. It is therefore important to describe in more detail the trading strategies used by algorithmic traders, with the caveat that such a description is difficult since these strategies are not yet well known and understood (see SEC, 2010).
Hasbrouck and Saar (2010) offer a useful classification of algorithmic traders based on the distinction between Agency Algorithms (AA) and Proprietary Algorithms (PA).
Agency Algorithms are used by brokers or investors to rebalance their portfolios at the lowest possible trading costs. Consider, for instance, a mutual fund that wishes to sell a large position in a stock. To mitigate its impact on market prices, the fund's trading desk will typically split the order in “space” (i.e., across trading platforms where the stock is traded) and over time, in which case the trading desk has to specify the speed at which it will execute the order. The fund can also choose to submit a combination of limit orders and market orders, access “lit” markets or dark pools, etc. The fund manager's objective is to minimize its impact on prices relative to a pre-specified benchmark (e.g., the price when the manager made his portfolio rebalancing decision). The optimal trading strategy depends on market conditions (e.g., the prices standing in the different markets, the volatility of the stock, the persistence of price impact, etc.), and the manager's horizon (the deadline by which its order must be executed).4
The implementation of this strategy is increasingly automated: that is, computers solve in real-time for the optimal trading strategy and take the actions that this strategy dictates. The software and algorithms solving these optimization problems are developed by Quants and sold by brokers or software developers to the buy-side.
Proprietary Algorithms are used by banks' proprietary trading desks, hedge funds (e.g., Citadel, Renaissance, D.E. Shaw, SAC, etc.), proprietary trading firms (GETCO, Tradebot, IMC, Optiver, Sun Trading, QuantLab, Tibra, etc.), or even individual traders for roughly two types of activities: (i) electronic market-making and (ii) arbitrage or statistical arbitrage trading.
As traditional dealers, electronic market-makers post bid and ask prices at which they are willing to buy and sell a security and they accommodate transient imbalances due to temporary mismatches in the arrival rates of buy and sell orders from other investors. They make profits by earning the bid-ask spread while limiting their exposure to fluctuations in the value of their positions (“inventory risk”).
In contrast to traditional dealers, electronic market-makers use highly computerized trading strategies to post quotes and to enter or exit their positions in multiple securities at the same time. They also hold relatively small positions that they keep for a very short period of time (e.g., Kirilenko et al., 2010, find that high frequency traders in their study reduce half of their net holdings in about two minutes on average). Moreover, they typically do not carry inventory positions overnight (see Menkveld, 2011). In this way, electronic market-makers achieve smaller intermediation costs and can therefore post more competitive bid-ask spreads than “bricks and mortar” market-makers. For instance, they considerably reduce their exposure to inventory risk by keeping positions for a very short period of time and by acting in multiple securities (which better diversify inventory risk over multiple securities). Moreover, as explained in Section 1.5.2, by reacting more quickly to market events, electronic market-makers better manage their exposure to the risk of being picked off, thereby decreasing the adverse selection cost inherent to the market-making activity (Glosten and Milgrom, 1985).
Arbitrageurs use algorithms to analyze market data (past prices, current quotes, news, etc.) to identify price discrepancies or trading patterns that can be exploited at a profit. For instance, when a security trades in multiple platforms, its ask price on one platform may be smaller than its bid price on another platform (market participants call such an occurrence a “crossed market”). Such an arbitrage opportunity never lasts long and the corresponding arbitrage strategy can be easily automated.5 Triangular arbitrage in currency markets and index arbitrage are other types of trading strategies that can be coded with algorithms.6
Statistical arbitrageurs (“stat arbs”) use trading strategies whose payoffs are more uncertain. For instance, a large buyer may leave footprints in order flow data (trades and price movements). Traders with the computational power to detect these footprints can then forecast short-term future price movements and take speculative positions based on these forecasts. Similarly, imbalances between the arrival rates of buy and sell orders can create transient deviations from fundamental values in illiquid markets. For instance, a streak of buy market orders in a security will tend to push its price up relative to its fundamental value. When this buying pressure stops, the price eventually reverts to its long run value. Hence, one strategy consists in selling securities that experience large price increases and buying securities that experience large price decreases, betting on a reversal of these price movements.7 This type of strategy is automated as it is typically implemented for a large number of securities simultaneously. Moreover, if implemented at the high frequency, it requires acting very quickly on recent price evolutions. The SEC (2010) refers to these strategies as “directional strategies” as they consist in taking a speculative position based on the perception that prices differ from the fundamental value and will tend to revert toward this value.8
Investors using Agency Algorithms and those using Proprietary Algorithms do not operate at the same speed. A very quick reaction to changes in market conditions (for instance a change in the limit order book or a trade in one security) is critical for electronic market-makers and arbitrageurs, as they often attempt to exploit fleeting profit opportunities with a “winner takes it all” flavor. For instance, a brochure from IBM describes algorithmic trading as
The ability to reduce latency (the time it takes to react to changes in the market […] to an absolute minimum. Speed is an advantage […] because usually the first mover gets the best price) (see “Tackling Latency: The Algorithmic Arms Race”, IBM, 2008).
As an example, consider, for instance, an electronic market-maker in a stock and suppose that a large market order arrives, consuming the liquidity available in the limit order book for this stock. As a result the bid-ask spread for the stock widens momentarily (see Biais et al., 1995, for evidence on this type of pattern). This increase creates a profit opportunity for market-makers who can then post new limit orders within the bid-ask spread. First-movers have an advantage as their orders (if aggressively priced) will have time priority for the execution of the next incoming market order.9
As computers can be much quicker than humans in reacting to market events or news, the interval of time between orders submitted by Proprietary Algorithms can be extremely short (e.g., one millisecond). For this reason traders using Proprietary Algorithms (electronic market-makers or statistical arbitrageurs) are often referred to as high frequency traders (HFTs). In contrast, buy-side investors using Agency Algorithms make their decisions at a lower frequency. Hence, HFTs can enter more than thousands of orders per second while traders using Agency Algorithms will enter only a few orders per minute.10
Another difference between electronic market-makers and Agency Algorithms is that the latter are used by brokers who need to execute orders from their clients by a fixed deadline. Hence, traders using Agency Algorithms are more “impatient” and more likely to use market orders (demand market liquidity) than limit orders (provide liquidity). In contrast, electronic market-makers are more likely to use limit orders. For instance, Kirilenko et al. (2010) find that 78 % of HFTs orders in their sample (trades in the E-mini futures S&P500) provide liquidity through limit orders while Broogard (2010) finds that HFTs' in his sample provide (respectively demand) liquidity in 48.65 % (43.64 %) of the trades in which they participate. Jovanovic and Menkveld (2011) study one electronic market-maker in Dutch stock constituents of the Dutch stock index. They find that this market-maker is on the passive side of the transaction in about 78 % (respectively 74 %) of the transactions on which he is involved on Chi-X (respectively Euronext).11
As speed is of paramount importance for HFTs, they seek to reduce latency, i.e., the time it takes for them to (i) receive information from trading venues (on execution of their orders, change in quotes in these markets, etc.), (ii) process this information and make a trading decision, and (iii) send the resulting order to a platform (a new quote, a cancellation, etc.). Latency is in part determined by the HFTs computing power (which explains the massive investment of HFTs in computing technologies) and trading platform technologies.12 Trading platforms have struggled to reduce latencies to a minimum and they now offer co-location services; i.e., they rent rack space so that HFTs can position their servers in close proximity to platform matching engines.
As mentioned in the introduction, there is a concern that some HFTs may use their fast access to the market to engage in market manipulation. For instance, the SEC (2010) describes two types of strategies that could be seen as manipulative (see SEC, 2010, Section IV-B). The first, called by the SEC “order anticipation”, consists for a proprietary trading firm to (i) infer the existence of a large buy or sell order, (ii) trade ahead this order, and (iii) provide liquidity at an advantageous price to the large order. This strategy (a form of front-running) can potentially raise the trading cost for long-term investors seeking to trade large quantities. The second strategy, called by the SEC “momentum ignition strategy” consists in submitting aggressive orders to spark a price movement in the hope that other algorithms will wrongly jump on the bandwagon and amplify the movement.
1.2.2 Scope and profitability
It is difficult to obtain measures of algorithmic traders' share of trading activity. Existing figures are provided mainly for high frequency traders.13 HFTs are present globally and in various asset classes (equities, derivatives, currencies, commodities). There are about 15 major HFTs in US equities markets, including GETCO, Automated Trading Desk (ATD), Tradebot, Optiver, SunTrading, QuantLab, Wolverine, etc. Many of these firms are also active in Europe. Overall the total number of high frequency trading firms seems quite small relative to their share of total trading activity (see below), which suggests that these firms may, for the moment, enjoy significant market power.
A few academic studies have direct data on the trades of high frequency traders in various markets over various periods of time (see Table 1.1 in the Appendix). They confirm the importance of high frequency trading. For instance, using Nasdaq data for 120 stocks, Brogaard (2010) found that 26 HFTs participate in 68.5 % of the dollar volume traded on average and accounted for a larger fraction of the trading volume in large capitalization stocks than in small capitalization stocks. Jovanovic and Menkveld (2011) studied one electronic market-maker in Dutch stock constituents of the Dutch stock index. They found that this market-maker is active in about 35 % (7 %) of all trades on Chi-X (Euronext). Kirilenko et al. (2011) used data on trades in the e-mini S&P500 index (a futures contract on the S&P500 index) and found that HFTs account for 34.22 % of the daily trading volume in this asset (for four days in May 2010). Chaboud et al. (2009) considered the foreign exchange market (euro–dollar, yen–dollar, and euro–yen cross rates) and found that algorithmic trading in this market grew steadily from about zero in 2003 to about 60 % (80 %) of the trading volume for euro–dollar and dollar–yen (euro–yen) in 2007.
There are also very few reliable estimates of the profitability of high frequency traders. Indeed, such estimates require relatively long time series on HFTs' holdings and data on prices at which HFTs enter and exit their position. Few studies have such detailed data (see Table 1.1 on page 38). Brogaard (2010) estimated the average annual gross aggregate profits of the 26 HFTs in his sample at $2.8 billions and their annualized Sharpe ratio at 4.5. Kirilenko et al. (2010) found that HFTs' daily aggregate gross profits vary between $700 000 and $5 000 000 in their sample (which covers four days in May 2010). Menkveld (2011) computed the gross profit of one electronic market-maker active on Chi-X and Euronext in Dutch stock. He estimated the gross profit per trade of this trader to be €0.88 and its annualized Sharpe ratio to be 9.35. Interestingly, he also shows that this Sharpe ratio is much higher in large stocks than in small stocks, which is consistent with the more active presence of HFTs in large capitalization stocks.
1.3 MARKET STRUCTURE AND ALGORITHMIC TRADING
The growth of algorithmic trading in the last twenty years is closely related to technological and regulatory changes in the organization of securities markets. On the one hand, it is a consequence of market fragmentation due to the entry of new electronic trading platforms in the market for trading services. On the other hand, algorithmic trading has induced changes in the business models used by these platforms.
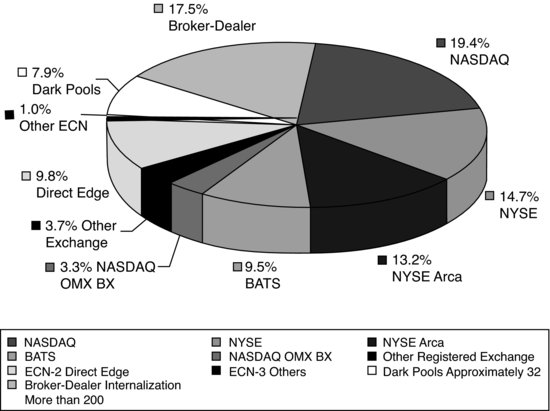
Technological advances have considerably reduced the cost of developing and operating trading platforms in securities markets. This cost reduction triggered the entry of new, fully computerized, trading platforms (Island, Archipelago, etc.), known as Electronic Communication Networks (ECNs), in the early 1990s in US equities. This evolution accelerated in recent years with a new wave of entry (with the arrivals of platforms such as BATS or Direct Edge), resulting in a high fragmentation of trading so that, in 2009, NYSE and Nasdaq had only a 27.9 % and 22.7 % market share in their listed stocks (see Figure 1.1).14
Figure 1.1 Market Shares of Exchanges, ECNs, Dark Pools, and Broker-Dealers (internalization) circa 2010 in US equity markets.
Source: (SEC, 2010)
This proliferation of new trading platforms was facilitated by the implementation of a new set of regulations, known as RegNMS, in 2006 for US equity markets. Indeed, RegNMS leveled the playing field between new trading platforms and incumbent exchanges by providing a common regulatory framework for trade execution. In particular, the so-called “order protection rule” (also known as the “no trade-through rule”) requires market orders to be directed to the platform posting the best price at any point in time. Hence limit order traders in a platform know that they will have price priority if they post aggressive orders. This makes entry of new trading platforms easier, as liquidity suppliers in this platform have a high execution probability if they undercut the quotes posted in more established markets (see Foucault and Menkveld, 2008).
The same evolution has been observed in European equities markets after the implementation of MiFID in 2007. By suppressing the so-called “order concentration rule”, MiFID removed a key barrier to the entry of new trading platforms.15 These platforms (called multilateral trading facilities, MTFs) include Chi-X, BATS Europe, Turquoise, etc., and they often use the same business model as ECNs in the US. They quickly gained a significant market share. As of May 2011, the three most active MTFs, Chi-X, BATS Europe, and Turquoise, have a daily market share in stock constituents of the FTSE index of 27.5 %, 7.4 %, and 5.2 %, respectively.16
This environment is favorable to algorithmic trading for several reasons. Firstly, it is easier for computers to interact with other computers. Hence, it is a natural step for investors to start generating their orders using computers when the market itself is a network of computers. Secondly, the duty of best execution and the order protection rule in the US require brokers to execute their clients' orders at the best possible price. Identifying this price takes time when the same security trades in multiple trading venues. To solve this problem and economize on search costs, brokers have an incentive to use “smart routing technologies”, which are part of algorithmic trading suites provided by brokers to their clients.
Thirdly, the multiplicity of trading venues for the same security creates profit opportunities for traders who can swiftly move across trading venues. Indeed, as explained previously, this situation creates the possibility of arbitrage opportunities. Moreover, it raises the possibility of transient mismatches in the direction of order flows across platforms (especially if some investors operating on these platforms are locked in one platform).17 For instance, suppose that a sell order imbalance on Euronext pushes the price downward on this platform while at the same time a buy order imbalance pushes the price upward on Chi-X. A dealer operating on both platforms can take advantage of these opposite price pressures by buying the stock on Euronext and reselling it at a higher price on Chi-X. Instead of solving transient mismatches between buy and sell orders over time, the dealer does it in across trading venues at a given point in time.
Algorithmic trading is therefore a natural consequence of changes in the organization of securities markets and it is fair to say that “algorithmic markets” pre-date algorithmic traders. However, in turn the need to attract algorithmic traders has served as a catalyst for changes in the organization of trading platforms. New electronic markets are often organized as limit order markets. Attracting limit orders is a prerequisite to generate trades on these platforms since trades happen when a market order hits a limit order. As explained previously, electronic market-makers can often achieve smaller cost of liquidity provision than traditional liquidity providers. Thus, attracting these traders is a way to display tighter bid-ask spreads for trading platforms and therefore a way for them to build up their market share. Menkveld (2011) offers an interesting case study illustrating this point. He finds that the entry of a new electronic market-maker on Chi-X in August 2007 coincides with a sharp drop in bid-ask spreads on this platform and a large jump (from 1–2 % to more than 10 %) in its market share.
As a result, trading platforms have strived to attract electronic market-makers and more generally high frequency traders by reducing their latency (as HFTs have a high demand for low latencies; see previous section) and by offering so-called “liquidity rebates” to limit order traders; i.e., each time a limit order executes, trading platforms often rebate, to the investor holding this limit order, a fraction of the fee charged to the market order triggering the transaction. This rebate contributes to the P&L of electronic market-makers and incentivizes them to post more aggressive limit orders to earn the rebate (see Foucault et al., 2011, and Colliard and Foucault, 2011, for theoretical analyses of these rebates).18
Algorithmic trading has also increased the demand for very quick access to market data. For instance, smart routers need real time access to quotes posted in various trading venues to allocate orders optimally among platforms. Moreover, data on last trade prices and volume (the “ticker tape”) are a useful input to reassess in real time asset values. For instance, an increase in the price of a futures index signals an increase in the value of some or all stock constituents of the index. This information can then be used by HFTs to buy these stocks before other market participants notice the change in the futures index price (see Cespa and Foucault, 2011a and 2011b for a theoretical analysis of the value of ticker tape information). The informational value of the ticker tape creates a demand for ultra quick access to market data to which exchanges have responded by supplying direct access to their individual datafeed and co-location services (see previous section).19
Another consequence of algorithmic trading is the huge increase in messages traffic (i.e., various types of orders) on trading platforms (see Angel et al., 2010, Hasbrouck and Saar, 2010, or Hendershott et al., 2011). Indeed, some algorithmic trading strategies require making a decision (a quote update, a trade, a cancellation, etc.) each time an event happens in the market (e.g., an option market-maker may want to update his bid and ask prices each time there is an update in the price of the asset underlying the option). For instance, Hasbrouck and Saar (2010) document periods with very intense activity in terms of submission of orders and cancellations (e.g., more than one thousand messages in a couple of seconds). This evolution has obliged trading platforms to increase their capacity to process a large number of orders in a very short period of time and raises the possibility of bottleneck effects (“quote stuffing”) induced simply by the sheer amount of messages generated by traders reacting to the same event.
1.4 COSTS AND BENEFITS OF ALGORITHMIC TRADING
1.4.1 Algorithmic trading reduces search costs
Trading in financial markets is in part a search problem (Angel et al., 2010): buyers and sellers search for each other and the market is liquid if they can complete their trades quickly at small cost. The nature of this search problem depends on market structure. For instance, in “over the counter” (OTC) markets, quotes and trades are not centralized in a single market place (a trading floor or a computer memory). Brokers search for good execution prices by contacting dealers sequentially until they find an acceptable price. The search cost in this case involves the opportunity cost of time for the broker. Brokers face a trade-off between this cost and taking more time to obtain a better price.
In many other markets, quotes are posted in limit order books displayed on-line to market participants. Yet, even in this case, traders face a search problem. For instance, as mentioned previously, when the same security trades in multiple limit order books, traders must consolidate the quotes posted in the different trading platforms to identify the best routing strategy. The search cost in this case comprises the cost of collecting and processing the information on the quotes posted in different trading venues. Traders can also expedite the search process by trading at standing quotes, but in this case their trade will move prices by a large amount if the limit order book is thin. To reduce this cost of immediacy, traders can split their order in space or over time, which is another way to search for a counterpart.
Algorithmic trading helps to reduce search costs for investors. For instance, as explained previously, smart routing technologies automatically consolidate quotes posted in different markets and determine the optimal routing decision given these quotes. In addition, these technologies can automatically determine how to split a large market order optimally over time. As a result, total trading costs borne by long-term investors (institutional investors and retail investors) should decrease as brokers increasingly use algorithmic trading. This proposition is difficult to test as it requires data on both brokerage fees and the total cost associated with the execution of a single order. As orders are increasingly split, measures of trading costs based on trade and quote data (e.g., time-weighted average bid-ask spreads) may overestimate or underestimate the true cost of trading, especially for institutional investors.
There is also an indirect effect. As the cost of searching for the best price decreases, competition among trading platforms and liquidity suppliers operating on these platforms increases as it becomes easier for traders to compare prices across platforms. This effect should also contribute to a decline in both explicit and implicit trading costs for long-term investors. Foucault and Menkveld (2008) provide direct evidence on this point. They consider the entry of a new trading platform for Dutch stocks, EuroSETS, in 2004. This trading platform was owned by the London Stock Exchange and its goal was to make inroads into the market share of the then incumbent market, Euronext-Amsterdam. At this time, the European market was not yet very fragmented and accordingly smart routing technologies were not very developed. Foucault and Menkveld (2008) use their data to build a proxy for the fraction of Dutch brokers using smart routing technologies (or behaving as smart routers would do) at the time of their study. They then analyze the effect of this fraction on the competitiveness of the quotes posted in EuroSETS and the contribution of its limit order book to consolidated market liquidity (i.e., the consolidated limit order book for each stock). In line with the hypothesis that smart routing technologies foster competition among liquidity providers, they find that quotes in EuroSETS were relatively more competitive in stocks for which the fraction of smart routers was higher.20
Duffie (2010) demonstrates that the price impact of supply and demand shocks is more persistent when new capital responds slowly to these shocks. He notes that this effect manifests itself at various time scales, including the high frequency. For instance, Duffie (2010, p. 1237) observes that:
The arrival of new capital to an investment opportunity can be delayed by fractions of a second in some markets, for example an electronic limit-order-book market for equities, or by months in other markets […].
Traders do not instantaneously react to a change in the state of the market because obtaining, processing, and acting upon new information takes time. As explained previously, algorithmic traders refer to this delay as “latency” (see Hasbrouck and Saar, 2010). For human traders, reducing latency (i.e., monitoring the market more intensively) is costly as it requires attention, and traders must allocate their limited attention among multiple tasks (e.g., trading in multiple securities). As argued by Biais et al. (2010), algorithmic trading considerably relaxes the cost of attention and expands traders' cognitive capacities.
Hence, one benefit of algorithmic trading is to enable liquidity suppliers (e.g., electronic market-makers) to respond more quickly to price pressures due to sudden order imbalances between the flows of buy and sell market orders. Foucault et al. (2011) show that this feature can considerably accelerate the rate at which trading takes place in line with the explosion in trading frequency that has been observed in recent years (see Chordia et al., 2010).
One implication is that high frequency traders should frequently set the best bid and ask quotes as they reinject liquidity more quickly than other investors after a transient decrease in liquidity. Empirical findings indicate that this is the case. For instance, Brogaard (2010) found that the high frequency traders in his sample are active at the best quotes 65 % of the time (tied with other investors or alone).
1.4.2 Algorithmic trading has an ambiguous effect on adverse selection costs
As explained in the previous section, algorithmic trading enables traders to increase their monitoring capacity and to react quickly to market events that create profit opportunities. In particular, investors can better monitor the flow of information relevant to value a security. For instance, for listed firms, this information includes news about the firm's prospects (macroeconomic information, firm-specific information, information on the firm's competitors, etc.). It also includes trade-related information such as transaction prices and quote updates in securities with payoffs correlated with the stock (e.g., stock prices of competitors, index futures prices, prices of derivatives written on the stock, etc.).
Traders with quick access to information can exploit it by “picking off” stale limit orders, i.e., limit orders whose prices do not yet reflect the new information regarding a security. This behavior exposes those submitting limit orders to a picking off risk (a form of adverse selection).21 In anticipation of this risk, traders posting limit orders bid more conservatively, which reduces market liquidity (see Copeland and Galai, 1983, Foucault, 1999, or Foucault et al., 2003, for theoretical analyses of this effect). Thus, if algorithmic trading is mainly used to pick off stale limit orders, it should have a negative effect on market liquidity.
However, traders submitting limit orders (e.g., electronic market-makers) can also use monitoring technologies to react fast to new information, by cancelling their stale limit orders and submitting new limit orders posted at prices that reflect the new information. In this case, algorithmic trading reduces liquidity suppliers' exposure to the risk of being picked off and should therefore contribute to tighter bid-ask spreads. This is another reason for which, as mentioned in the previous section, algorithmic traders may frequently set the best bid and ask quotes.
Note, however, that if some limit order traders become faster in canceling their limit orders when news arrive then the exposure of the limit orders submitted by slow traders to the risk of being picked off becomes higher. Indeed, the slow traders are more likely to be first in line to sell an asset when its value is moving up and to buy it when its value is moving down. This form of winner's curse can lead slow limit order traders to supply liquidity at less attractive terms in the first place (see Cespa and Foucault, 2011b).
The net effect of algorithmic trading on limit orders' exposure to the risk of being picked off is therefore unclear. Ultimately, it depends on specialization choices of algorithmic traders (market-making versus event-based trading strategies) and their investment in monitoring technologies (see Foucault et al., 2003, for a model in which the investment in monitoring is endogenous). As we shall see in more detail in Section 1.6, the jury is still out on whether algorithmic trading enhances or alleviates adverse selection.22
1.4.3 Algorithmic trading and price discovery
A key function of securities markets is to discover asset fundamental values. Price discovery is more efficient if asset prices deviate less from fundamental values. Measuring the quality of price discovery is difficult as fundamental values are not observed. However, one can consider the speed at which arbitrage opportunities disappear, the speed at which asset prices reflect new information, or the speed at which price pressures induced by transient order imbalances disappear as measures of the quality of the price discovery process.
As explained previously, algorithmic trading accelerates the speed at which traders can detect and exploit price discrepancies between related securities. Moreover, it considerably leverages traders' ability to scan the market for public information and trade on this information if it is not yet incorporated into prices. These observations suggest a positive effect of algorithmic trading on price discovery.
Another benefit of algorithmic trading, untested to my knowledge, is that the duration of price pressures induced by transient order imbalances should be smaller with the advent of algorithmic trading. Chordia et al. (2005) show that, conditional on order imbalance, returns are negatively correlated over intervals of up to thirty minutes for stocks listed on the NYSE, using data from 1996, 1999, and 2002. The reason is that an excess of, say, buy orders pushes prices up relative to fundamental values. This increase attracts sell orders from liquidity suppliers (market-makers, arbitrageurs, etc.) as the latter become aware of the price pressure. These sell orders offset the initial price pressure and contribute to a reversal of prices to their initial value.
Chordia et al. (2005) show that the predictability of stock returns (using past returns as predictors) disappears after no more than 30 minutes. They interpret this as evidence that traders become aware of order imbalances and undertake countervailing trades in no more than 30 minutes. Algorithmic trading should increase the speed at which investors can become aware of price pressures and offset these pressures, bringing back prices to their fundamental levels. It would be interesting to test this conjecture by replicating the Chordia et al. (2005) study with more recent data and check whether the negative autocorrelation of stock returns vanishes more quickly in recent years.
One can also develop a case for high frequency trading hindering price discovery. As high frequency traders take a position for very short periods of time, they may focus on forecasting very short-term price movements rather than long-term price movements. Froot et al. (1992) demonstrate that short-term traders may acquire information unrelated to asset true values. Moreover, Vives (1995) found that short-term investors can impair informational efficiency.23
Another problem is that high frequency traders often use trade-related information; i.e., they trade on data generated by the trading process itself: order flow, prices, volume, duration between trades, etc. There is no doubt that these data can be useful to forecast asset values, as implied by the literature on trading in the presence of asymmetric information (e.g., Grossman and Stiglitz, 1980). However, ultimately, these data are informative because they reflect more primitive signals acquired by other investors (portfolio managers, hedge funds, etc.). High frequency traders free ride on the acquisition of information by these investors, which may reduce investors' incentives to acquire information in the first place.24 If this is the case, the overall informativeness of securities markets may have decreased with the proliferation of high frequency traders.
Last, by trading quickly on news, high frequency traders take the risk of trading on inaccurate information. In this case, their trades could inject noise in the price system rather than making it more efficient, at least at very high frequency. The following anecdote illustrates this point, in a rather extreme way. On Monday 8, 2008, the stock price of United Airlines dropped to $3 a share from nearly $12.80 in about fifteen minutes. Then the price bounced back at $10.60 at the end of the Tuesday session. The cause of these swings was an old article about United Airlines' 2002 bankruptcy court filing that mistakenly appeared on 8 September 2008 as a seemingly new headline on Google's news service. Many commentators pointed out that high frequency trading could be responsible for the wave of sell orders triggering the price decline.25
1.4.4 Welfare effects
Trading is often portrayed as a zero sum gain where trading profits by informed participants just offset trading losses for uninformed market participants. The reality is probably more complex as market participants can also achieve a better allocation of risk by trading together. Hence there are gains from trade. One can then ask two questions: (i) the gains from trade being fixed, is algorithmic trading a way to appropriate a larger fraction of these gains and (ii) does algorithmic trading reduce or increase total gains from trade? For instance, Stoll (2000, p. 1482) points out that liquidity provision, like other business activities, consumes
real economic resources – labor and capital – to route orders, to execute trades, and to clear and settle trades.
If algorithmic trading results in a more efficient use of these resources, it reduces the cost of liquidity provision and thereby it increases gains from trade. Biais et al. (2010) also show that algorithmic trading helps to reallocate the asset faster from investors with relatively low valuations for holding the security to investors with relatively high valuations.
Jovanovic and Menkveld (2011) argue that another way in which high frequency trading could increase realized gains from trade is by reducing adverse selection. It is well known that asymmetric information between trading partners lowers the likelihood that mutually profitable deals will take place. An extreme case occurs when informational asymmetries are so large that the market breaks down and no one trades. As discussed previously, algorithmic trading can reduce traders' exposure to adverse selection by enabling them to update their quotes more quickly in case of information events. Thus, it can alleviate informational asymmetries and increase the chance that mutually profitable trades will happen. In this case, Jovanovic and Menkveld (2011) show that algorithmic trading can increase the size of expected gains from trade.
They also uncover a darker side of high frequency trading. Indeed, it might be used by traders to pick off stale quotes by slow traders, as explained in Section 1.4.2. In this case, instead of alleviating informational asymmetries, high frequency trading exacerbates them. If this scenario holds true then high frequency trading has a negative effect on investors' welfare. Testing this proposition is difficult as measuring investors' welfare is difficult.
Biais et al. (2011) point to another problem: investment in high frequency trading technologies might be excessive from a welfare point of view. In their model, algorithmic trading brings both benefits and costs in terms of welfare. On the one hand, it increases the likelihood that investors can complete their trades, other things being equal. On the other hand, it increases the exposure of ‘slow traders’ to adverse selection. Hence, algorithmic trading raises trading costs for slow traders and, as a result, they may exit the market. This decline in market participation impairs welfare since it implies that some investors are unable to carry out trades that are mutually profitable (e.g., hedging trades). The socially optimal level of algorithmic trading balances this benefit and this cost of algorithmic trading.
Biais et al. (2011) show that an individual investor's investment decision in algorithmic trading leads to a level of high frequency trading that is in general too high relative to the socially optimal level. Indeed, in making their investment decision in fast trading technologies, investors have no incentive to internalize the negative externality they exert on slow investors. Moreover, in the fear of being sidelined if they remain slow, investors may all decide to be fast, even though they would be better off all staying slow (a form of destructive arms race). These two effects lead in general to an overinvestment in high frequency trading technologies, relative to what would be socially optimal, in the Biais et al. (2011) model.26
1.4.5 Algorithmic trading as a source of risk
As explained previously, HFTs carry their inventory positions for a very short period of time. Hence, the absorption of large persistent order imbalances between buy and sell orders of long-term investors arriving at different points in time requires either the intervention of a “chain” of high frequency traders or, at some point, the intervention of more traditional market-makers willing to carry a risky position for a sufficiently long time (e.g., overnight). However, these intermediaries now make less profit in normal times as they face competition from faster intermediaries and are more exposed to adverse selection (see Section 1.4.2). Hence, they are less able to recoup the losses they experience in highly volatile periods with profits in normal times. This reasoning suggests that some traditional market-makers (or providers of liquidity) may have been crowded out of the market. This “crowding out effect” could be a source of fragility as it reduces the overall risk bearing capacity of the market-making sector. This is especially true if one assumes that traditional market-makers are more willing or able than HFTs to “lean against the winds” by providing liquidity even when markets are highly volatile.27
Speed of trading also means that human errors (e.g., “fat finger errors” that consist in pressing the wrong key on a keyboard) or ill-conceived algorithms are more difficult to identify and correct before they affect the market.28 The flash crash of May 6, 2010 provides a vivid illustration of this risk. According to CFTC–SEC (2010), this crash finds its origin in one very large sell order in the E-mini S&P500 index. Specifically, one fund decided to sell 75 000 E-mini futures contracts on the S&P500 index traded on the CME (the largest change in a trader's position since January 2010 according to CFTC–SEC, 2010). The trader in charge of executing this order decided to split the order to mitigate his impact on prices, using a “constant participation rate” strategy. This strategy consists in splitting an order in such a way that the “child orders” represent a fixed fraction of the total trading volume over a given period of time, say a minute.29 Hence, it calls for larger trades when volume increases. This strategy becomes problematic when the parent order is relatively large (as the 75 000 contracts order was) since child orders themselves can give a false impression of large volume, leading to an acceleration of the speed at which the order gets executed. In such a situation, a large sell order can potentially trigger a large price drop as it quickly exhausts the liquidity available in the market (by hitting lower and lower quotes), unless traders make their strategy contingent on the execution price they receive (by trading less as the price impact increases). This snowballing effect is apparently what triggered the flash crash (although the exact cause is still much discussed), proving a sharp illustration of how a badly conceived algorithm can destabilize the market.30
Algorithmic trading also makes trading platforms and market participants more exposed to a failure of their trading systems. In recent years, several trading platforms have experienced outages, as the huge amount of traffic generated by algorithmic trading often pushes trading systems to their limits in terms of absorption of the flow of orders. For instance, on 24 May 2011, Chi-X stopped for half an hour while in February 2011 the London Stock Exchange stopped for four hours. Such outages are problematic since they create uncertainty for traders operating on multiple platforms about whether they will be able to carry out the various legs of their hedging or arbitrage strategies. They also suppress one or multiple sources of ticker tape information for market participants since prices on platforms that are shut down are no longer visible.
Algorithmic trading also amplifies the risk that such market disruptions propagate very quickly to other asset classes. Indeed, an electronic market-maker's strategy in one security often relies on the information conveyed by the prices of other securities, especially those, such as index futures, that contain information for a wide array of securities. Per se, quick access to ticker tape information is beneficial to liquidity as it reduces uncertainty and inventory risk for liquidity providers. However, it also makes markets more interconnected, which is a source of fragility. Indeed, a drop in liquidity in one security makes its price less accurate. Thus, it raises the uncertainty for traders relying on this price to provide liquidity in other securities, which can induce them to curtail or even stop their provision of liquidity (see Cespa and Foucault, 2011b, for a theoretical analysis of this propagation mechanism and its implications for market liquidity).
In line with this propagation mechanism, the CFTC–SEC report on the flash crash has emphasized the role that uncertainty on the cause (transient price pressures or changes in fundamentals) of the large price movements in the E-mini futures on the S&P500 played in the evaporation of liquidity during the flash crash. The authors of this report write (on page 39):
Market makers that track the prices of securities that are underlying components of an ETF are more likely to pause their trading if there are price-driven or data-driven integrity questions about those prices. Moreover extreme volatility in component stocks makes it very difficult to accurately value an ETF in real-time. When this happens, market participants who would otherwise provide liquidity for such ETFs may widen their quotes or stop providing liquidity […].
1.5 EMPIRICAL EVIDENCE
As discussed in the previous section, algorithmic trading can have both positive and negative effects on market quality (price discovery, market liquidity, participants' welfare, etc.). Ultimately, which effects dominate is an empirical question. In this section, we describe and discuss some empirical findings regarding the effects of algorithmic trading. As algo trading is a relatively recent phenomenon, empirical studies are still scarce and many are still “work in progress”. Consequently, conclusions from these studies should certainly not be seen as definitive but rather as a starting point for future investigations.
1.5.1 Algorithmic trading and market liquidity
The causal effect of algorithmic trading on various measures of market quality is at the heart of many controversies on this practice. However, identifying this causal effect is difficult as the amount of algorithmic trading and measures of market quality (e.g., bid-ask spreads and price impact measures) are likely to be jointly determined by a myriad of variables. As a result, algorithmic trading and measures of market quality may appear correlated (positively or negatively) even though there is no direct effect of algo trading on market quality.
To appreciate this difficulty, consider the evolution of liquidity in European equity markets since the advent of MiFID in 2007. Liquidity declined in 2008 and it is tempting to attribute this decline to the increasing fragmentation of equity trading in Europe and the increase in algorithmic trading over the same period. Yet, there are other first order factors that may have played a role, the credit crunch of 2008 not being the least of course. Hence, a major obstacle in assessing the impact of algorithmic trading is to isolate the contribution of this practice to measures of market quality (e.g., bid-ask spreads), holding other factors constant. This caveat must be kept in mind in interpreting empirical findings regarding algorithmic trading.
To overcome this problem, Hendershott et al. (2011) consider a technological change in the organization of the NYSE that made algorithmic trading easier. As of 2003, the NYSE started disseminating automatically, with a software called “Autoquote”, any change in the best quotes in its listed stocks (before this date, specialists had to update manually new inside quotes in the limit order book). The implementation of Autoquote considerably accelerated the speed at which algorithmic traders receive information on the state of the NYSE limit order book and for this reason it increased the amount of algorithmic trading in the stocks in which Autoquote was introduced.31
Autoquote was phased in gradually. The NYSE first introduced Autoquote for six stocks in January 2003 and then progressively expanded this system to 200 stocks. Eventually Autoquote was implemented for all stocks by May 2003. This staggered introduction of Autoquote enabled Hendershott et al. (2011) to study how liquidity changes for stocks in which Autoquote is introduced while controlling for market-wide factors affecting liquidity using stocks for which Autoquote was not yet implemented. The change in liquidity for the stocks affected by Autoquote could then be confidently ascribed to the increase in algorithmic trading associated with Autoquote.
Hendershott et al. (2011) found that standard measures of market liquidity (the quoted bid-ask spread and the effective bid-ask spread) had improved after the introduction of Autoquote for large capitalization stocks. One exception is the quoted depth (i.e., the number of shares offered at the best quotes), which has decreased for these stocks. However, this decline seems too small to offset the decline in bid-ask spreads and Hendershott et al. (2011) argue that the net effect of algorithmic trading on trading costs is negative for large capitalization stocks. In contrast, they do not find any significant effect of algorithmic trading on market liquidity for stocks with small capitalizations, maybe because algorithmic traders were mainly active in large caps at the time of the Hendershott et al. study or because their tests did not have enough statistical power to detect an effect.
In addition, Hendershott et al. (2011) found that the reduction in bid-ask spread measures is driven by a reduction in the adverse selection component of the spread.32 This result is consistent with the view that algorithmic trading helps traders reduce their exposure to the risk of being picked off (see the previous section). In line with this interpretation, Hendershott et al. (2011) show that the permanent price impact of trades measured using Hasbrouck's (1991) methodology is smaller after the implementation of Autoquote. Moreover, they found that the contribution of trades to the volatility of innovations in stock returns (a measure of the informational content of trades) becomes smaller relative to nontrade related sources of volatility. This finding suggests that after the implementation of Autoquote, liquidity providers more quickly reset their quotes after news arrivals. As a result, quotes better track fundamental values.
They also show that the decrease in the adverse selection component of the bid-ask spread is larger than the reduction in the bid-ask spread itself. Hence liquidity suppliers' expected profit increases after the implementation of Autoquote. This finding may reflect the ability of algorithmic traders to earn superior profits (by managing their exposure better to the risk of being picked off), at least in the short run (i.e., before new algo traders enter to compete away firstly movers' rents).33
It is worth stressing some limitations of Hendershott et al. (2011). Firstly, they note that the technological change considered in their analysis chiefly benefits algorithmic traders submitting limit orders (algorithmic liquidity suppliers). Hence, a conservative interpretation of their findings is that algorithmic liquidity supply (in particular, electronic market-making) has a beneficial effect on market liquidity. However, as discussed in Section 1.2.1, electronic market-making is only one type of strategy used by algorithmic traders and one may wonder whether an increase in, say, automated arbitrage has also a positive effect on liquidity. Secondly, their metrics for liquidity capture trading costs for investors submitting aggressive orders (market orders). They do not study the effect of algorithmic trading on human traders submitting limit orders. As discussed in Section 1.4.4, these traders may have suffered from more intense competition from algorithmic liquidity suppliers (e.g., their execution probabilities could have declined).
Broogaard (2010) also provides evidence that HFTs contribute to market liquidity. He shows that HFTs in his sample follow a price reversal (or “contrarian”) strategy: i.e., they buy stocks whose prices have been declining in the last 10 to 100 seconds and they sell stocks whose prices have been increasing in the last 10 to 100 seconds. Interestingly, they implement this strategy by submitting both limit orders and by hitting limit orders resting in the limit order book. Kirilenko et al. (2010) reach a similar conclusion. HFTs in their sample tend to accumulate positions when prices are dropping and decumulate positions when prices are increasing.
1.5.2 Algorithmic trading and volatility
Identifying the causal effect of algorithmic trading on volatility is challenging as well. Indeed, a positive correlation between these two variables does not mean that algorithmic traders are responsible for higher volatility. Instead, this correlation may simply reflect the fact that the algorithmic traders' participation rate is higher in more volatile stocks (maybe because profit opportunities in these stocks are more frequent). Hence, as for liquidity, empiricists need to devise careful experiments to isolate and measure the effect of algorithmic trading on volatility.
Chaboud et al. (2009) offer an interesting approach to this problem. They consider algorithmic trades and human trades in three currencies: euro–dollar, yen–dollar, and euro–yen, all traded on EBS (an electronic limit order book). Chaboud et al. (2009) find a positive correlation between the daily realized volatility of the currencies analyzed in their study (euro–dollar, dollar–yen, and euro–yen) and the daily amount of algorithmic trading activity in these currencies. However, this correlation may simply reflect the fact that algorithmic trading is more prominent when volatility is high. One factor that determines the volume of algorithmic trading on EBS is the number of trading floors (relative to all trading floors) equipped to trade algorithmically on EBS. This number is unlikely to be affected by the realized volatility of the currencies traded on this platform in a given day since setting up a trading floor for algorithmic trading takes time (more than one day). Hence, variations in this variable over time can be used to identify the causal effect of algorithmic trading on volatility since it affects the volume of algorithmic trading on EBS without being directly affected by volatility.
Interestingly, a regression of the daily realized volatility of these currencies on the fraction of trading floors equipped for algorithmic trading (and other control variables) shows that this fraction has a (weak) negative effect. Hence, “exogenous” variations in algorithmic trading dampen volatility instead of increasing it, as the simple correlation analysis would suggest at first glance.
Other empirical studies reach a similar conclusion with different methods and for different markets. Hasbrouck and Saar (2010) address the simultaneity problem by running a system of regressions in which volatility can influence algorithmic trading and vice versa. They measure volatility over 10 minute intervals for Nasdaq stocks and they use a proxy for the amount of algorithmic trading over the same time intervals as they do not directly observe algorithmic traders' orders. They find a negative effect of algorithmic trading on short-run volatility.
These studies do not describe in detail the mechanisms by which algorithmic traders influence volatility. One possibility is that an increase in short-run volatility in a security signals a transient lack of liquidity in this security (e.g., an increase in the bid-ask spread). Traders' computers interpret this signal as a profit opportunity (prices are temporarily out of line with fundamental values due to a buying or selling pressure) and inject liquidity with limit orders where it is needed. Alternatively, algorithmic traders could act as positive feedback traders: they buy securities after price increases and sell them after price decreases. In this case, they exacerbate price volatility. Hendershott and Riordan (2009) find no evidence in favor of this second scenario. In their data, market orders from algorithmic trading are statistically unrelated to lagged volatility (measured over a fifteen minute interval prior to the algorithmic trader's order arrival).34
1.5.3 Algorithmic trading and price discovery
As explained in Section 1.4.3, HFTs can make prices more informationally efficient. Indeed, their technology gives them the possibility to react more quickly to news or ticker tape information. Consequently, one expects prices to impound new information more quickly in the presence of HFTs. Testing for this possibility requires “pricing errors” to be measured, i.e., the distance between an asset fundamental value and the price at which it trades. As asset fundamental values are unobserved, this test is difficult.
One basic question is whether trades and/or quotes posted by algorithmic traders contain information on asset values. This is a prerequisite for algorithmic traders to have a positive effect on price discovery.
Hendershott and Riordan (2009) are the first to address this question, using data from Deutsche Börse. One interesting feature of their data is that they have information on orders submitted by algorithmic traders and orders submitted by human traders. They can therefore measure the informational content of orders submitted by each category of traders. To this end, they use the Vector Autoregression Approach advocated by Hasbrouck (1991) to measure the permanent impact of aggressive orders (i.e., market orders) submitted by algorithmic traders, on the one hand, and human traders, on the other hand. This approach measures the average change in price after a buy or a sell market order (a trade) over a given period of time after the trade (e.g., 10 trades after the initial trade). This average change is called the permanent impact of trades, which is deemed to capture the change in the evaluation of the asset by market participants. This permanent impact is therefore often used as one measure of the information content of trades. Hendershott and Riordan (2009) find that algorithmic traders' market orders have on average a larger permanent impact than human traders' market orders in their sample (53 bps against 44 bps). Other studies (Hendershott et al., 2011, or Brogaard, 2010) obtain similar findings. Hence, according to these studies, trades by algorithmic traders contain more information than trades by human traders.
Chaboud et al. (2009) consider a different asset class (currencies) and interestingly they obtain quite different results. Using the same methodology as Hendershott and Riordan (2009), they find that a one standard deviation shock for the order size of a trade initiated by a computer has a smaller long-run (30 minutes) impact than the same shock for a trade initiated by a human trader. Hence, in contrast to the results obtained for equity markets, trades initiated by human traders in the currencies considered in Chaboud et al. (2009) seem to contain more information than trades initiated by computers. This finding suggests that the purpose of algorithmic trading in these currencies is not mainly to exploit superior information at the expense of slower traders (e.g., by picking off stale limit orders).
Instead, Chaboud et al. (2009) find evidence consistent with the view that algo trading is used to reduce traders' exposure to the risk of being picked off. Indeed, they find that market orders from human traders move prices much less when their counterpart is a computer than when it is a human. Hence, computers are better than humans at avoiding trades with better informed agents.
Hendershott and Riordan (2009) also study whether quotes (i.e., limit orders) posted by algorithmic traders contain information. To address this question, they build two separate time series: the time series of best bid and ask prices using only the quotes posted by algorithmic traders and the time series of best bid and ask prices using only the quotes posted by human traders. Then they measure the relative contributions of changes in the mid-quotes of each series to the variance of the changes in the (unobserved) fundamental value of the security (using a methodology developed by Hasbrouck, 1995). This contribution can be interpreted as a measure of the contribution of the quotes of each type of trader (computers/humans) to price discovery.35 They find that the contribution of algorithmic traders' quotes (their “information share”) to price discovery is higher than that of human traders. Brogaard (2010) obtained a similar finding for a different sample.
To sum up, empirical findings suggest that algorithmic trading contributes to price discovery in two ways: (i) algorithmic traders' quotes contain information and (ii) algorithmic traders' market orders contain information. Hence, algorithmic traders contribute to price discovery and sometimes more than humans (Hendershott and Riordan, 2009, or Brogaard, 2010).36 Note, however, that if algorithmic traders' market orders contain information, their trades are a source of adverse selection for traders posting limit orders. Hence, although informed market orders contribute to price discovery, they may have a deleterious effect on market liquidity by increasing the cost of trading against better informed investors for liquidity providers.37
There are still many questions that are unanswered. In particular, what is the source of the informational advantage for algorithmic traders? Do they trade on publicly available news not yet impounded into prices or do they simply use ticker tape information, etc.? Moreover, as mentioned at the outset of this section, the effect of algorithmic traders on pricing errors is still an open empirical question.
More efficient prices lead to a better capital allocation in the economy (Hayek, 1945; Dow and Gorton, 1997). However, do we need prices to be right as fast as possible given that capital allocation decisions are made at low frequencies (certainly not at the millisecond)? Moreover, better price discovery has a cost: HFTs' investment in information acquisition and technology consume resources. Does the gain for society of better price discovery due to algorithmic trading offset the cost incurred by market participants to achieve this gain? There are not yet any well-articulated answers to these questions.
1.5.4 Algorithmic trading and market stability
As explained previously, one concern is that algorithmic trading may fragilize financial markets. A first source of fragility is that high frequency traders could stop providing liquidity when markets become excessively turbulent. One way to study this question consists in studying whether algorithmic traders behave differently in periods in which volatility is low (“normal times”) and periods in which volatility is high (“turbulent times”).
Hasbrouck and Saar (2010) and Brogaard (2010) follow this approach to see whether volatility has a negative effect on liquidity provision by algorithmic traders. Hasbrouck and Saar (2010) measure the impact of high frequency trading on measures of market quality (volatility and liquidity) for Nasdaq stocks in October 2007 and June 2008, respectively. Volatility and uncertainty were much higher in June 2008 than in June 2007 due to the subprime crisis. They do not find that high frequency traders curtailed their provision of liquidity in the second period.
Brogaard (2010) consider the effect of earnings announcements on the demand and supply of liquidity by high frequency traders. Earnings announcements are associated with an increase in volatility. Brogaard (2010) find that high frequency traders tend to increase their supply of liquidity (submit more limit orders) and decrease their demand of liquidity (submit fewer market orders) in periods of earnings announcements (periods of high volatility) relative to periods without earnings announcements (periods of low volatility). As also found by Hasbrouck and Saar (2010), this result does not support the view that HFTs stop providing liquidity when volatility increases.
Kirilenko et al. (2010) provide an in-depth empirical analysis of high frequency traders' behavior in the E-mini S&P500 index during the flash crash of 6 May 2010. This is interesting since the crash finds its origin in this market (see Section 1.4.5). Moreover, the flash crash is an event of extreme volatility and instability (e.g., from 1:30 p.m. to 1:45 p.m., the S&P500 E-mini lost about 5 % before bouncing back by the same amount almost as quickly). They compare the behavior of high frequency traders in their sample during the period of the flash crash with their behavior in the two days before the flash crash. These two days serve as a benchmark, representative of “normal times”.
Kirilenko et al. (2010) do not find significant differences in the behavior of high frequency traders on the day of the flash crash and their behavior in the days immediately preceding the crash. High frequency traders' trading strategy depends on past prices. They use a combination of market orders and limit orders. They trade in the direction of recent price changes with market orders and opposite to this direction with limit orders. When they trade with limit orders, HFTs provide liquidity to other market participants and they do not seem to have reduced their supply of liquidity on the day of the flash crash relative to the other days.
However, it is noteworthy that HFTs keep their positions for a very short period of time and they never accumulate large positions (their net aggregate position fluctuates in a band of ±3000 contracts). As a result, although they initially absorbed part of the large sell orders triggering the downward price pressure in the S&P500 E-mini, they also quickly (in a matter of minutes) unwound their positions, passing them to more traditional intermediaries.38 Thus, they did not keep their positions long enough for the selling price pressure not to aggravate. In this sense, although HFTs do not seem to have caused the flash crash or amplified it, Kirilenko et al. (2010) conclude that they did not help to prevent it.
Interestingly, Kirilenko et al. (2010) find that HFTs did not lose money during the flash crash (in fact they seem to have made more profits than on the previous days). In contrast, other intermediaries incurred significant losses. If, in addition, the presence of HFTs makes it more difficult for traditional intermediaries to earn profits in normal time (a conjecture that has not been studied empirically to my knowledge), then some traditional intermediaries could be crowded out of the market, as explained in Section 1.4.5.
One question that has not yet been investigated empirically is whether algorithmic traders played a role in the propagation of the drop in prices and the shortage of liquidity in the E-mini S&P500 index futures to other asset classes, in particular US equities. There are at least two reasons for which one may think that HFTs could have played a role. Firstly, when the price of an index futures becomes low relative to the value of its constituent stocks, arbitrageurs start selling the constituent stocks and buying the index futures. Through this arbitrage activity, the selling pressure in the index futures propagates to the cash market. This propagation is faster when arbitrage is faster, which is the case with algorithmic trading. Note, however, that in this case arbitrage activities should have dampened the selling pressure in the futures market. Secondly, as explained in Section 1.4.5, electronic market-makers rely heavily on prices of other securities to provide liquidity in other securities. A sharp drop in liquidity in a security like an index futures, which is a key source of information, significantly raises the uncertainty on the value of all securities and thereby accelerates the evaporation of liquidity in other securities.
1.6 CONCLUSIONS
As mentioned in the introduction, many have voiced concerns that algorithmic trading could impair market quality. It is fair to say that the early empirical evidence on the effects of algorithmic trading does not offer much support for this view. Indeed, to date, empirical findings suggest that:
Hence, initial evidence supports the view that algorithmic trading makes the market more efficient and more liquid. This should help investors to make better portfolio decisions at lower costs. However, it is not clear whether the conclusions from existing empirical studies are robust since empirical studies regarding the effects of algorithmic trading are still scarce. Hence, one must be careful in not generalizing too quickly the current results about the effects of algorithmic trading: much more research is needed.
Furthermore, there are still many important questions that remain to be investigated. Firstly, we do not know whether algorithmic trading has decreased transaction costs for institutional investors (mutual funds, pension funds, etc.). There are good reasons to believe that this could be the case since algorithms enable buy-side investors to optimize their routing decisions and because electronic market-making seems to have improved liquidity. Yet, there is no systematic empirical study about the impact of algorithmic trading on institutional investors' transaction costs.39
Secondly, we do not know whether algorithmic trading makes markets more fragile or more robust. As explained in Section 1.5.4, Kirilenko et al. (2010) do not find evidence that HFTs contributed to the flash crash but they do point out that HFTs did not help to prevent the crash. More work should be done to evaluate whether algorithmic trading increases or decreases systematic risk.
Lastly, algorithmic trading involves large investments in new technologies. These technologies have some benefits if they reduce transaction costs and if they foster price discovery. However, can we trust the invisible hand to strike the right balance between these benefits and the costs of algorithmic trading technologies? Answering this question requires, among other things, a better understanding of the real effects of having more efficient price discovery at high frequency. Economic theory does not yet provide much guidance on this question.
1.7 APPENDIX
ACKNOWLEDGMENT
The author acknowledges the support of the Europeans Savings Institute (OEE) for this research.
REFERENCES
Angel, J.J., L.E. Harris and C.S. Spatt (2010) Equity Trading in the 21st Century, Working Paper, Carnegie Mellon.
Bertsimas, D. and A.W. Lo (1998) Optimal Control of Execution Costs, Journal of Financial Markets 1, 1–50.
Biais, B., T. Foucault and S. Moinas (2011) Equilibrium High Frequency Trading, Working Paper, Université de Toulouse.
Biais, B., P. Hillion and C. Spatt (1995) An Empirical Analysis of the Limit Order Book and the Order Flow in the Paris Bourse, Journal of Finance 50, 1655–1689.
Biais, B., J. Hombert and P.O. Weill (2010) Trading and Liquidity with Limited Cognition, Working Paper, Toulouse University, IDEI.
Black, F. (1971) Towards an Automated Exchange, Financial Analysts Journal, July–August.
Brogaard, J.A. (2010) High Frequency Trading and Its Impact on Market Quality, Working Paper, Northwestern University.
Cespa, G. and T. Foucault (2011a) Sale of Price Information by Exchanges: Does It Promote Price Discovery?, Working Paper, HEC.
Cespa, G. and T. Foucault (2011b) Learning from Prices, Liquidity Spillovers, and Endogenous Market Segmentation, CEPR Working Paper 8350.
CESR (2010a) Trends, Risks and Vulnerabilities in Financial Markets, Report.
CESR (2010b) Call for Evidence: Micro-Structural Issues of the European Equity Markets.
CFTC & SEC (2010) Commodity and Futures Trading Commission and Securities and Exchange Commission, Findings Regarding the Market Events of May 6, 2010, Report of the Staffs of the CFTC and SEC to the Joint Advisory Committee on Emerging Regulatory Issues (September 30, 2010).
Chaboud, A., B. Chiquoine, E. Hjalmarsson and C. Vega (2009) Rise of the Machines: Algorithmic Trading in the Foreign Exchange Market, Working Paper, FED, New York.
Chordia, T., R. Roll and A. Subrahmanyam (2005) Evidence on the Speed of Convergence to Market Efficiency, Journal of Financial Economics 76, 271–292.
Chordia, T., R. Roll and A. Subrahmanyam (2010) Recent Trends in Trading Activity, Working Paper, Anderson School, UCLA.
Colliard, J.-E. and T. Foucault (2011) Trading Fees and Efficiency in Limit Order Markets, CEPR Discussion Paper Series 8395.
Copeland, T. and D. Galai (1983) Information Effects on the Bid-Ask Spread, Journal of Finance 38, 1457–1469.
Dow, J. and G. Gorton (1997) Stock Market Efficiency and Economic Efficiency: Is There a Connection?, Journal of Finance 52, 1087–1129.
Duffie, D. (2010) Presidential Address: Asset Price Dynamics with Slow Moving Capital, Journal of Finance, 1237–1267.
Foucault, T. (1999) Order Flow Composition and Trading Costs in a Dynamic Limit Order Market, Journal of Financial Markets 2, 99–134.
Foucault, T. and A.J. Menkveld (2008) Competition for Order Flow and Smart Order Routing Systems, Journal of Finance 63, 119–158.
Foucault, T., O. Kadan and E. Kandel (2011) Liquidity Cycles, and Make/Take Fees in Electronic Markets, forthcoming in Journal of Finance.
Foucault, T., A. Roëll and P. Sandas (2003) Market Making with Costly Monitoring: an Analysis of SOES Trading, Review of Financial Studies 16, 345–384.
Froot, K., D.S. Scharfstein and J. Stein (1992) Herd on the Street: Informational Inefficiencies in a Market with Short-Term Speculation, Journal of Finance 47, 1461–1484.
Garvey, R. and F. Wu (2010) Speed, Distance, and Electronic Trading: New Evidence on Why Location Matters, Journal of Financial Markets 13, 367–396.
Glosten, L.R. and P. Milgrom (1985) Bid, Ask, and Transaction Prices in a Specialist Market with Heterogeneously Informed Traders, Journal of Financial Economics 14, 71–100.
Grossman, S. and J. Stiglitz (1980) On the Impossibility of Informationally Efficient Markets, American Economic Review 70, 393–408.
Hasbrouck, J. (1991) Measuring the Information Content of Stock Trades, Journal of Finance 46, 179–207.
Hasbrouck, J. (1995) One Security, Many Markets: Determining the Contribution to Price Discovery, Journal of Finance 50, 1175–1199.
Hasbrouck, J. and G. Saar (2010) Low-Latency Trading, Working Paper, New York University.
Hayek, F. (1945) The Use of Knowledge in Society, American Economic Review 35, 519–530.
Hendershott, T. and R. Riordan (2009) Algorithmic Trading and Information, Working Paper, University of Berkeley.
Hendershott, T., C.M. Jones and A.J. Menkveld (2011) Does Algorithmic Trading Improve Liquidity? Journal of Finance 66, 1–33.
Huberman, G. and W. Stanzl (2005) Optimal Liquidity Trading, Review of Finance 9, 165–200.
Jovanovic, B. and A. Menkveld (2011) Middlemen in Limit Order Markets, Working Paper, VU University Amsterdam.
Khandani, A. and A.W. Lo (2011) What Happened to the Quants in August 2007? Evidence from Factors and Transactions Data, Journal of Financial Markets 14(1), 1–46.
Kirilenko, A.A., A.S. Kyle, M. Samadi and T. Tuzun (2011) The Flash Crash: the Impact of High Frequency Trading on an Electronic Market, Working Paper, University of Maryland.
Kozhan, R. and W.W. Tham (2010) Arbitrage Opportunities: a Blessing or a Curse?, Working Paper, University of Warwick.
Menkveld, A. (2011) High Frequency Trading and the New-Market Makers, Working Paper, VU University, Amsterdam.
SEC (2010) Concept Release on Equity Market Structure, Release 34-61358; File S7-02-10.
Sorkenmaier, A. and M. Wagener (2011) Do We Need a European “National Market System”? Competition, Arbitrage, and Suboptimal Executions, Working Paper, Karlsruhe Institute of Technology.
Stoll, H.R. (2000) Friction, Journal of Finance 55, 1479–1514.
Vives, X. (1995) Short-Term Investment and the Informational Efficiency of the Market, Review of Financial Studies 8, 125–160.
Zhang, F. (2010) High Frequency Trading, Stock Volatility, and Price Discovery, Working Paper, Yale University.
1. Although algorithmic trading is not a new phenomenon, algorithmic trading, especially high frequency trading, went to the forefront of policy debates in recent years. A search on articles from newspapers, magazines, academic journals, trade publications, etc., containing the words “algorithmic trading” on EBSCO yields 2502 hits over the period 2005–2011 and only 329 over the period 1999–2004.
2. A limit order is an order to buy or sell a given number of shares at a pre-specified price. Typically, these orders cannot be executed upon submission as their price usually does not match the price requested by other traders in the market. In this case, limit orders are stored in a limit order book, waiting for future execution. A market order is an order to buy or sell a given number of shares at any price. It is therefore immediately executed against posted limit orders, if any.
3. As mentioned in the introduction, algorithmic trading is not a new phenomenon. “Program trading” was developed in the 1980s as an automated strategy to hedge a large basket of stocks. Some hedge funds (e.g., “stat arbs”) have also been using highly automated strategies for a long time. What is novel is the frequency at which computers are used for trading decisions. As explained below, some investors now use computers to place orders at the super high frequency (e.g., the millisecond).
4. See Bertsimas and Lo (1998) and Huberman and Stanzl (2005) for formulations and analyses of this optimization problem.
5. Sorkenmaier and Wagener (2011) report the duration of crossed quotes for stock constituents of the FTSE 100 and traded on the LSE, Chi-X, BATS, and Turquoise. They found that this duration was 16 minutes in April/May 2009 but only 19.8 seconds in April/May 2010. This dramatic decline is most likely due to an intensification of automated arbitrage between these markets.
6. Triangular arbitrage consists in buying and selling simultaneously the same currency against another currency in two different ways (directly and indirectly through a third currency) so as to capture any price discrepancy between the purchase price and the sale price. Kozhan and Tham (2010) found occurrences of triangular arbitrage opportunities but they are very short lived (on average they lasted 1.37 seconds in their sample).
7. This contrarian strategy is well known and can be implemented at various frequencies (see Khandani and Lo, 2011).
8. Another strategy consists in using newsreader algorithms, which use statistical analysis and text analysis methods to process news and take positions based on the news.
9. Similarly, they can be a first mover advantage for traders who can quickly submit market orders when bid-ask spreads are tight. Garvey and Wu (2010) found that traders who get quicker access to the NYSE because of their geographical proximity to the NYSE pay smaller average effective spreads.
10. There is not yet a well-accepted definition of high frequency traders. A report by the SEC defines them as proprietary trading firms characterized by
(1) the use of extraordinarily high-speed and sophisticated computer programs for generating, routing, and executing orders; (2) use of co-location services and individual data feeds offered by exchanges and others to minimize network and other types of latencies; (3) very short time-frames for establishing and liquidating positions; (4) the submission of numerous orders that are cancelled shortly after submission; and (5) ending the trading day in as close to a flat position as possible (that is, not carrying significant, unhedged positions over-night) (see SEC, 2010, p. 45).
11. Trading platforms distinguish two sides in each transaction: the active side that initiates the transaction by submitting a market order and the passive side that acts as the counterparty to the active side (with a limit order).
12. Trading platforms define latency as the communication time between a trader's server and the platform (e.g., the time for the platform to acknowledge reception of an order submitted by the trader). This delay is just one component of the relevant latency for traders, which are also concerned by the speed at which they can process and react to information received from trading platforms.
13. See, for instance, the estimates of the contribution of high frequency traders to their trading volume provided by trading platforms in response to the “Call for Evidence on Micro-structural Issues of the European Equity Markets” by CESR. This contribution varies between 13 % (Nasdaq OMX) and 40 % (Chi-X).
14. Archipelago and Nasdaq OMX are part of NYSE and Nasdaq, respectively.
15. The order concentration rule allowed a member state to require concentration of trading on its national stock exchange for the stocks listed on this exchange.
16. See http://www.ft.com/trading-room.
17. For instance, in Europe, some French investors might perceive the cost of trading French stocks on MTFs highly prohibitive compared to Euronext because they do not have the technology to view the quotes posted on these MTFs easily and because they may face higher clearing and settlement costs on MTFs.
18. Menkveld (2011) finds that the liquidity rebate paid by Chi-X constitutes a significant fraction of the gross profit for the electronic market-maker analyzed in his study.
19. For instance, US trading platforms must also transmit their data to plan processors (the Consolidated Tape Association and Consolidated Quote Association) who then consolidate the data and distribute them to the public (the proceeds are then redistributed among contributors). As this process takes time, market participants with a direct access to trading platforms' individual data feed can obtain market data faster than participants who obtain the data from plan sponsors. See the SEC concept release on equity market structure, Section IV.B.2, for a discussion.
20. They also note that the entry of EuroSETS induced Euronext to cut its trading fees. Competition for order flow has put considerable pressures on trading fees charged by trading platforms in Europe since the implementation of MiFID.
21. This problem is not new. For instance, in the 1990s, Nasdaq dealers complained that the possibility given to investors to execute small orders automatically against their quotes (at this time, execution was not yet automatic on Nasdaq, except for small quotes) was used by some investors (dubbed “SOES bandits” by the dealers) to pick off dealers who were slow to adjust their quotes in case of news arrival. See Foucault et al. (2003).
22. For instance, the electronic market-maker studied in Menkveld (2011) makes “positioning losses”; i.e., if one assumes that all his trades execute at the mid-quote then the market-maker loses money. This finding implies that, on average, when the market-maker buys (respectively sells) an asset, the value of this asset tends to fall (increase) afterwards. This does not support the view that he systematically picks off stale limit orders and is a source of adverse selection. The market-maker makes money because he does not buy (sell) at the mid-quote but at its bid (ask) price and thereby earns the bid-ask spread. Chaboud et al. (2009) also suggest that algorithmic traders mainly use algorithms to protect themselves against the risk of being picked off. Yet the empirical literature also finds that market orders placed by algo traders contain information that suggests that they may sometimes be submitted to pick off stale limit orders.
23. In Vives (1995), informational efficiency is measured by the precision of investors' forecasts of an asset liquidation value conditional on the asset price. This precision is higher when the asset price is closer to the asset fundamental value.
24. This problem is just another manifestation of the well-known Grossman and Stiglitz (1980) paradox.
25. See “UAL Story Blame Is Placed on Computer”, Wall Street Journal, European Edition, 10 September 2008.
26. One way to alleviate this problem would be to tax fast traders and to redistribute the proceeds from this tax to slow traders (a form of Pigouvian tax). As usual, however, the problem with this solution is to find the optimal level for the tax (a too large tax can be more suboptimal than no tax) and also to target the right kind of algorithmic traders (i.e., those who mainly use algorithms for speculative purposes).
27. It is unclear whether this is the case. During the market crash of October 1987, NYSE specialists stopped executing orders, which suggests that traditional market-makers may also stop providing liquidity when markets become highly volatile.
28. Examples of human errors abound. For instance, in September 2006, a rugby ball (!) landed on a Bank of America trader's keyboard, triggering the execution of a $50 million trade ahead of schedule.
29. When a large sell or buy order is split, each piece is called a child order while the original order itself is called the “parent order”.
30. There exist other, less dramatic, examples of ill-conceived algorithms. In 2010, the NYSE fined Credit Suisse $150 000 for poorly supervising the development and execution of an algorithm that severely disrupted the speed at which trading could take place on the NYSE.
31. Hendershott et al. (2011) use the daily message traffic of each stock (i.e., the number of orders submitted and cancelled for that stock) normalized by trading volume in dollars as a proxy for algo trading.
32. The adverse selection component of the bid-ask spread is measured by the extent to which prices move against the submitter of a limit order after execution of the order.
33. This finding suggests that HFTs have some market power, maybe because the concentration of HFT firms is relatively high, as mentioned in Section 1.2.2.
34. Kirilenko et al. (2010) find weak evidence in favor of positive feedback trading for high frequency traders. Indeed, changes in the holdings of these traders are positively correlated with very recent price changes (from 1 second up to 4 seconds). This suggests that they buy when prices are just moving up and sell when prices are just moving down. In contrast, changes in their holdings are negatively correlated with price changes at further lags (11 seconds, etc.). The positive correlation between HFT changes in holdings and very recent price changes may simply reflect HFTs reacting to the same information and taking advantage of this information with market orders. In line with this hypothesis, Kirilenko et al. (2010) found that the positive correlation between HFT holdings changes, and recent changes in prices are positive only when HFTs change their positions with market orders.
35. For instance, if quotes posted by human traders do not contain information, these quotes will not move estimates of the fundamental value of the security when they are updated. In this case, changes in quotes posted by human traders will have a zero contribution to the variance of the fundamental value of the security.
36. Zhang (2010) offers a dissenting view. Using a proxy for HFTs' trading volume, he considers the effect of HFTs on price movements after an earnings announcement. He shows that the prices of stocks that attract more trading from HFTs overshoot their fundamental value after earnings announcements. This suggests that HFTs have a negative effect on price discovery. In contrast to other studies mentioned in this section, however, Zhang (2010) cannot directly measure HFTs' trading volume. He infers this volume from data on institutional holdings, which raises the possibility that his proxy for HFTs capture the activity of individual investors rather than HFTs.
37. This is a standard effect in models of trading with asymmetric information: trades by informed investors accelerate the price discovery process but tend to make the market illiquid (see Glosten and Milgrom, 1985).
38. Kirilenko et al. (2010) show, over the period 1:30 p.m. to 1:45 p.m., that the excess of sell orders over buy orders by fundamental traders (those that they do not classify as intermediaries or HFTs) was 30 000 contracts.
39. Some brokers monitor the evolution of execution costs for their clients taking into account the fact that a single order may be “chopped” in small pieces. Reports of these brokers provide information on the evolution of trading costs. For instance, ITG reports that, for the US, execution costs for orders executed by ITG have declined in US equities from 68 bps to 40 bps (brokerage fees included) from 2004 to 2007, but have increased again in 2008 to reach a high of 80 bps at the end of 2008, maybe because of the subprime crisis. See ITG Global, “Trading Cost Review, Q4 2008”, available at http://www.itg.com/news_events/papers/ITGGlobalTradingCostReview_2008Q4.pdf.