
When deploying one or more FreeSWITCH servers in a production environment, it is essential to set up some monitoring mechanisms. Monitoring is more than a best-practice, it is a must-have to maintain a reliable, highly-available, powerful VoIP softswitch. It is necessary in order to be quick to react in case of critical issues and various emergencies. Setting up monitoring mechanisms is easy to say, but a good question would be 'what should we monitor, and how?' You would probably want to keep an eye on several aspects of a running server, for instance:
- Check if everything is fine at a system level, for example:
- Is the FreeSWITCH service up and running?
- Are all the IP ports that are supposed to be listening actually listening?
- Is my host too loaded or is it just fine?
- Check more specifically if the FreeSWITCH service is sane
- Check very specific aspects of the operation, for example:
- Does my IVR behave like it should?
- Are the conference rooms working?
- Is the voicemail service working?
- And so on…
If you look for monitoring tools on the Internet, a lot of what you find will be related to SNMP (Simple Network Management Protocol). SNMP is a widely used protocol on networks all around the world that provides a simple way to retrieve the status of a particular host. It exposes a lot of information local to the host, so that a remote machine can gather it and then can show the data in a fancy way to administrators. Usually, the remote machine is said to be a management host and it retrieves data from lots of different hosts and devices. To be strict, SNMP is read/write and can therefore also be used to set parameters on the managed host. It exists in three versions, SNMPv3 being the last version but SNMPv2 still being largely used.
You can visualize SNMP as a tree with a root node (.1) and branches, each of them storing at different levels, information about the host, the network interfaces, the processes running on it, and so on. The structure of the tree exposed by SNMP is defined by MIB (Management Information Base), which are highly extensible descriptions. For instance, if you want to know the hostname of an SNMP client, it is provided at the following leaf (called OID, for object identifier) in SNMPv2: .1.3.6.1.2.1.1.5 (or SNMPv2-MIB::sysName, because a MIB maps OIDs to human-readable strings, like in DNS, network addresses are translated to names).
SNMP is defined in detail in RFC3418. FreeSWITCH has an SNMP module called mod_snmp which exports a few very relevant internal attributes, such as:
- Service uptime
- Currently active sessions
- Peak sessions
- Current session attempts per second
- Peak sessions per second
These attributes are available at a specific OID (registered as FreeSWITCH at IANA):
.1.3.6.1.4.1.27880
On Debian 8 (Jessie), the preferred Linux distro for running FreeSWITCH, you must first install all snmp related server, clients, and utilities. As root:
apt-get install snmp snmp-mibs-downloader snmpd
download-mibs
For FreeSWITCH and its mod_snmp to be able to connect to snmpd (SNMP daemon) as a subagent, add the following instructions to the SNMPd configuration file (located at /etc/snmp/snmpd.conf):
####
#  Run as an AgentX master agent
master          agentx
#  Listen on default named socket /var/agentx/master
agentXPerms     0755 0755 freeswitch daemon
Once started, the SNMP client will start to listen on dedicated ports (basically 161/udp). And after starting FreeSWITCH, if everything works as expected you will see this in the main log file:
[NOTICE] switch_loadable_module.c:496 Adding Management interface 'mod_snmp' OID[.1.3.6.1.4.1.27880.1000]
Now you are able to query FreeSWITCH stats over the SNMP interface. The quickest way to test it is using a tool called snmpwalk or snmpget (the first will extract everything it can from a branch, the latter will get you the value associated with a leaf), but make sure you use the right version and the right community configured in snmpd.conf:
#snmpwalk -v2c localhost .1.3.6.1.4.1.27880.1.2
SNMPv2-SMI::enterprises.27880.1.2.1.0 = Timeticks: (41794715) 4 days, 20:05:47.15
SNMPv2-SMI::enterprises.27880.1.2.2.0 = Counter32: 1
SNMPv2-SMI::enterprises.27880.1.2.3.0 = Gauge32: 0
SNMPv2-SMI::enterprises.27880.1.2.4.0 = Gauge32: 3000
SNMPv2-SMI::enterprises.27880.1.2.5.0 = Gauge32: 0
SNMPv2-SMI::enterprises.27880.1.2.6.0 = Gauge32: 0
SNMPv2-SMI::enterprises.27880.1.2.7.0 = Gauge32: 100
SNMPv2-SMI::enterprises.27880.1.2.8.0 = Gauge32: 1
SNMPv2-SMI::enterprises.27880.1.2.9.0 = Gauge32: 0
SNMPv2-SMI::enterprises.27880.1.2.10.0 = Gauge32: 1
SNMPv2-SMI::enterprises.27880.1.2.11.0 = Gauge32: 0
If FreeSWITCH's mod_snmp was unable to connect snmpd during startup initialization, you will see this:
SNMPv2-SMI::enterprises.27880 = No Such Object available on this agent at this OID
If the information provided by mod_snmp does not fit your needs, you may want to look for another SNMP feature: the exec or extend instruction. Basically, it allows you to export the result of any local script on the host to a specific OID.
Imagine you have a gateway called gw1 defined on the FreeSWITCH external profile. You want to be able to know at any time how many inbound/outbound calls are going in and out of this specific gateway, a simple way to do it would be to create a script check_gw1.sh on your system. This script would merely run the sofia status gateways FreeSWITCH CLI command with a few system commands to isolate the relevant part of the result:
#!/bin/bash
if [ "$1" == "in" ]; then
       /usr/local/freeswitch/bin/fs_cli -x 'sofia status gateways' | grep gw1 | awk '{print $4}'
else
       /usr/local/freeswitch/bin/fs_cli -x 'sofia status gateways' | grep gw1 | awk '{print $5}'
fi
Then, you have to extend both values:
extend gw1_in  /etc/snmp/check_gw1.sh in
extend gw1_out /etc/snmp/check_gw1.sh out
And restart the SNMP daemon.
Now, you can test your export using snmpwalk again:
#snmpwalk -v2c localhost NET-SNMP-EXTEND-MIB::nsExtendOutputFull
NET-SNMP-EXTEND-MIB::nsExtendOutputFull."gw1_in" = STRING: 0/0
NET-SNMP-EXTEND-MIB::nsExtendOutputFull."gw1_out" = STRING: 0/0
At any time, from any authorized host, you are now able to query your FreeSWITCH servers for those very specific variables: inbound/outbound failed and total calls for gateway gw1. Of course this is a very simple example and there is no limit on what kind of data you can return using SNMP.
Now that we have an insight into what SNMP is and what it is useful for, it is worth mentioning the ecosystem of tools gravitating around monitoring to gain some clue of what can be done and have some examples of concrete applications. Among the most popular monitoring tools are Nagios and Cacti.
Nagios is a tool used to monitor hosts on a network in real-time or near real-time. It gives an overview of a whole network and provides a simple way to check at a glance if everything is fine on a specific host and the processes and services running on it. Basically Nagios does two things:
- It starts monitoring tasks such as:
- Ping hosts
- Query hosts using SNMP
- Run plugins (there are a lot available on the Internet)
- Run custom scripts
- It provides a Web interface that gives a global overview of the infrastructure status (and emphasizes issues, if any)
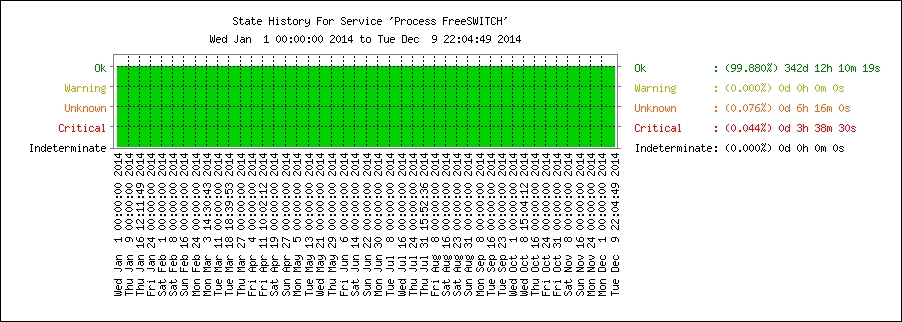
The statuses of the hosts and processes can be OK, WARNING, CRITICAL or UNKNOWN, which offers a certain granularity in the way alarms are raised. Nagios also offers a reporting tool providing graphs such as alert histograms, availability reports or trends (here, since the 1st of January of the same year):
Nagios can do a lot of things, and is hard to provide a formula to satisfy every situation. However, when a new host is set up in a production environment, some sensors seem to be essential like pinging the host (to check its availability at a network level) or checking if the FreeSWITCH process is running.
Sometimes though, checking if the service is running and if the ports are indeed open is not enough because it does not give a feature-level view of the service's status. That's why more specific sensors can be implemented: a custom script that sends SIP OPTION messages to one or all ports of the FreeSWITCH server and checks the answered SIP message is as expected. Another test could be to call a forbidden extension or an unknown destination and check if the SIP response code is good (403, 404): this way it is easy to automatically check if the dialplan and features like call restrictions are working. These examples can be implemented very easily using tools like sipsak (available on Linux and Windows operating systems) or even using custom Perl/Ruby/Python scripts built by the community.
One of the most popular among them is the Ruby NagiosSIPplugin (https://github.com/ibc/nagios-sip-plugin) which can be used to send SIP OPTIONS messages to check the availability of a SIP server. It returns one of the Nagios status codes, depending on the message received from the server:
OK: The SIP OPTIONS response code matches the one expectedWARNING: A reply has been received but the code does not matchCRITICAL: No relevant reply had been received (for instance, the server is not available or not reachable so this can be a service or a network issue)
The plugin can be easily tested from the command line:
[root@telcodevsw]# ./nagios_sip_plugin.rb -t udp -s 203.0.113.1 -p 5060 -f "sip:[email protected]" -r "sip:+33122334455@pstn" -T 3 -c 200
OK:status code = 200
[root@telcodev sw]# echo $?
0
Several parameters can be specified such as transport protocol, server address, SIP 'From' and Request-URI fields, timeout delay, and the response code expected (other parameters are available, you can check the help using -h). In the previous example the FreeSWITCH server is behaving as expected and the plugin return code is 0 (which means OK for Nagios as specified in the API documentation). However, if you test with an IP address where no FreeSWITCH instance is running or on a random port where no SIP profile is listening, a return code 2 is expected, meaning CRITICAL state:
[root@telcodev sw]# ./nagios_sip_plugin.rb -t udp -s 203.0.113.2-p 5060 -f "sip:[email protected]" -r "sip:+33122334455@pstn" -T 3 -c 200
CRITICAL:Timeout receiving the response via UDP (Timeout::Error: execution expired)
[root@telcodev sw]# echo $?
2
When the plugin is working it can be integrated into Nagios. To accomplish it, there are two main steps:
- Declare a new Nagios
commandin the configuration file, referring to the Ruby NagiosSIP plugin previously downloaded:define command { command_name check_sip_options command_line $USER1$/nagios_sip_plugin.rb -t $ARG1$ -s $HOSTADDRESS$ -p 5060 -r "sip:$ARG2$" -f "sip:$ARG3$" -T 5 -c $ARG4$ } - Declaring a new service referring to the new command:
define service {
   service_descriptionCheck SIP availability (SIP OPTIONS)
   check_commandcheck_sip_options!udp!+33122334455@pstn! [email protected]!200
check_period                          24x7
notification_period                   24x7
hostgroup_name                        freewitch_servers
contact_groups                        admins
use                                   generic-service
}
This service definition applies to the group of servers freeswitch_servers and inherits settings from a more generic template called generic-service here. A service definition can be way longer.
Another interesting Nagios add-on is check_mk, with its logwatch capability. It can parse system log files as well as other specific log files and apply regexes on them to find out if a message is present or not. This can be applied to a FreeSWITCH server by parsing the execution logs to search for failed calls, then an alarm can be raised if too many calls fail.
Compared to Nagios which is designed to provide real-time alarms about the network and the hosts it contains, Cacti is a tool used to store data over medium/long periods and generate graphs about it. In the manner of Nagios, Cacti checks various aspects of a system and provides a Web interface to display the results in graphs generated with rrdtool. Cacti is a not a proper monitoring tool as it cannot be used for real-time purposes, however it is still useful for data analysis over medium, long, and even sometimes short periods (for instance, comparing usages between the day before and the current day). Cacti is largely designed to work with SNMP but it also enables administrators to gather data to graph using custom scripts.
Going back to the SNMP, we know we can export any data we like from the running FreeSWITCH service. Hence, coupled with Cacti, it is easy to get reports like:
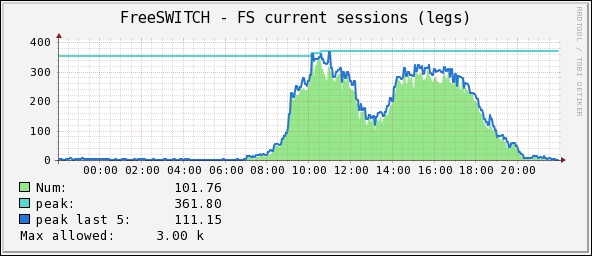
Here, four different variables (exported thanks to FreeSWITCH's mod_snmp) are displayed:
- Current number of sessions (SNMP OID: .1.3.6.1.4.1.27880.1.2.3)
- Peak number of sessions (SNMP OID: .1.3.6.1.4.1.27880.1.2.10)
- Peak number of sessions lasting five minutes (SNMP OID: .1.3.6.1.4.1.27880.1.2.11)
- Max number of sessions allowed (SNMP OID: .1.3.6.1.4.1.27880.1.2.4)
It is also possible to extract more specific data (per gateway current calls, per SIP profile active sessions, and so on) and export them in SNMP so that graphs can be generated with these distinctions making it easy for the administrator to understand uses and load distribution on FreeSWITCH servers.