
Telecommunication can be seen as being comprised of the two elements of signaling and media, and so can the tools to debug and troubleshoot it.
But this comes with a caveat: Anything that runs in a server, or through wires, is just packets of data. So, for media too, we will have to get the stream of data describing our audio (or video, or fax), then convert it into a playable format, and hear what the end user experience was.
Bottom line: Packet capture, analysis, conversion, editing, archiving, slicing and dicing is the bread and butter of diagnosing VoIP for all that concerns codecs, routing, networking, infrastructure, and the like, while media replaying (say, listening or watching captured RTP packets) has in itself a lesser role. But actual end user experience can only be understood via media replaying (are there audio artifacts? Low volume? Echo? Noise? Clipping?). Understanding end user experience "in their own words" is fundamental for a smooth support assistance ("then, since I started talking about that meeting, suddenly I was hearing noise and an echo", not "240 milliseconds after that Re-Invite, jitter started shooting").
Many tools out there can do almost anything: They have features added on a continuous basis, have command line switches for almost any low case *AND* capital letter, and their man pages are longer to read than a Nordic Saga.
We'll focus here on the most typical, specialized, and popular, usages for each tool, with a "toolbox" approach.
Firewalls are the evil stars of VoIP debugging: They block packets. We want packets to flow. If they block them, the packets do not flow.
Maybe they block packets right away. Maybe after a while (30 seconds, anyone?). Maybe in just one direction. Or intermittently.
Maybe there is no separate firewall on the customer's premises, nor on their pbx, but a firewall is running on their ADSL router. Or on their client machines.
Firewalls: They are out there, they are between us, they are inside us.
From a security and network-management standpoint, packet-filtering (firewalling) is the best line of defense, and an invaluable and flexible tool.
But when you're troubleshooting a new installation, or sudden lack of audio, or one way audio, or an inability to hang up a call (or to call altogether), then disable all the firewalls involved and recheck.
If it works out, then you know it is a problem of misconfigured firewall rules, and you can focus on fixing it, or call the security personnel in charge of it.
On a Linux machine, to disable all firewall rules, as root do:
- Create a shell script (
iptables_flush.sh) and copy-paste the following lines:#!/bin/sh echo "Flushing iptables rules..." sleep 1 iptables -F iptables -X iptables -t nat -F iptables -t nat -X iptables -t mangle -F iptables -t mangle -X iptables -P INPUT ACCEPT iptables -P FORWARD ACCEPT iptables -P OUTPUT ACCEPT
- Make the file executable:
chmod +x iptables_flush.sh - Run the script:
./iptables_flush.sh
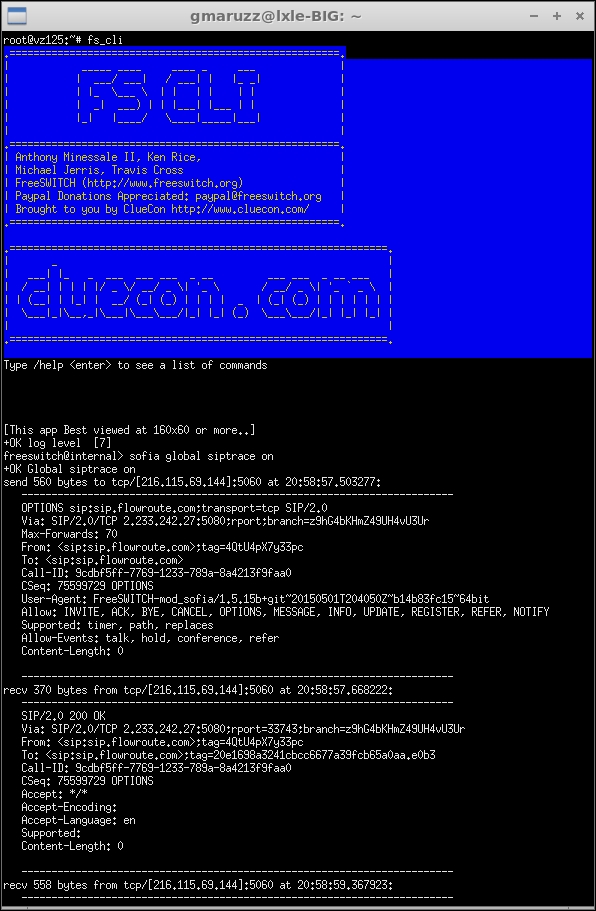
The first line of inquiry will be from fs_cli, the command line interface to FreeSWITCH; you can enable SIP packet display per single profile (sofia profile internal siptrace on) or per all profiles at once (sofia global sip trace on).
This can be useful both as a quick way to check for a problem, and as a way of obtaining added information recorded permanently on logfile.
For having a complete picture of each call, complete with FS debug info and SIP packets, input the following:
<param name="uuid" value="true"/>
In /usr/local/freeswitch/conf/autoload_configs/logfile.conf.xml, set siptrace:
<param name="sip-trace" value="yes"/>
Inside profile definition in /usr/local/freeswitch/conf/sip_profiles/internal.xml and /usr/local/freeswitch/conf/sip_profiles/external.xml and:
<param name="tracelevel" value="DEBUG"/>
Inside the global setting in sofia.conf.xml. When you run fsctl loglevel 7 you'll have complete info on logfile.
You can find a tool for call_uuid-SIP packet correlation at https://github.com/2600hz/community-scripts/blob/master/FreeSWITCH/sipify.sh, invaluable for finding out exactly what's happening.
tcpdump is a utility that writes out all the stuff that passes by a network interface (for example, eth0, the first Ethernet card). It writes it all in a format that can then be easily parsed out and analyzed by other software.
tcpdump (that's not limited to tcp, as the name would suggest) is a command line utility with little dependencies (usually just libpcap and libssl) that you can easily install on any remote machine you're debugging (it's packaged ready to install on almost any operating system, and it's called "windump" on Windows).
tcpdump is able to get all that touches the network interface (and also stuff that's not directed to the local machine, but simply transits through the wire). Capturing all network traffic passing by is called "promiscuous mode". Today, with switched networks, it is seldom useful, because the packets that touch the network interface are almost always those from and to the local machine. But in old Ethernet networks (with "hubs" instead of "switches") it can be very useful. In modern switched networks, advanced switches have a special port on them where all traffic passes by (not only the one directed at the attached machine), and if you can connect to that special port you'll enjoy the promiscuous sweetness of being able to dump traffic between any third machines. For being promiscuous, leave out the -p parameter.
In its most simple invocation, you connect the traffic you want to dump via ssh to the machine and input the following:
tcpdump -w trace.pcap -p -nq -s 0 -i eth0
This will write into the trace.cap file anything that passes by the interface eth0, in the most efficient and complete way. On a testing server, where there is no traffic apart from your testing, this invocation is appropriate; you'll get it all, including things that you didn't know you wanted. On a busy server, let's say with an almost saturated Gigabit Ethernet card, this will blow your hard disk(s) in minutes).
You may want to discriminate what to write in the file, and tcpdump has its own way to specify just that. The following invocation will dump traffic that "has to do with" ports 5060 and 5080 (both to and from local and remote ports):
tcpdump -w trace.pcap -p -nq -s 0 -i eth0 port 5060 or port 5080
Those two ports happen to be the standard SIP port (5060), so it will probably be the public SIP port you use to connect to your ITSP, and both the internal (5060 used by your internal phones) and external (5080 used for receiving incoming calls) ports used by default by FreeSWITCH profiles. That is to say, this invocation will dump all the signaling SIP traffic that goes back and forth from your FreeSWITCH server in default configuration, and will produce very little, but complete, pcap files (it's only signaling, no media).
If you want to add the media dump to the previous invocation and still try to capture only VoIP traffic (for example, no HTTP, SMTP, or whatever else), run it like this (we're adding the default range FreeSWITCH uses for media, and restricting dump to UDP only):
tcpdump -w trace.pcap -p -nq -s 0 -i eth0 udp and port 5060 or port 5080 or portrange 16384-32768
The following invocation will save into file all the traffic (signaling AND media) between the local machine (that is, FreeSWITCH) and two remote addresses, for example, the addresses of your ITSP's SIP server and Media server:
tcpdump -w trace.pcap -p -nq -s 0 -i eth0 host 167.233.44.34 or host 167.233.44.36
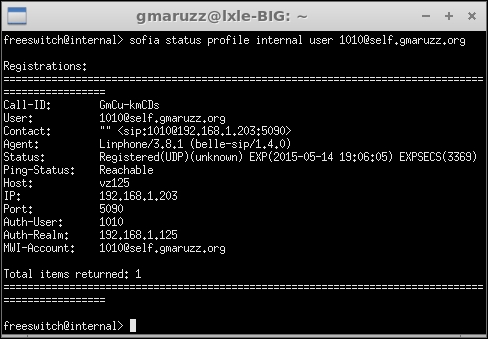
Another neat trick is to capture all traffic between a registered user (phone) and our FreeSWITCH server. Let's assume our phone is registered as user 1010. From fs_cli we get the phone's IP (address), then we exit fs_cli and start tcpdump:
tcpdump -w trace.pcap -p -nq -s 0 -i eth0 host 192.168.1.203
Infinite tcpdump options are possible, but here you've got the most important ones.
ngrep is based on the same libpcap like tcpdump, and so can use the same packet filters and read/write pcap files. It is almost certainly available as a package for your operating system.
What ngrep brings to your toolbox is the popular grep's regular expression matching with the packets' payload. The invocation takes the format ngrep [options] [regex] [filter]. Remember: regex before filter. Also, remember regex is applied to the entire packet content, not to the single lines that comprise it. It captures and displays packets in real time, so you can monitor a machine looking for something to happen:
ngrep -qt -W byline "393472665618" port 5060
The first example will display all packets on port 5060 (respecting their newline characters) that contain 393472665618.
ngrep -qt -W byline "^INVITE|^BYE|^CANCEL" port 5060
The second invocation will display all packets for methods that initiate or terminate a call leg. If you don't put the caret anchoring the match to the beginning of the line, almost all SIP packets would match because of the "Allow" header, which contains all the methods supported by the packet sender.
ngrep -qt -W byline "CSeq: [0-9]* INVITE" port 5060
This third invocation will display in real time all INVITE methods and all INVITE related responses (for example, 100, 180, 183, 407, 487, 200, and so on).
tshark is Wireshark in a terminal, that is, you can run it remotely on the server via ssh, without a remote desktop. It can do an awful lot of things, like Wireshark itself, but why you would want to use it?
On the one hand, you can use it to write pcap files using the same filter grammar used by tcpdump (they both use libpcap as a capturing backend). This is very efficient, but why not use tcpdump? Pcap style capture filter is defined by the f option.
On the other hand, it's got the r option. With it you can define "Display (Read) Filters", which are less efficient than pcap filters, but allow you to drill down to the subtle nuances of the protocols. Then, you can dump the packets in a pcap file for later inspection and analysis (for example with Wireshark), or you can see the results in real time, both for packets and as comprehensive statistics, printed on terminal. Use the "z" option for getting statistics.
(T|Wire) shark (Display|Read) filters can pinpoint, isolate, evaluate, aggregate (and so on) any known field in protocols, and if you invest time in understanding their logic, they'll repay you with sheer power (and wow factor with collegues). The main docs are at http://www.wireshark.org/docs/dfref/; look for sip, sdp, rtp, rtcp, t38, and so on.
### Filter in real time on RTCP packets displaying any packet loss or jitter over 30ms:
tshark -i eth0 -o "rtcp.heuristic_rtcp: TRUE" -R 'rtcp.ssrc.fraction>= 1 or rtcp.ssrc.jitter>= 30' -V
### Capture SIP, RTP, ICMP, DNS, RTCP, and T38 traffic in a ring buffer capturing 100 50MB files continuously:
tshark -i eth0 -o "rtp.heuristic_rtp: TRUE" -w trace.pcap -b filesize:51200 -b files:100 -R 'sip or rtp or icmp or dns or rtcp or t38'
### Display STUN packets in real time:
tshark -Y stun
pcapsipdump is like tcpdump, and can use the same filters, but it listens to the network interface(s) and writes one pcap file for each SIP session (call). Generated pcap files can contain RTP (media) flow or only signaling (SIP+SDP).
It is easy to compile, and you can find the latest version at http://pcapsipdump.sourceforge.net.
It's incredibly useful to keep your SIP traffic monitored while looking for intermittent problems reported by users. If you have a busy server, dump it on a big and fast hard disk, and don't forget to delete the files you don't need anymore.
This maybe the latest tool to come out from the ingenious people in the open source VoIP community, and, with sipgrep, they're my preferred packet utilities. Hands down. Wholeheartedly.
This single tool allows for both the capturing and visualizing of live (and in real time) SIP dialogs for each call, and visualizes live flow graphs, drilling down to the details. Also, you can select more than one call (for example, A leg and B leg of a bridged call) and see them both in one comprehensive flow.
It is based on libpcap, so it accepts all the standard filters like tcpdump and can write pcap files (it can also load standard pcap files). It supports IPv6, and, if compiled with openssl, is able to read and display TLS-secured SIPS (given the keyfile). If compiled with pcre, it gives you the complete "perl" regular expressions.
And you can do all of this server side, in a terminal, via ssh, without downloading or streaming pcaps to your desktop, actually without any software on your side, just an ssh terminal.
Sngrep justifies filling an HD monitor with a maximized xterm (you still chat and browse in that second monitor, don't you?).
At the time of writing this, sngrep is too new to be included in distros, but it is very easy to download and compile from sources, and installable packages are available for Debian/Ubuntu/CentOS/RedHat/OSX. Have a look at http://github.com/irontec/sngrep for latest version.
You start sngrep from the command line, similar to tcpdump:
sngrep -d eth0 -O trace.pcap host 192.168.0.50 port 5061
This will filter and display all SIP packets to/from port 5061 and host 192.168.0.50 and write them in trace.pcap file.
At the start you'll find yourself in the call list window, where the dialogs will be listed. On a busy server, you'll see that it immediately begins to populate. In this window *any* dialog that satisfies the command line filter will appear, not only call legs, but registrations, pinging options, and so on. If you only want to visualize dialogs starting with the method INVITE ( that is, call legs), use the -c command line argument.
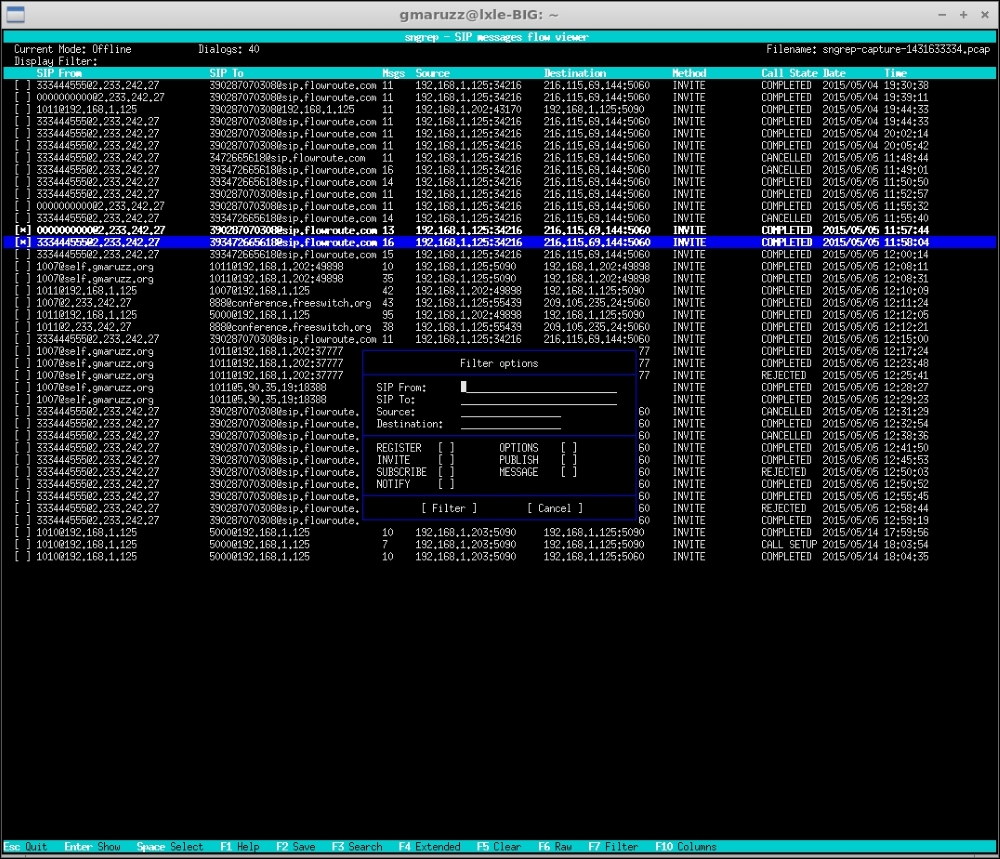
sngrep dialog list window, two dialogs selected, and pressing F7
You can filter the list by general criteria with F7, or you can search for specific dialogs with F3. You can choose which "columns" to show in the list, in which order, and save the layout as default.
From this window you can press enter on a dialog to see its flow, the individual messages that comprise the SIP transactions. Also, you can select (pressing space bar) more than one dialog, and when you hit Enter you'll see their collective flows (for example, a bridged call).

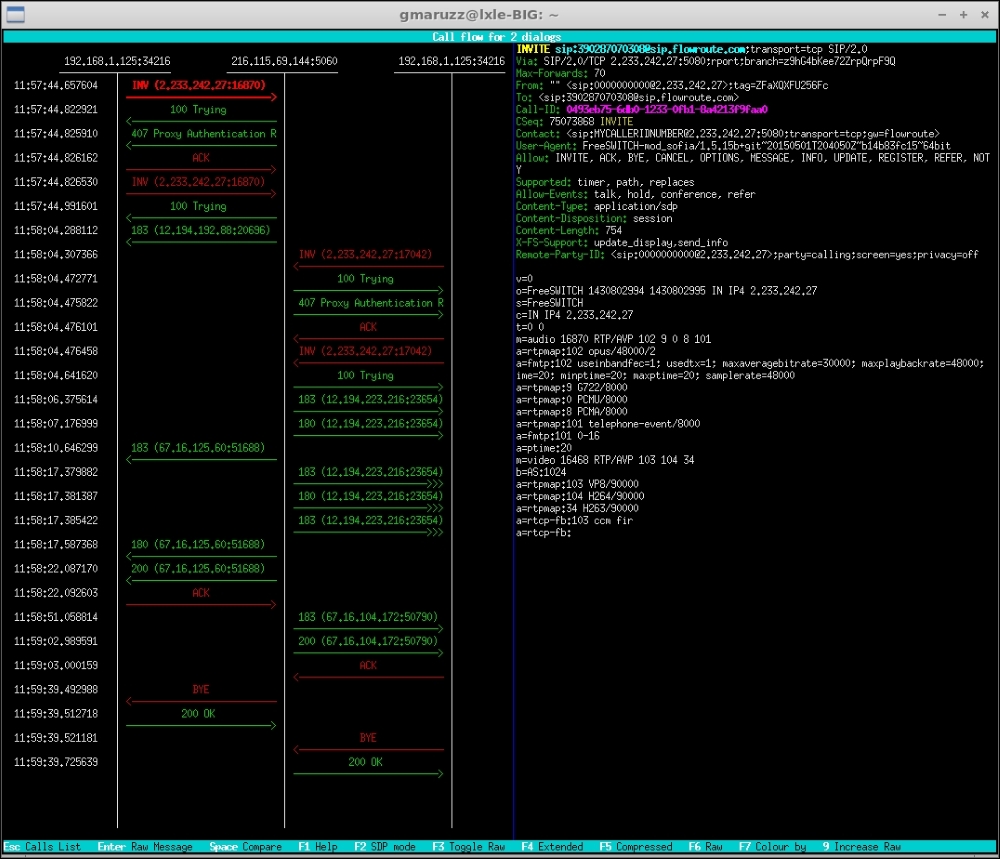
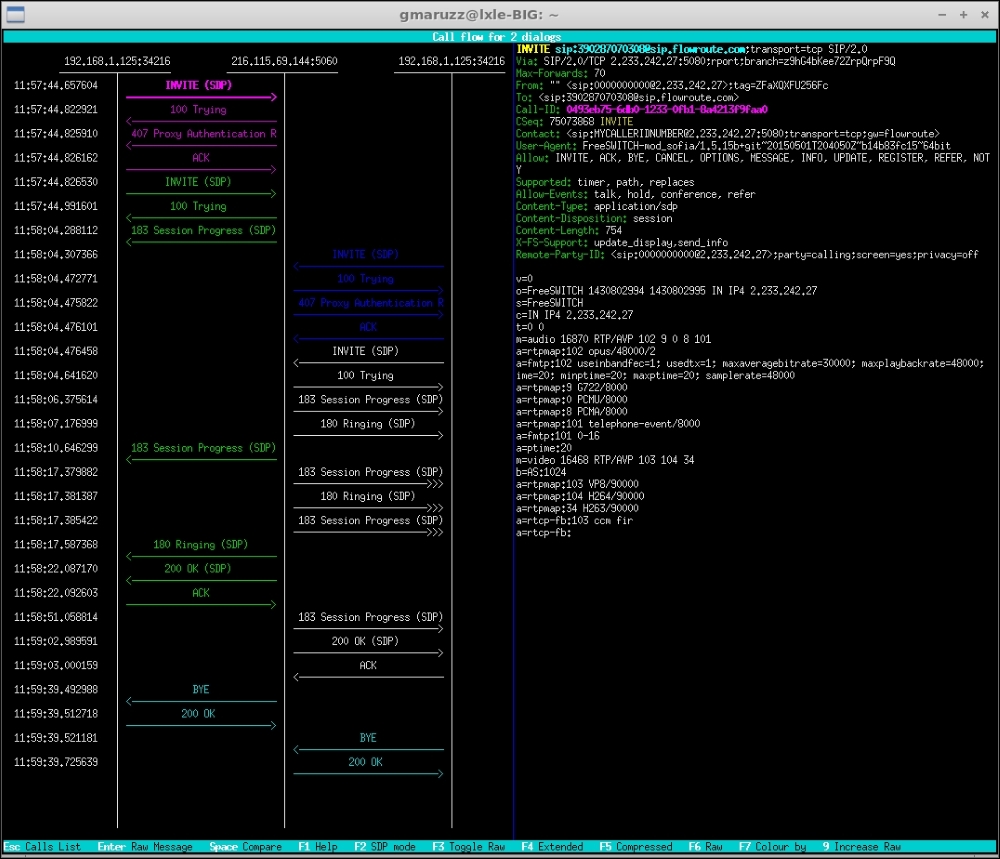
Flow of two legs of a bridged call, colored by transactions
With UP and DOWN arrows you browse through messages that are visualized in the right pane. Pressing F2 will show the flow with SDP in the graph. Pressing Enter on a message will show it raw; this is useful to copy and paste from terminal. With space bar you can select two messages (for example, an Invite and a re-Invite); pressing Enter will show them side by side, with differences highlighted.
Flow of two legs of a bridged call, colored by transactions, showing SDP in graph
Pressing F7 in the call flow window will change the coloring of messages, for example, from transactions to CSeq, or CallId.
Flow of two legs of a bridged call, colored by Cseq
The fine people that brought Homer into this world (Homer being an open source SIP capture and monitoring system, database-centered, carrier-grade, http://www.sipcapture.org), see next chapter gave us a new sipgrep.
The previous sipgrep incarnation was a Perl script, wrapping, parsing and coloring the output of ngrep. This new incarnation is a self-standing tool written in C, starting from a ngrep codebase and adding the smorgasbord of VoIP options.
It's a relatively new tool, so you probably won't find it prepackaged by your distro (that version may be too old). Go straight to http://github.com/sipcapture/sipgrep; there is easy info on how to build and install it.
Start sipgrep with the -f or -t option to visualize dialogs where From: or To: matches an expression, and add -G option if you want a report with statistics:
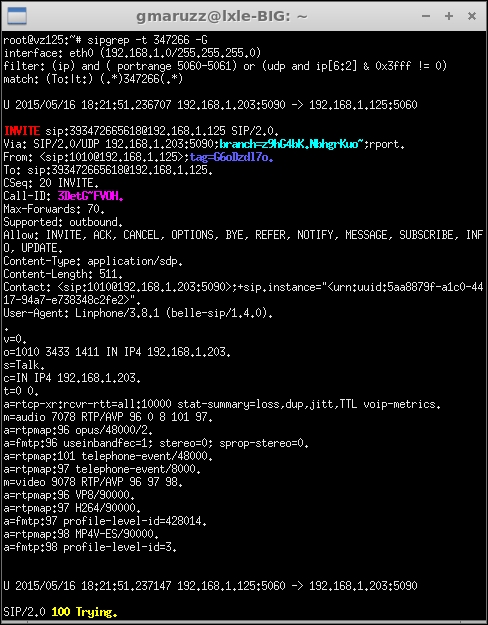
sipgrep looking for To: in dialogs, and preparing stats
In this example, we started sipgrep with the option for statistics, then made a call from a SIP client to a callee that matched the -t option we gave to sipgrep. We generated from Linphone an A leg incoming to the server, and FreeSWITCH generated an outbound B leg to the callee, then FS bridged the two legs in a complete call.
Sipgrep visualized all the packets related to the two dialogs (legs), with nice colorization. Then, at the call end, after hangup, we hit Ctrl + C to interrupt sipgrep, which gave us its report on both dialogs that were part of the call.
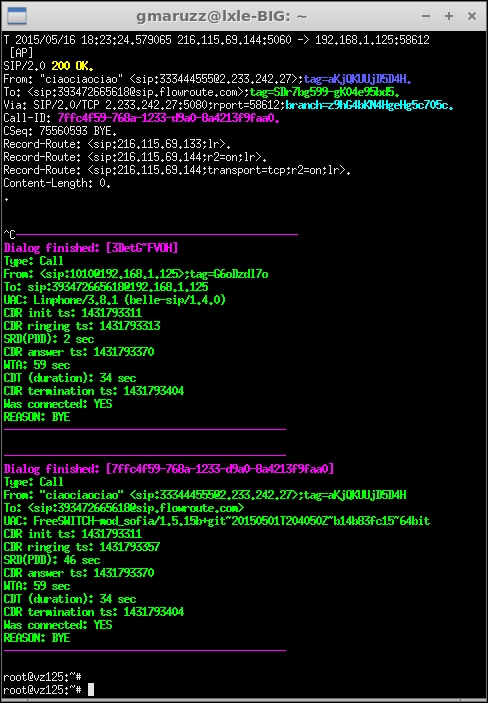
sipgrep statistics results
The -M option will disable multiline matches, while -m will disable dialog matching (that is, it will match only specific messages, not entire dialogs).
Another intriguing feature of sipgrep is activated with -J option: It will automatically send a packet-of-death (a combination able to crash the remote software) to any "friendly scanner" probing/flooding your SIP server (use -j to customize the user agent of the scanner).
It can read and write pcap files, of course, and has nice features for managing file sizes, rotation, time duration, among many other things.
Wireshark is "the" network packet analyzer. It can analyze LAN performances, HTTP and NFS, USB traffic, BlueTooth, WiFi signals. It's got everything and the kitchen sink. There are books about it, and specific books about its use in VoIP.
Wireshark can be installed on most operating systems, and can then act as a real-time network analyzer (for example, by capturing packets from the network interface, or by receiving a stream by a capture utility) or can read pcap files.
To use tcpdump on a server (server has 192.168.1.125 ip address), and receive the capture in real time with our desktop Wireshark, using the -U (unbuffered) tcpdump option, we first create a named pipe (and we exclude port 22 from capture because we're using ssh to stream it):
$ mkfifo /tmp/sharkfin
$ wireshark -k -i /tmp/sharkfin&
$ ssh [email protected] "tcpdump -U -w - -p -nq -s 0 -i eth0 'not tcp port 22'"> /tmp/sharkfin
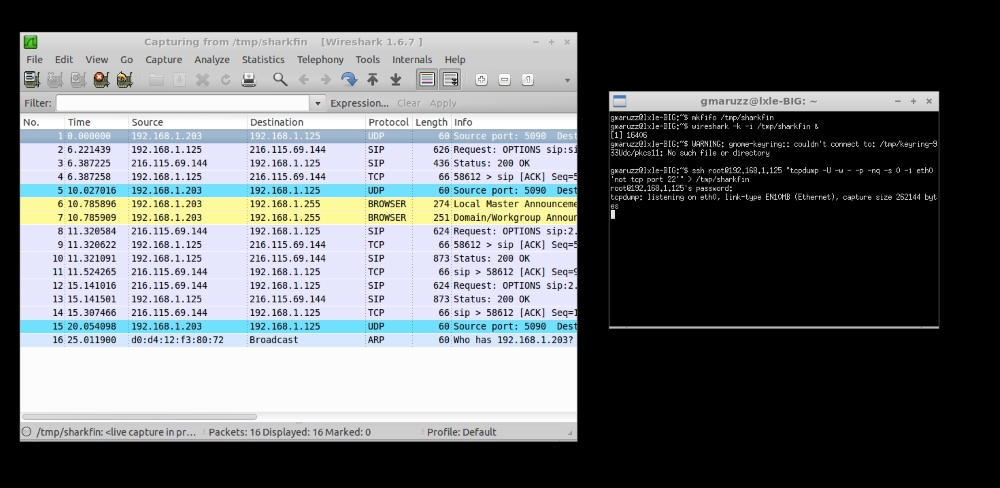
Remote tcpdump to local wireshark
Or you can install wireshark on a remote server, execute it there, capturing locally, and display it remotely on your desktop (via VNC, ssh -X, etc). Installing Wireshark on a Linux server does not install or run on the desktop; only just enough X stuff to permit remote display. It does not add load to your server.
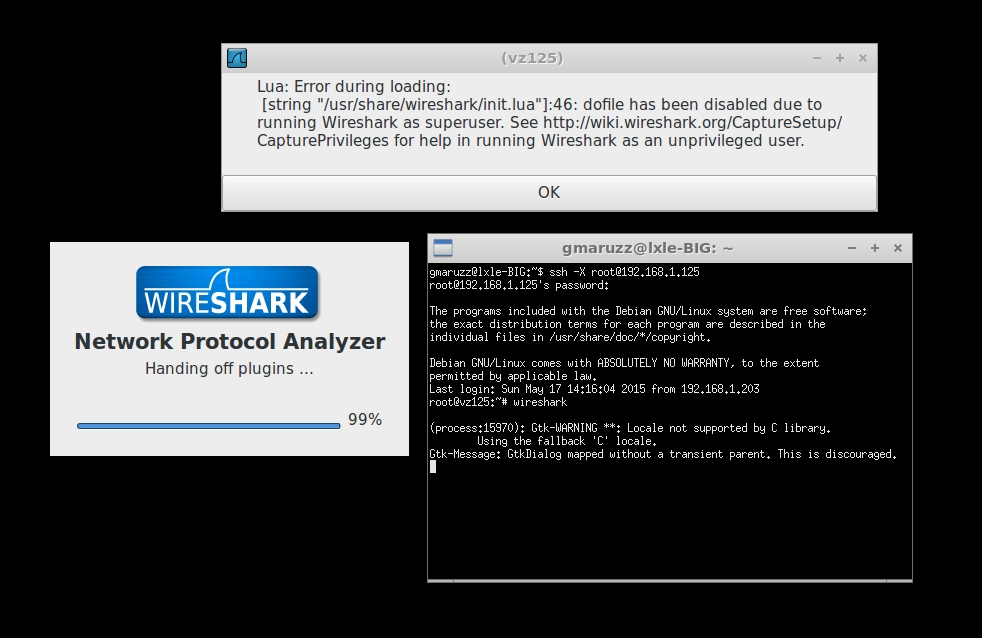
Perform ssh -X on FreeSWITCH server and execute wireshark there. Press OK, and you're good to go
OK, so you're capturing now. Make a call or two, then open menu Telephony | VoIP Calls.
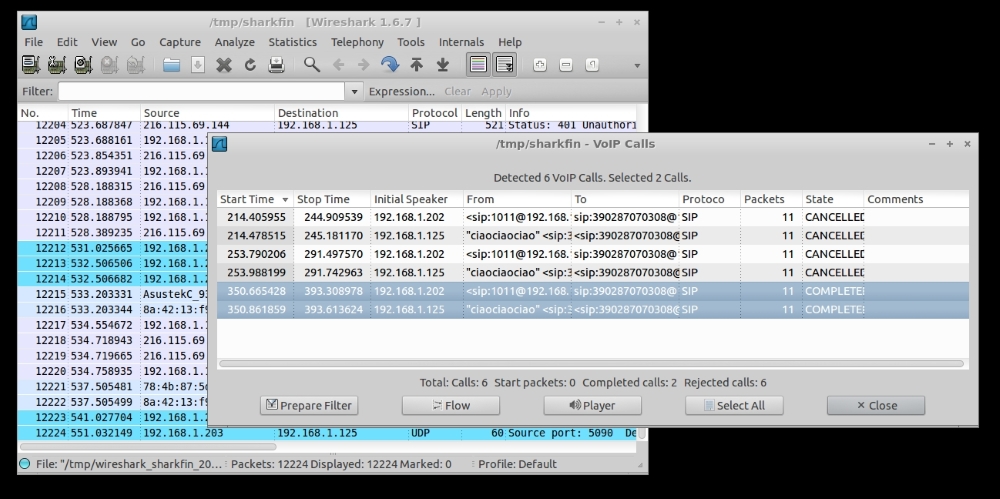
Select the call legs you want to analyze (you can select two legs to analyze the flow of a complete bridged call).
(from Telephony | VoIP Calls menu, selecting two legs of a call)
Then you select Flow, and a graph will appear with our whole (two-legged) call.
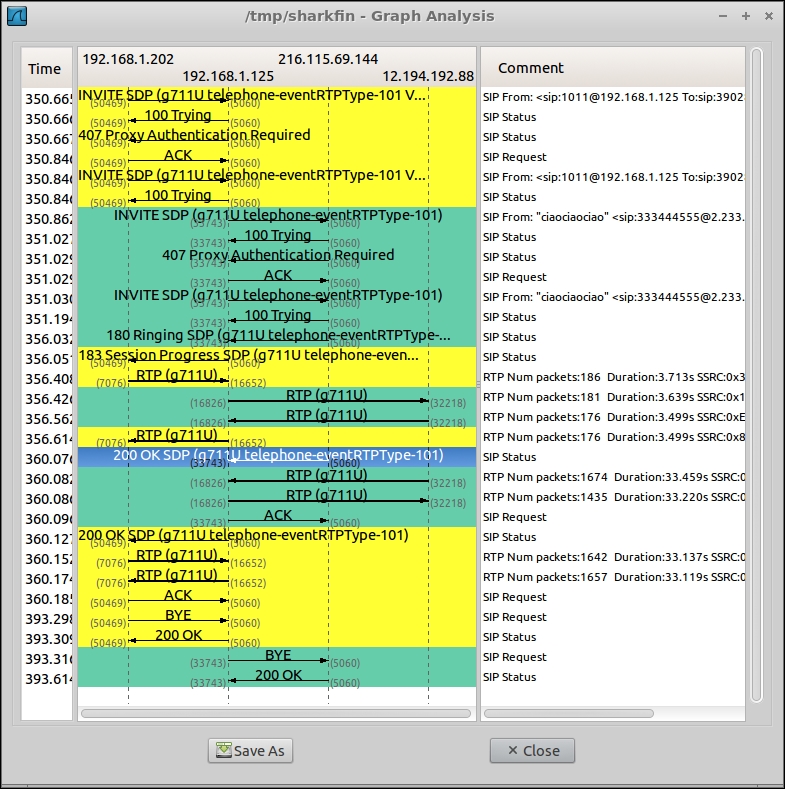
Graph of a two legged call
It can seem intimidating at first. Actually, it's not.
Linphone is calling a PSTN number via FreeSWITCH. FreeSWITCH uses an ITSP as PSTN gateway. Columns: final 202 is Linphone client, final 125 is FreeSWITCH server, final 144 is our telephony provider (ITSP) SIP signaling server, final 88 is our ITSP's RTP (media) server.
There are back and forth INVITE between Linphone and FreeSWITCH, and then between FreeSWITCH and ITSP, until with "200 OK" the call leg from FS to ITSP is up, and then with the second "200 OK" the call leg from Linphone to FS is up, and the two legs are bridged by FS.
RTP is flowing between FS and ITSP, and between Linphone and FS. FS is "mixing" (bridging) the two RTP flows, and Linphone can receive and send audio to/from the remote PSTN phone.
The call is terminated by a "BYE" from Linphone, that is relayed by FS to the ITSP (ITSP will tear down the PSTN connection on his side).
If you click on an element in the graph (let's say the first "200 OK"), the corresponding packet(s) in the main window are selected. You can then inspect them. In our case we're showing both the message headers (for example, the SIP part) and the message body (for example, the SDP content).
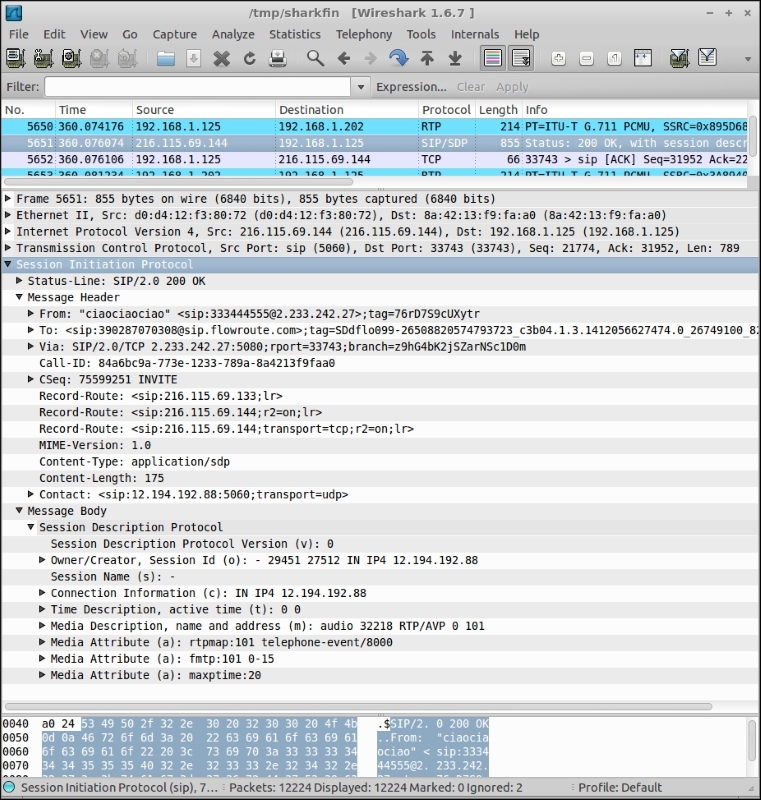
Visualizing a SIP packet, and its SDP body
From "VoIP Calls", after selecting the legs you can click on "Player", and if you have captured RTP too (that is, not only signaling, but media too) you'll be able to hear the audio streams that were exchanged.
You have four streams, for a bridged call: From Linphone to FS, from FS to Linphone, from FS to ITSP, from ITSP to FS. Select one or two of those streams, and click Play. If you selected two streams, one will be on the right audio channel, other one on the left (you'd better use stereo headphones, or listen to one stream at time).
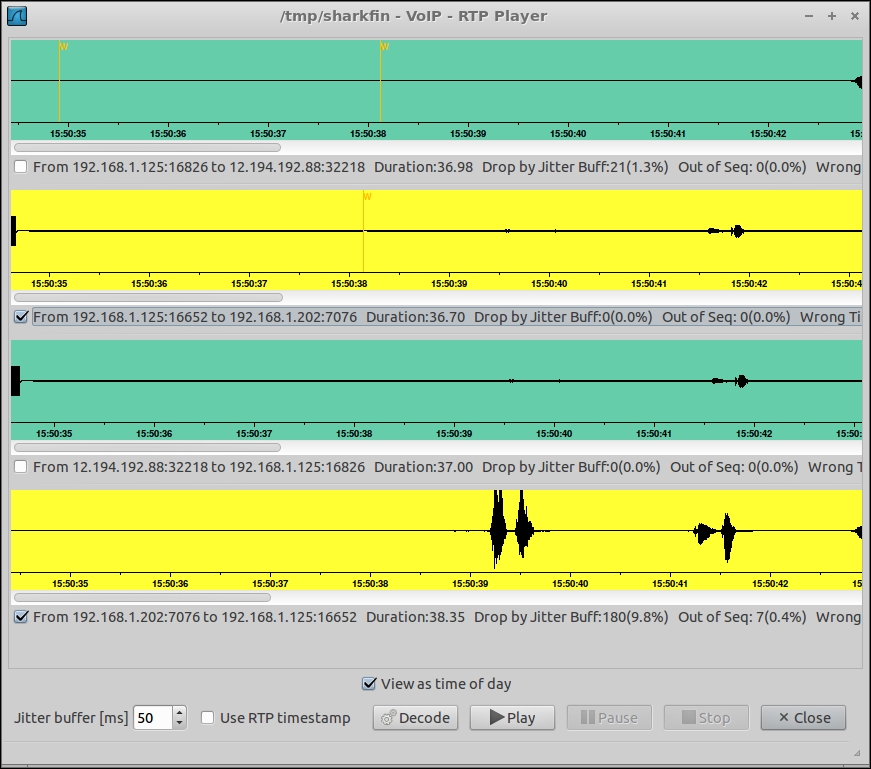
Audio streams from a bridged call
You can have advanced statistics on RTP by selecting one or more streams from Telephony | RTP | Show All Streams, and then Telephony | RTP | Streams Analysis.
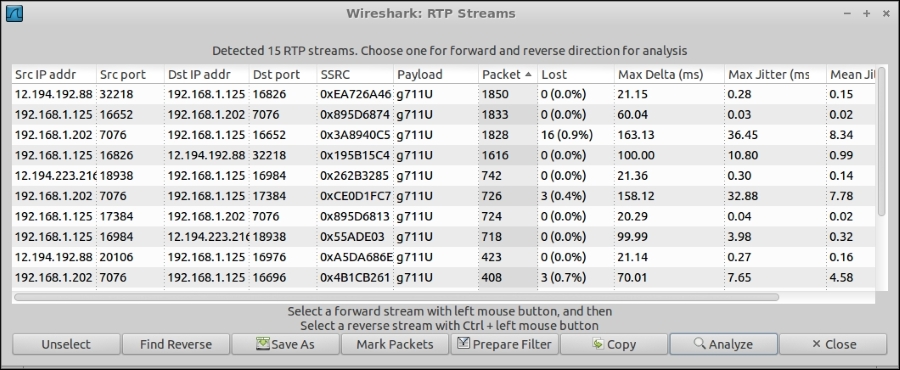
RTP All Streams window
Also, from here you can save the decoded audio as .raw or .au format. Order the "All Streams" window for "packet"; clicking on the column name, will help you identify the streams with most packets, such as those of the longest duration. Select the RTP stream of one call leg and click "Find Reverse", then "Analyze", then "Save Payload", then save as ".au""both" channels. Repeat for the other leg. You now have two copies of the complete call, from the point of view of each leg. They're probably more or less the same, if the call was successful (for example, if both caller and callee had bidirectional audio). Now, repeat the procedure, but first save the stream from Linphone to FS, and then the stream from ITSP to FS (watch the addresses!), saving for each leg only "forward".
Let's say with wireshark you saved your two legs (combination of two directions for each leg in .au format) as LegAboth and LegBboth, and then saved only the stream going from the endpoint (Linphone or ITSP) to FreeSWITCH as LegAfwd and LegBfwd.
You can now finely analyze them with Audacity. Audacity is a complete tool for analyzing, editing, and modifying audio files. It is open source, and runs on any operating system.
Open the LegAboth file, then, from the menu File | Import | Audio, open LegBboth file. You'll see they're very similar, and also that the speakers were speaking in turns. That's expected. They've both got incoming and outgoing audio.
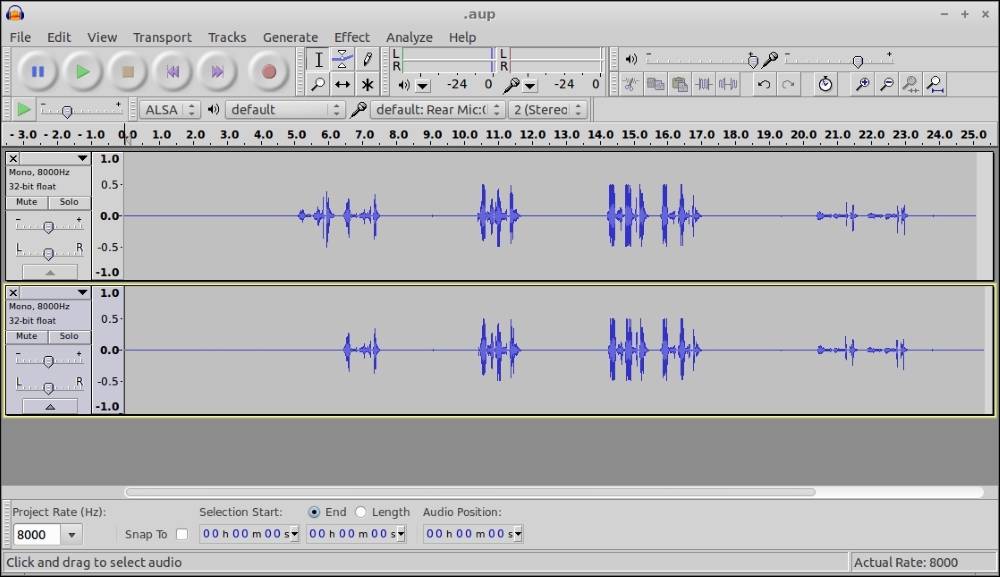
Complete audio from both directions, two legs of a call
Now open LegAfwd and then import LegBfwd.
You'll see only the audio sent from the endpoints to FreeSWITCH. The combination of both makes the complete call (assuming FreeSWITCH has correctly bridged the two legs, and there are no network problems in the RTP paths between endpoints and FreeSWITCH).
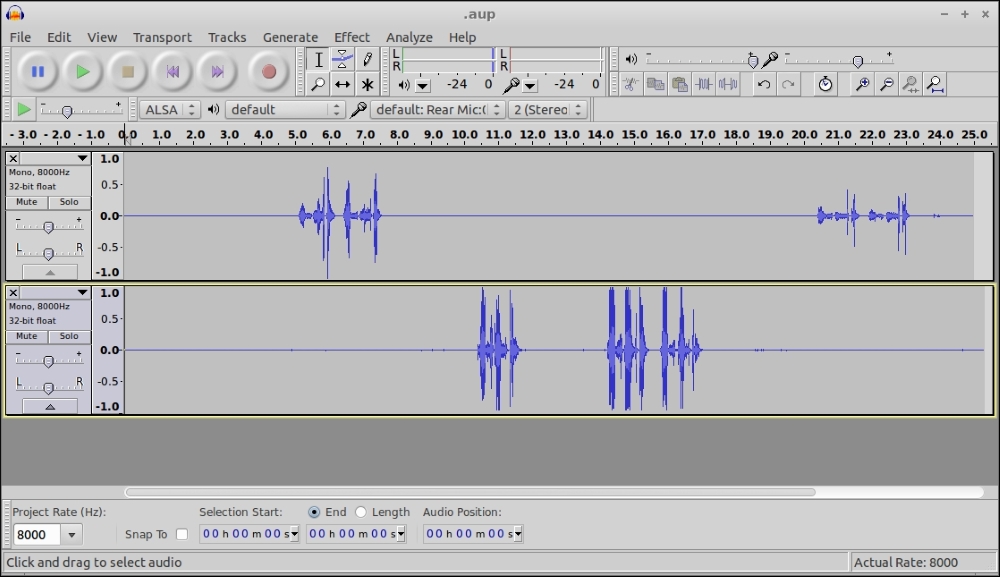
Audio from forward direction of two legs of a call
When talking about Audacity, it is almost natural to mention SoX too, because often you'll need to convert from one audio format to another, change sampling rate, combine channels into mono, and so on. With these, SoX is your friend.
If you know what codec will be used by your calls, then convert all your IVR prompts and music to that format, so FreeSWITCH will not waste CPU processing doing the conversion in real time for each call.
Sometimes MP3 support for SoX is packaged apart from SoX main program, for example, in Debian 8 Jessie you need to install libsox-fmt-mp3 on top of it.
If you know you'll receive an incoming call from an ITSP via G711 a-law (in US would be u-law), you want to convert your stereo MP3 music and your prompts into mono PCMA at 8khz sampling. FreeSWITCH's mod_native_file, compiled and installed by default, will use them directly, without conversion.
sox -V music.mp3 -r 8000 -c 1 -t al -w music.pcma
But you would also often need the converse, for example, to let people "hear" from web or email files recorded by FreeSWITCH callers. They prefer receiving MP3:
sox -V /usr/local/freeswitch/recordings/2015-05-17/test.wav test.mp3