
MATLAB® characters, operators, and commands
Table A1
Operators of scalar, array and matrix arithmetic
| Operator | Description | Location, page |
| + | Addition, scalar and matrix | 12, 32 |
| − | Subtraction, scalar and matrix | 12, 32 |
| * | Multiplication, scalar and matrix | 12, 33 |
| .* | Multiplication, element-wise | 36 |
| / | Right division, scalar and matrix | 12, 35 |
| ./ | Right division, element-wise | 36 |
| Left division, scalar and matrix | 12, 35 | |
| . | Left division, element-wise | 36 |
| ^ | Exponentiation, scalar and matrix | 2 |
| .^ | Exponentiation, element-wise | 36 |
Table A2
Special characters
| Character | Description | Location, page | |
| = | Assignment | 14 | |
| % | Percent; is used for comments and for output format specification | 11, 22 | |
| ( ) | Parentheses; is used for input arguments and in matrix addressing | 11, 30 | |
| No. | Command | Description | Location, page |
| [ ] | Brackets; use for input of the vector, matrix, and array elements | 27 | |
| (space) | Space; separates elements into arrays, and adds into output specifications | 23, 27 | |
| : | Colon; creates vectors, used also for loops iterations and for selecting all array elements | 28, 30, 57 | |
| , | Comma; separates elements into arrays and commands on the same line | 11, 27 | |
| ; | Semicolon; suppresses printing if written after the command. Separates matrix rows and commands on the same line | 11, 27 | |
| . . . | Ellipsis; signs that a long statement to be continued on the next line | 11 | |
| , | Apostrophe; array or matrix transpose quotation mark; is used for a text string generation | 22, 31, 43 | |

Table A3
Relational and logical operators
| Operator | Description | Location, page |
| = = | Equal; element-wise | 51 |
| > | Greater than; element-wise | 51 |
| > = | Greater than or equal to; element-wise | 51 |
| < | Less than; element-wise | 51 |
| & | Logical AND | 53 |
| ~= | Not equal; element-wise | 51 |
| 1 | Logical OR | 53 |
| <= | Lower than or equal to; element-wise | 51 |
| ~ | Logical NOT | 53 |
Table A4
Alphabetical list of commands and predefined variables
| No. | Command | Description | Location, page |
| 1 | abs | Absolute value | 12 |
| 2 | acos | Inverse cosine for angle in radians | 13 |
| 3 | acosd | Inverse cosine for angle in degrees | 14 |
| 4 | acot | Inverse cotangent for angle in radians | 14 |
| 5 | acotd | Inverse cotangent for angle in degrees | 14 |
| 6 | addtodate | Adds quantity to a date | 43 |
| 7 | and | Logical AND | 53 |
| 8 | ans | Last calculated or defined value | 14 |
| 9 | asin | Inverse sine for angle in radians | 13 |
| 10 | asind | Inverse sine for angle in degrees | 13 |
| 11 | atan | Inverse tangent for angle in radians | 14 |
| 12 | atand | Inverse tangent for angle in degrees | 14 |
| 13 | axis | Controls axis scaling and appearance | 77 |
| 14 | bar | Draws a vertical bar on the plot | 105 |
| 15 | barh | Draws a horizontal bar on the plot | 106 |
| 16 | bar3 | Generates 3D vertical bars on the plot | 106 |
| 17 | box on/off | Draws/removes box on the axes | 103 |
| 18 | boxplot | Generates box-whiskers plot | 137 |
| 19 | capaplot | Generates capability plot | 139 |
| 20 | cdf | The cdf for a specified distribution | 125 |
| 21 | chi2gof | Chi-square goodness-of-fit test | 198 |
| 22 | clabel | Labels iso-level lines | 104 |
| 23 | clc | Clear the command window | 11 |
| 24 | clear | Remove variables from the Workspace | 20 |
| 25 | close | Closes one or more Figure Windows | 71 |
| 26 | colormap | Sets colors | 88 |
| 27 | contour | Creates a 2D-contour plot | 104 |
| 28 | contour3 | Creates a 3D-contour plot | 105 |
| 29 | controlchart | Generates control (Shewhart) chart | 141 |
| 30 | cos | Cosine for angle in radians | 13 |
| 31 | cosd | Cosine for angle in degrees | 13 |
| 32 | cot | Cotangent for angle in radians | 13 |
| 33 | cotd | Cotangent for angle in degrees | 13 |
| 34 | cumsum | Cumulative sum of elements | 42 |
| 35 | cylinder | Generates a cylinder | 103 |
| 36 | date | Generates a string with current date | 43 |
| 37 | datenum | Converts date string to the serial number | 43 |
| 38 | datestr | Converts serial date number to the string | 42 |
| 39 | det | Calculates a determinant | 42 |
| 40 | dfittoll | Interface for displaying fit distributions | 180 |
| 41 | diag | Creates a diagonal matrix from a vector | 41 |
| 42 | diff | Calculates a difference, approximates a derivative | 172 |
| 43 | disp | Display output | 21 |
| 44 | disttool | Creates interactive plots of probability distributions | 142 |
| 45 | doc | Displays HTML documentation in the Help Window | 17 |
| 46 | else, elseif | Is used with if; conditionally executes if statement condition | 56 |
| 47 | end | Terminates scope of for, while, if statements, or serves as last index | 29, 56 |
| 48 | erf | Error function | 14 |
| 49 | errorbar | Creates a plot with error bounded points | 96 |
| 50 | exp | Exponential | 12 |
| 51 | eye | Creates a unit matrix | 41 |
| 52 | factorial | Calculates factorial of positive integer n | 13 |
| 53 | figure | Creates the Figure Window | 100 |
| 54 | find | Finds indices of certain elements of array | 53 |
| 55 | floor | Round off toward minus infinity | 13 |
| 56 | for | Is used to repeat execution of command/s | 57 |
| 57 | format | Sets current output format | 20 |
| 58 | fplot | Creates a 2D plot of a function | 100 |
| 59 | fprintf | Displays formatted output | 22, 44 |
| 60 | function | Creates a new function | 160 |
| 61 | fzero | Solves a one-variable equation | 166 |
| 62 | gamma | Gamma function | 14 |
| 63 | global | Declares a global variable | 162 |
| 64 | grid | Adds grid lines | 76 |
| 65 | gscatter | Creates scatter plot with grouping variable | 143 |
| 66 | gtext | Adds a text with the help of the mouse | 78 |
| 67 | help | Displays explanations in the Command Window | 16 |
| 68 | help graph2d | Displays list of 2D graph commands | 99 |
| 69 | help graph3d | Displays list of 3D graph commands | 99 |
| 70 | help specgraph | Displays list of specialized graph commands | 99 |
| 71 | hist | Plots a histogram | 94 |
| 72 | hist3 | Generates 3D histogram of bivariate data | 107 |
| 73 | hold on/off | Keeps current graph open, ends hold on | 72 |
| 74 | i | 20 | |
| 75 | icdf | Inverse cumulative distribution function, specified distribution | 125 |
| 76 | if | Conditionally execute | 56 |
| 77 | inf | Infinity, is produced by dividing by 0 | 19 |
| 78 | input | Prompt to user input | 158 |
| 79 | interp1 | One-dimensional interpolation | 164 |
| 80 | inv | Calculates the inverse matrix | 35 |
| 81 | j | The same as i | 20 |
| 82 | jbtest | Jarque-Bera hypothesis test | 198 |
| 83 | kstest | Kolmogorov-Smirnov goodness-of-fit hypothesis test, single sample | 199 |
| 84 | kstest2 | Kolmogorov-Smirnov goodness-of-fit hypothesis test, two samples | 199 |
| 85 | legend | Adds a legend to the plot | 80 |
| 86 | length | Number of elements in vector | 40 |
| 87 | load | Load data stored in the mat-file | 197 |
| 88 | lillietest | Lilliefors' goodness-of-fit hypothesis test | 200 |
| 89 | linspace | Generates a linearly spaced vector | 29 |
| 90 | log | Natural logarithm | 12 |
| 91 | log10 | Decimal logarithm | 12 |
| 92 | loglog | Generates a 2D plot with log axes | 102 |
| 93 | lookfor | Search for the word in the all help entries | 16 |
| 94 | max | Returns maximal value | 41 |
| 95 | mean | Calculates mean value | 41 |
| 96 | median | Calculates median value | 42 |
| 97 | mesh | Creates a 3D plot with meshed surface | 86 |
| 98 | meshgrid | Creates X,Y matrices for further plotting | 85 |
| 99 | min | Returns minimal value | 41 |
| 100 | NaN | Not a number | 20 |
| 101 | n. . .fit | Fits data for the given distribution | 178 |
| 102 | n. . .pdf | Calculates pdf for the given distribution | 129 |
| 103 | n. . .cdf | Calculates cdf for the given distribution | 129 |
| 104 | n. . .inv | Inverse cdf for the given distribution | 130 |
| 105 | n. . .rand | Generates pseudorandom numbers for the given distribution | 130 |
| 106 | n. . .stat | Calculates mean and variance for the given distribution | 130 |
| 107 | normcdf | Normal cumulative distribution function | 124 |
| 108 | norminv | Inverse of the normal cdf | 124 |
| 109 | normpdf | Normal probability density function | 124 |
| 110 | normplot | Generates normal probability plot | 144 |
| 111 | normspec | Plots normal density between specification limits | 144 |
| 112 | not | Logical NOT | 53 |
| 113 | num2str | Converts numbers to a string | 43 |
| 114 | ode. . . | ODE solver command, general form | 211 |
| 115 | ode113 | Solves non-stiff ODEs | 209 |
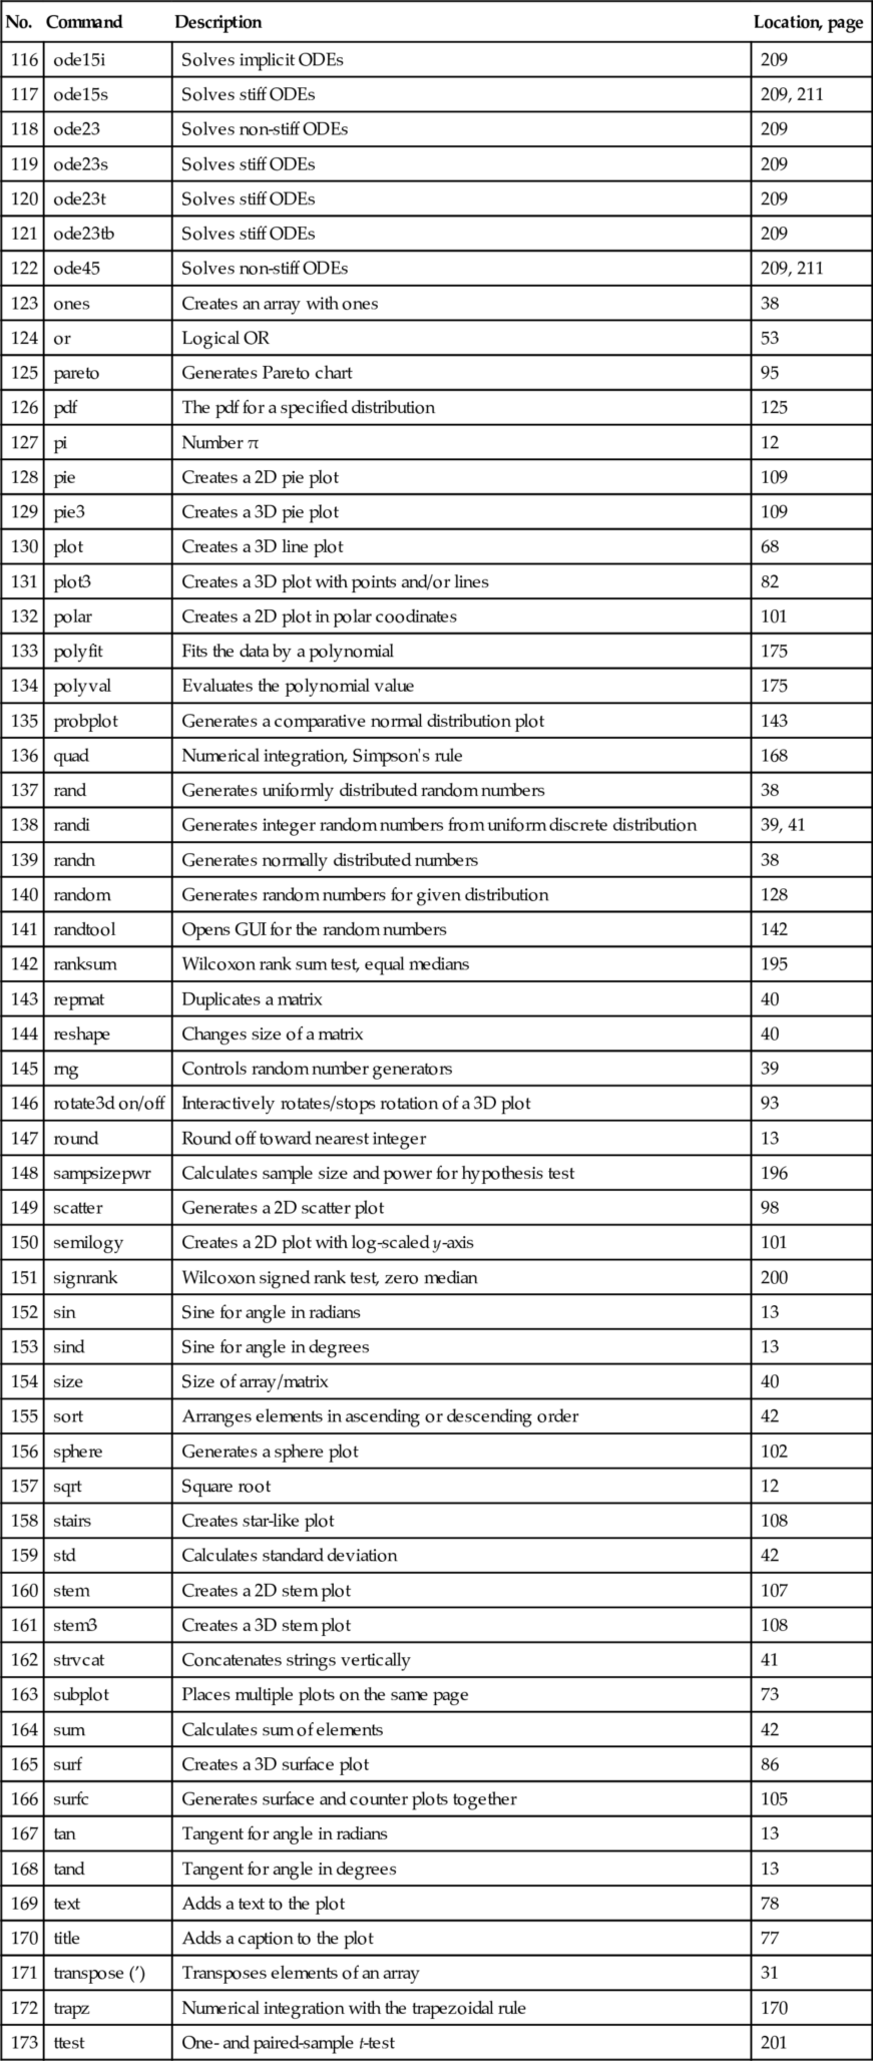
| 116 | ode15i | Solves implicit ODEs | 209 |
| 117 | ode15s | Solves stiff ODEs | 209, 211 |
| 118 | ode23 | Solves non-stiff ODEs | 209 |
| 119 | ode23s | Solves stiff ODEs | 209 |
| 120 | ode23t | Solves stiff ODEs | 209 |
| 121 | ode23tb | Solves stiff ODEs | 209 |
| 122 | ode45 | Solves non-stiff ODEs | 209, 211 |
| 123 | ones | Creates an array with ones | 38 |
| 124 | or | Logical OR | 53 |
| 125 | pareto | Generates Pareto chart | 95 |
| 126 | The pdf for a specified distribution | 125 | |
| 127 | pi | Number π | 12 |
| 128 | pie | Creates a 2D pie plot | 109 |
| 129 | pie3 | Creates a 3D pie plot | 109 |
| 130 | plot | Creates a 3D line plot | 68 |
| 131 | plot3 | Creates a 3D plot with points and/or lines | 82 |
| 132 | polar | Creates a 2D plot in polar coodinates | 101 |
| 133 | polyfit | Fits the data by a polynomial | 175 |
| 134 | polyval | Evaluates the polynomial value | 175 |
| 135 | probplot | Generates a comparative normal distribution plot | 143 |
| 136 | quad | Numerical integration, Simpson's rule | 168 |
| 137 | rand | Generates uniformly distributed random numbers | 38 |
| 138 | randi | Generates integer random numbers from uniform discrete distribution | 39, 41 |
| 139 | randn | Generates normally distributed numbers | 38 |
| 140 | random | Generates random numbers for given distribution | 128 |
| 141 | randtool | Opens GUI for the random numbers | 142 |
| 142 | ranksum | Wilcoxon rank sum test, equal medians | 195 |
| 143 | repmat | Duplicates a matrix | 40 |
| 144 | reshape | Changes size of a matrix | 40 |
| 145 | rng | Controls random number generators | 39 |
| 146 | rotate3d on/off | Interactively rotates/stops rotation of a 3D plot | 93 |
| 147 | round | Round off toward nearest integer | 13 |
| 148 | sampsizepwr | Calculates sample size and power for hypothesis test | 196 |
| 149 | scatter | Generates a 2D scatter plot | 98 |
| 150 | semilogy | Creates a 2D plot with log-scaled y-axis | 101 |
| 151 | signrank | Wilcoxon signed rank test, zero median | 200 |
| 152 | sin | Sine for angle in radians | 13 |
| 153 | sind | Sine for angle in degrees | 13 |
| 154 | size | Size of array/matrix | 40 |
| 155 | sort | Arranges elements in ascending or descending order | 42 |
| 156 | sphere | Generates a sphere plot | 102 |
| 157 | sqrt | Square root | 12 |
| 158 | stairs | Creates star-like plot | 108 |
| 159 | std | Calculates standard deviation | 42 |
| 160 | stem | Creates a 2D stem plot | 107 |
| 161 | stem3 | Creates a 3D stem plot | 108 |
| 162 | strvcat | Concatenates strings vertically | 41 |
| 163 | subplot | Places multiple plots on the same page | 73 |
| 164 | sum | Calculates sum of elements | 42 |
| 165 | surf | Creates a 3D surface plot | 86 |
| 166 | surfc | Generates surface and counter plots together | 105 |
| 167 | tan | Tangent for angle in radians | 13 |
| 168 | tand | Tangent for angle in degrees | 13 |
| 169 | text | Adds a text to the plot | 78 |
| 170 | title | Adds a caption to the plot | 77 |
| 171 | transpose (’) | Transposes elements of an array | 31 |
| 172 | trapz | Numerical integration with the trapezoidal rule | 170 |
| 173 | ttest | One- and paired-sample t-test | 201 |
| 174 | ttest 2 | Two-samples test | 201 |
| 175 | tinv | inverse cdf of Students' t | 181 |
| 176 | ver | Displays versions of the MATLAB products | 18 |
| 177 | view | Specifies a viewpoint for 3D graph | 89 |
| 178 | while | Repeats execution of command/s | 57 |
| 179 | who | Displays variables stored in the Workspace | 20 |
| 180 | whos | Displays Workspace variables and additional information about the variables | 20 |
| 181 | xlabel | Adds a label to x-axis | 77 |
| 182 | ylabel | Adds a label to y-axis | 77 |
| 183 | zeros | Creates an array with zeros | 38 |
| 184 | zlabel | Adds a label to z-axis | 83 |
| 185 | ztest | One-sample Z-test | 201 |


..................Content has been hidden....................
You can't read the all page of ebook, please click here login for view all page.