9
Measuring ROI in a Sales Program: A Web-Based Learning Solution
Financial Services Company
Lizette Zuniga
![]()
Abstract
This case study focuses on the ROI of an e-learning sales program. Several aspects of this project warrant sharing it with others. It includes competency modeling, competency assessment, and evaluation components for the sales academy at a large midwestern company in the financial services industry, all while undergoing a large merger integration. The learning group enlisted the assistance of an external consultant to provide consultation for the competency development and evaluation aspects. This study outlines the business need for the intervention, e-learning program, and evaluation plan, including how data were collected and analyzed. It concludes with the results from implementing the e-learning program as well as lessons learned.
PERFORMANCE AND BUSINESS NEEDS
![]()
A large midwestern company in the financial services industry implemented a revised sales program in its sales academy. There were three drivers for the revised program. First, the learning group identified the knowledge requirements and critical skills for their business and documented key competencies required to move the business forward. Not only did the content of the sales academy need to be revised to match the new competencies, but the time spent in training needed reviewing. Second, the former sales academy consumed three weeks of the new hires’ time. A significant impetus for the e-learning version of the sales academy was the need to reduce the amount of time spent in training and get sales associates generating sales earlier in their tenure. Finally, the company was in the process of acquiring a large company and wanted to capitalize on cross-selling its products. This meant that sales associates needed to increase knowledge of all the products and develop new transactions with existing customers.
Two additional considerations were a new product launch and the fact that the call center was undergoing customer service training, which could affect customer satisfaction. An audience analysis confirmed that e-learning was an appropriate medium for the sales associates. The analysis showed that there were 3,000 sales associates scattered throughout the United States and more than 200 other countries. Many of those associates were remote employees. As road warriors, they used laptops with company intranet connections.
THE E-LEARNING SOLUTION
![]()
The learning group enlisted an external consultant to assist with competency modeling, competency assessment, and evaluation components of this project. Additional outsourcing assistance was obtained to develop web-based training.
The e-learning program was designed to improve the skills in the following seven competencies: general sales skills, technical knowledge of the products, customer focus skills, prospecting, negotiating, managing resistance, and gaining business results. A basic sales skills segment permitted the associates to test their foundational skill level. Refresher content guided the learners through specific competencies before moving into the remaining sales topics.
The assessment provided immediate input on strengths and areas of improvement for each member of the sales team. This information was tracked in a database and triggered an automatic individual development plan to improve skills in the seven competencies. The skill-gap assessment, coupled with the e-learning design, allowed individual sales associates to customize their learning experience. If the sales associate already had strengths in negotiating skills, then the program allowed the learner to bypass negotiating skills and focus on specific areas needing improvement.
EVALUATION PLAN AND OBJECTIVES
![]()
The learning management system (LMS) was the primary vehicle used to launch, score, and track the modules and evaluations. At the close of each module, the learner was triggered to automatically complete a Level 1 evaluation. Figure 9-1 presents the full data collection plan.
FIGURE 9-1. Data Collection Plan

The goal for satisfaction was set for an average rating of 90 percent. Mastery learning checks (Level 2) were embedded in the design of the e-learning modules. The learner was required to complete the mastery checks before completing the module. A goal of 85 percent correct was set for the mastery checks. Pre- and post-training skill-gap assessments (Level 3) were administered online to measure and track the level of sales competencies among the sales associates. A minimum score for the post-training skill assessment, administered three months after training, was set for 80 percent. Other performance and business impact measures, which were tracked in an online sales workforce database, included the following:
• ability to contact 10 new prospects and conduct needs assessment on those prospects within a week after attending the sales academy
• number of sales proposals that the sales associates generated based on the assessments within 30 days
• number of new accounts opened
• weekly amount of dollars earned from sales in the first four weeks after sales academy
• monthly amount of dollars earned from sales thereafter
• number of customers retained out of total customer load
• dollar amount gained from new accounts
• reduction of time spent in training
• amount gained from cross-selling products (new initiative).
Figure 9-2 presents the ROI analysis plan. To isolate the impact of the e-learning program, participants and their managers were asked to estimate the impact of the e-learning program on the business results. Confidence levels for estimates were used to adjust for any indecision.
Program Cost
The total cost of the former sales academy was $18,890,800. This included analysis, design, marketing, delivery, evaluation, and overhead costs. Each sales associate already had an assigned personal laptop, and the company had already purchased an LMS; nevertheless, a proportionate amount of the hardware and software was allocated to this project. The costs of the program are illustrated in Table 9-1.
FIGURE 9-2. ROI Analysis Plan

TABLE 9-1. E-Learning Cost Tabulation Worksheet


E-LEARNING PROGRAM RESULTS
![]()
As a result of the new e-learning program, the number of hours spent in training were cut from 105 hours to 49 hours per sales associate. Annual earnings show a revenue increase of approximately 13 percent. One-year tracking showed the following: Within a week after attending the sales academy, sales associates were contacting 10 new prospects and conducting needs assessment 80 percent of the time; the number of sales proposals that the sales associates generated based on those analyses within 30 days increased 22 percent; the number of new accounts opened increased 32 percent; and the number of customers retained increased 8 percent.
Intangible benefits included improved customer satisfaction and retention. There was also a notable increase of motivation among the sales associates (Table 9-2).
TABLE 9-2. Level 4 Results of the Sales Academy Program
| Level 4 Evaluation Item | Results |
| Hours reduced in training per sales associate | 56-hour reduction |
| Annual revenue | 13 percent increase |
| New prospects contacted | 10 per week |
| Needs assessment conducted | 80 percent of the time |
| Number of sales proposals generated based on those analyses within 30 days | 22 percent increase |
| Number of new accounts opened | 32 percent increase |
| Number of customers retained | 8 percent increase |
| Dollars earned from new accounts | 19 percent increase ($20,000,000 to $23,800,000) |
| Dollars earned from cross-selling | $120,000,000 |
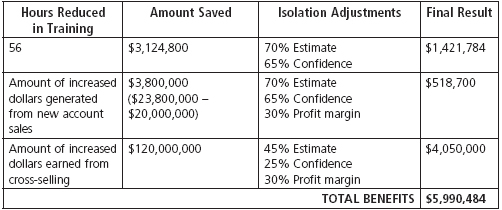
The amount of dollars earned from new account sales increased 19 percent, from $20,000,000 to $23,800,000. Participants and their managers estimated that the revised sales academy contributed to 70 percent of the new account sales with a confidence level of 65 percent. The amount gained from cross-selling was $120,000,000. The participants and their managers estimated that the revised sales academy contributed to 45 percent of the cross-selling earnings with a confidence level of 25 percent. The two revenue figures were converted to profit margin using a 30 percent margin rate, according to the financial averages of the company (Table 9-3).
TABLE 9-3. Benefits Adjusted for Isolation and Confidence Estimates

An ROI of 19.9 percent means that for every $1 invested in the program, there is a return of $1.20 in net benefits, after costs are covered. These benefits are representative of annual benefit, showing the amount saved or earned for one year following the launch of the e-learning sales academy program. The benefits will continue after the first year and are likely to increase in the case of this program. Although the impact sometimes decreases in traditional learning settings after the first year, this is not always true for e-learning programs. Given the up-front technology and development expenses in e-learning, the benefits may increase significantly after year one.
This case study shows annual benefits, but ROI practitioners should consider the multiyear impact of e-learning programs. Accountants frequently use depreciation and amortization to spread out the costs of assets during the years a company intends to use the assets. Companies often use a conventional straight-line method of depreciation, which depreciates the same amount of cost each year rather than depreciating more during the first few years after the purchase of a major asset. Overall, the straight-line method results in lower expenses, and, consequently, higher profits in the first few years after the purchase. Another method—particularly for technology investments—is the accelerated method. It is strongly recommended to partner with the financial analyst to follow the preferred method of depreciation. When considering long-term impact, the shelf life of the e-learning program in its current format must be determined.
COMMUNICATION OF RESULTS
![]()
Communication of the results is a critical step in the ROI process. It is also important to remember to customize communication according to the needs of the recipient. This particular study required three different forms of reporting. Figure 9-3 outlines the medium and the target audience for communicating of the ROI results from this study.
FIGURE 9-3. Communication Plan for Evaluation Reporting
| Communication Approach | Recipient of Communication |
| Detailed report of the ROI study |
• Project sponsor • Project team |
| Executive summary |
• Executive team • Program participants |
| Summary of findings |
• Future participants • Future managers |
LESSONS LEARNED
![]()
The process of designing and evaluating an ROI study is not all smooth sailing. In fact, there are several areas to highlight as lessons learned in the hope that other ROI practitioners can learn and avoid unnecessary work in their projects:
1. Get early executive support. The HR or learning group often feels ownership of employee development processes and is hesitant to let them be developed independently. Initial barriers occurred because of putting the project ahead of collaboration. Early partnership and consensus building is critical to the success of the project. Without the early and intermittent involvement of key business executives, the project is doomed to failure.
2. Partner with the financial analyst within the client organization. This partnership provides the ROI practitioner with a couple of advantages: First, it helps establish credibility from the CFO organization early in the project, and second, it helps the ROI practitioner learn about the preferred method of depreciation.
3. It is helpful if the project team is cross-functional. Early credibility suffered during this project because it was initially seen as another HR initiative. Create a project team that comprises the right mix of functional representatives and skills to complete the study in a timely and credible manner.
4. Enlist an expert in the ROI process. Whether internal or external, these skills are a must for developing a credible ROI study. Without such expertise, confidence levels could weaken.
QUESTIONS FOR DISCUSSION
![]()
1. What steps would you take to ensure executive support in your ROI project?
2. What accounting approach does your company take when calculating the costs of assets during the years a company intends to use the assets?
3. Would you have shown the results in terms of annualized benefits from a single year or multiple-year results?
4. How could you ensure that you had the right mix of team members (skills and function) on your project team?
5. Are there other impact measures that you would have included in this study?
6. What would you have done differently in this study?
ABOUT THE AUTHOR
![]()
Lizette Zuniga, PhD, presently serves as vice president of ROI implementation for the ROI Institute. With more than 10 years of professional experience, Zuniga has expertise in leadership and organizational development, learning and development, survey design, and ROI. She facilitates certification courses for ASTD in Measuring & Evaluating Learning and ROI Skill Building. She also serves as faculty on the United Nations System Staff College. Zuniga holds an MS degree in psychology from Georgia State University, and a PhD in leadership and HRD from Barry University. She is certified in the ROI Methodology and has authored and co-authored several articles and books about the application of the ROI Methodology. She can be reached at [email protected].