
11
Measuring ROI in an Upgrade Selling Program: A Mobile Learning Solution
Transoft Inc.
Jack J. Phillips and Patti P. Phillips
![]()
Abstract
This project involves a mobile learning application for sales associates of a large software firm specializing in software solutions for the trucking industry. Sales associates were provided a mobile learning solution for their iPads, designed to describe and sell an upgrade to its most popular software product. Although the release occurred at the same time for all sales associates, not all of them logged onto the learning portal through their iPads, which allowed an opportunity for a comparison group. This case study highlights the key issues in calculating the impact and ROI of a mobile learning solution on business results. The case is arranged in a multiple part format to allow readers to experience the issues and recommended actions and solutions.
BACKGROUND
![]()
Organizational Profile
Transoft is one of the largest software companies for the trucking industry. With more than 12,000 users, Transoft dominates the trucking landscape. Transoft provides software solutions for carriers, brokers, logistics companies, and shippers. A variety of software solutions are available, including products for financial operations, fleet management, document systems, dispatch operations, freight management, and broker management. Its most popular software, ProfitPro, integrates a variety of software solutions, all aimed at improving the efficiency and profitability of the trucking company. The trucking industry is highly competitive, often producing low margins. Having an efficient operation is usually the difference in profit or loss. ProfitPro has a reputation for helping trucking companies meet profit goals.
Situation
Transoft has an extensive network for sales and marketing, with more than 200 sales associates serving all of North America. Sales associates are strategically located across the United States and most work from their homes. Bringing sales teams into three regional offices for training has become a thing of the past, unless extensive formal development of new sales associates is needed.
Transoft has just completed an upgrade on its most popular software, ProfitPro, and has released it to the sales team to begin selling the upgrades. An upgrade costs the client from $1,000 to $3,000, depending on the scope of operations. For the client, the upgrade provides some new features and streamlines some of the previous processes. It should help make clients more profitable by reducing the time to complete certain documents, ensuring on-time filing, reducing invoicing errors, and improving other operating efficiencies.
Solution
The learning and development team agreed on a solution that would involve a mobile learning application directly accessible on an iPad. Previously, sales teams were furnished with iPads for work. With five modules, the program would take about two hours to complete, which would prepare a sales rep to sell the upgrade. The specific modules include:
• rationale for the upgrade
• key features of the upgrade
• how the upgrade will increase profits (time savings, quality improvements, and productivity)
• pricing options
• implementation and support.
Each module contains tools to check learning and to encourage and plan for application. In addition, brief summaries of each module are produced for review just before meeting a client. The program provides an integration with Salesforce.com to set up appointments with customers to discuss the upgrade. This feature identifies the target clients, listed by potential sales volume. It also develops the pricing options based on the client’s use of ProfitPro. Modules were designed to develop an understanding of the upgrades and to assist, encourage, and even require a sales associate to sell the upgrade.
A mobile solution was selected because of its flexibility, convenience, and cost. It was not feasible to train the sales force in face-to-face workshops. A half-day workshop would have required sales associates to lose an average of a day at work, and more than 80 percent of them would have incurred travel costs. A mobile solution was not only ideal for this type of program, but it was the only way to go from an economic and convenience perspective.
Rationale for ROI
Although mobile learning appeared to be the only feasible solution in terms of cost, time, and convenience, the management team wanted to know whether it was working, perhaps at the same level as a face-to-face workshop. Executives wanted an evaluation that would show how well the program was working, how quickly it was working, and what issues were inhibiting the success of this type of learning. While executives were convinced that this approach was necessary for a diverse sales force scattered around the country, there was still a nagging concern about the effectiveness of mobile learning programs. Although they would see the sales numbers, they wanted to know more in terms of costs versus benefits. The learning team was challenged not only to secure data but also to evaluate the program up to and including the financial ROI. They insisted that the analysis should be credible, separating the influence of this program from the special promotion for the upgrade.
Exercise
1. Is this level of accountability typical? Please explain.
![]()
2. What do you think the broad objectives should be at each level?
Reaction
![]()
Learning
![]()
Application
![]()
Impact
![]()
ROI
![]()
OBJECTIVES
![]()
After the decision was made to go with the program, the next step was to develop the detailed objectives at all five levels. This step was completed with input from a project manager, a sales manager, and subject matter experts. At Level 1, it was decided that participants should see this program as relevant to their work and important to their success. It should have content that they intended to use and that they would recommend to others.
In terms of learning, a self-assessment on the five modules included a simple true/false quiz at the end of each module. Each module had five questions, representing 25 questions total. A participant should score at least 20 out of 25, allowing for one missed question for each module. The score would not be punitive as there would not be any consequences for missing the desired score. This was only a gauge for participant success, as they immediately saw the correct answers with an explanation. Sales associates were encouraged to repeat the exercise if they scored less than four out of five correct answers for each module.
For application, the objectives focused on sales associates using the skills quickly and to make the first scheduled call within a week of completing of the program. By the end of the month, the goal was to see routine use of each of the major tasks, actions, or skills from the five modules.
For business impact, sales should occur within three weeks of program completion, and the associates should reach $10,000 in sales per month within three months. This was suitable to the management team and should result in success for the program.
For the Level 5 objective, a 20 percent ROI was set. This is slightly above what Transoft would use for capital expenditures (for example, the headquarters building), and it would seem reasonable to executives. The objective was the minimum acceptable performance, not only for this level of ROI, but for the other levels as well.
Exercise
Based on these objectives, what is your recommended approach for data collection and analysis? Please complete the data collection plan and the ROI analysis plan for this program. See Figures 11-1 and 11-2.
FIGURE 11-1. Data Collection Plan

FIGURE 11-2. Action Plan

PLANNING
![]()
Data Collection Plan
The evaluation planning meeting was conducted with the program manager, the designers and developers who were on contract, and the project manager for the program. In addition, the evaluator moderated the meeting. In this case, the evaluator was an external consultant who was conducting the ROI study. Figure 11-3 is the data collection plan, which details the methods, source, and timing for collecting data at four levels. Level 1 and 2 data were captured in the system as the participants completed five modules in the mobile learning program. Level 3 was a web-based questionnaire with simple questions. To achieve a good response rate, 20 techniques were used, which are shown in Table 11-1. Level 4 impact data were retrieved directly from the Salesforce.com system at Transoft.
TABLE 11-1. Techniques to Increase Response Rates
1. Provide advance communication.
2. Communicate the purpose.
3. Identify who will see the results.
4. Describe the data integration process.
5. Let the target audience know that they are part of a sample.
6. Design for simplicity.
7. Make it look professional and attractive.
8. Use the local manager’s support.
9. Build on earlier data (Level 1 and 2).
10. Pilot test the questionnaire.
11. Recognize the expertise of participants.
12. Have an executive sign the introductory letter.
13. Send a copy of the results to the participants.
14. Report the use of results.
15. Introduce the questionnaire during the program (first and last module).
16. Use follow-up reminders.
17. Consider the appropriate medium for easy response.
18. Estimate and report the necessary time needed to complete the questionnaire.
19. Show the timing of the planned steps.
20. Collect data anonymously or confidentially.
FIGURE 11-3. Completed Data Collection Plan


ROI Analysis Plan
Figure 11-4 shows the ROI analysis plan, which is straightforward for this type of analysis. The two business measures collected were the monthly sales per associate for the upgrade and the time for the first sale. The method of isolation was a comparison group method—a classical experimental versus control group method. As a fallback, participant estimates would be used to sort out the effects of this program. During the evaluation meeting, there was discussion about the possibility of setting up the comparison group. Based on previous experience, some of the sales team might not use the module for several weeks, or at all, depending on their schedules, their interest in the upgrade, and their eagerness to learn through mobile technology. At the same time, some will get involved immediately. Given this situation, there could be an opportunity for a comparison group. Also, it is helpful to know that some, if not all, would sell the upgrade without taking part in the mobile learning program. They would flip through the brochure and attempt to make the sale—and succeed in doing so. The challenge was to match the first 25 users with a corresponding group of nonusers. Because of timing (when they might have started the program) the matching group would be larger so that, as users logged in, they would be dropped out of the control group. This was the best shot at having a comparison group, and the planning team realized at the onset that it might not work. Consequently, participant estimates were used as a backup, adjusted for error.
Converting data to money was very easy. The sales were adjusted with the profit margin for the new product. This was developed by the product launch team and was actually known to the sales force. For this upgrade, the margin was 20 percent. The time for sale was a measure that was monitored but not converted to data. This sales data actually would be included in the overall sales and to include them again would be double counting the sales. The cost categories are routine and listed in the figure, including a small prorated cost for the iPads and the design and development cost prorated for the 25 participants. The expected intangibles included customer satisfaction and engagement, job satisfaction for the sales team, brand awareness, reputation of the company, and stress reduction for sales associates. The individuals who needed to see the results were the complete sales team, sales managers (including the vice president of sales and vice president of marketing), the participants who provided the data, and their immediate managers.
FIGURE 11-4. Completed ROI Analysis Plan

RESULTS
![]()
The first 25 people signed up within three days of the program’s announcement. Level 1 reaction data were collected at the end of the fifth module and are presented in Table 11-2. Reactions were as expected, with the exception of intent to use, which was very high.
Level 2 learning seemed appropriate, and quiz scores were above targets, as shown in Table 11-3. Scores were slightly lower than desired for the quiz for implementation and support. This was not a huge concern, as this information is clearly in the documents and the product brochures.
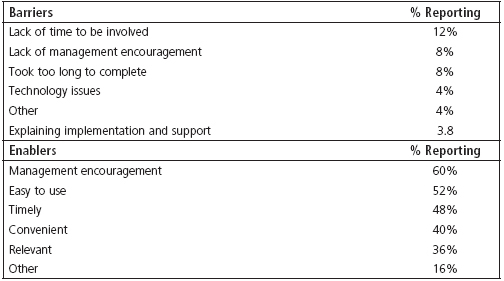
Level 3 application data seemed to be on track as shown in Table 11-4. Identifying pricing options and explaining implementation and support were off a little, but overall the objectives were met. The time for the first call was below the objective, which was very good. As expected, there were some barriers and enablers to success, as shown in Table 11-5. The barriers were minimal. However, there was a concern that 9 percent of sales associates were not encouraged by their managers to use the program. As expected, the number one enabler was management encouragement.
TABLE 11-2. Reaction Results

TABLE 11-3. Learning Results

TABLE 11-4. Application Results

TABLE 11-5. Barriers and Enablers
Isolating the Effects of the Program
An important and perhaps the most challenging issue was to determine the effects of this program from other influences. The best way to do this was to use a classic experimental versus control group, although that became tricky with this program and it was questionable whether or not it would work throughout the program. At first, 25 sales associates were selected based on the first 25 to complete the modules. This was accomplished within the first three days. This group of 25 was matched to a group of other sales associates. The first challenge was finding an appropriate match; the second was to have enough remaining in the control group, since they drop out of the experiment when they complete the program. Some people would wait weeks or months to take the program, or they would choose not to take it at all. And some dropouts are a reality when mobile learning is left entirely up to the individual. Instead of forcing participants to use the program, the team wanted the program to be taken voluntarily. The communication for the program, which emphasized that learning is needed in order to sell this upgrade properly, was presented in hopes that this plea would cause them to sign up.
To select the control group, the factors that should affect sales were considered. The four most important considerations were:
1. current sales level, on an annual basis
2. tenure with the company
3. performance rating in human resource system
4. total selling experience.
Although the fourth item was a little more difficult to determine because it counted selling experience in other companies, a quick review of human resource records revealed the total number of years of selling experience. Given these factors, more than 80 associates matched with the 25 in the trial group. Fifty of those were selected randomly as the control group, recognizing that some of them may drop out of the control group when they started this mobile learning program.
Impact Results
Table 11-6 shows the impact data comparing the experimental group of 25 sales associates with the control group of 22. As expected, almost every one of the control group (19 of 22) was actually selling the upgrade though not participating in the program, but the difference of the two groups was very impressive. The difference for that second month is then annualized, producing an annual improvement of $1,140,000. The time of the first sale was impressive for the group involved in the program—11 days compared to 21 days for the control group.
TABLE 11-6. Sales Data in Three Months After Launch

Comparing Data to Money
Converting data to money was easy. As outlined on the ROI analysis plan, the profit margin had to be used. This new upgrade had a predicted profit margin of 20 percent, and this value was used in the analysis. This yields a monetary value of $228,000. The time of the first sale was not converted to money, as that sale was actually already in the total sales number.
Cost
As shown in Table 11-7, the fully loaded costs were included to make the ROI calculation credible. The initial needs assessment represented very little cost, because the need was precipitated by the new product and the solution was dictated by the time and cost constraints. A charge of $3,000 was estimated for the time to pin down needs. The design and development cost was estimated to be $56,000. This amount was prorated over the evaluation for the 25 participants. To be conservative, it was assumed that half the sales team (110) would not use the program. The design and development cost per participant was $509, resulting in $12,725 for 25 participants. The project manager’s time was included, as was time for participant involvement. Although many sales associates complete technology-based learning on their own time, this program was planned for use during regular work hours between calls or just before calls. In sales, work hours can be anytime. A conservative estimate was two hours per associate, recognizing that some of them completed the program on their own time. Some cost was prorated for the use of the iPad, albeit minor as the iPad is used for other purposes. An external evaluation was used in order to ensure objectivity, which created a high evaluation cost. Still, this evaluation will suffice for the entire sales force, although it’s for the sample. Also, internal evaluation would have cost about $5,000. When costs and monetary benefits are combined, the benefit-cost ratio and ROI can be calculated.
TABLE 11-7. Costs

Exercise
1. Calculate the BCR and ROI below.
BCR =
ROI =
2. What should the approach be to communicate the results to the appropriate audiences?
Figure 11.5 shows the benefit/cost ratio and the ROI calculation. As anticipated, results exceed the ROI objective.
FIGURE 11-5. BCR and ROI Calculations

Intangible Benefits
In addition to the tangible sales increase converted to money, several intangibles were connected to the program, as presented in Table 11-8. Receiving the first sale within the time period is intangible, because it was not converted to money and used in the calculation (this would be double counting). In addition, the other intangibles are connected to the program as indicated on the questionnaire distributed for Level 3 data. This questionnaire contained an extra question about the extent to which this program influenced these measures. At least five participants had to rate 3 or more on a 5-point scale. There is no neutral point on a scale.
TABLE 11-8. Intangible Benefits
• Made the first sale in 11 days, average
• Customer satisfaction
• Brand awareness for ProfitPro
• Job satisfaction of sales associates
• Stress reduction for sales associates
• Reputation of company
COMMUNICATING RESULTS
![]()
Because this project was very successful, communicating its results was not difficult. At first there was a briefing with an executive who asked for the ROI study. The 30-minute briefing provided an opportunity to see the power of mobile learning technology and how it could affect business measures.
Data were sent to the 25 participants, along with their immediate managers, within three weeks of data collection. Also, some minor adjustments were made to the program as a result of the evaluation. These were announced in the same communication.
An executive summary of the evaluation was provided to all sales associates to show them the success of the program and to entice others to get involved in this and future programs.
A brief article (about 1,000 words) was placed in the company newsletter for all employees to read. Results were presented at a technology-based learning conference as a case study. All sales and support managers received an executive summary. The learning and development team received a full copy of the study, along with a two-hour workshop.
RECOMMENDATIONS
![]()
Some barriers to success were underscored. These barriers led to minor adjustments to the program, including a reduction from four hours to three hours and 15 minutes. Also, support for the program was strengthened.
LESSONS LEARNED
![]()
This study results in several important lessons.
1. Early planning was crucial, before any design and development took place. Had the team waited until the program was designed, developed, and implemented before planning the evaluation, it would have been incomplete.
2. The objectives gave the designers, developers, and participants the proper focus. There was no mystery about what was expected of participants.
3. The control group versus experimental group method was the best one for isolating the effects of the program; however, there were some concerns about the matching of the groups. The problem with the approach of matching groups was that the evaluation team was at the mercy of the time when participants signed up for the program. If everyone were required to participate, the matching group technique would not work, and other processes would be involved.
QUESTIONS FOR DISCUSSION
![]()
1. Is this study credible? Please explain.
2. What other methods might be used to isolate the effects of the program? Please explain.
3. What other ways could data collection be accomplished? Please explain.
4. Is the three-month follow-up for impact data appropriate? Please explain.
5. Was a year of impact data appropriate? Please explain.
6. How should this data be presented to management in terms of sequencing, emphasis, and approach?
7. Could this study be replicated? Please explain.
ABOUT THE AUTHORS
![]()
Jack J. Phillips, Phd, is a world-renowned expert on accountability, measurement, and evaluation. Phillips provides consulting services for Fortune 500 companies and major global organizations. The author or editor of more than 50 books, he conducts workshops and presents at conferences throughout the world.
His expertise in measurement and evaluation is based on more than 27 years of corporate experience in the aerospace, textile, metals, construction materials, and banking industries. This background led Phillips to develop the ROI Methodology— a revolutionary process that provides bottom-line figures and accountability for all types of learning, performance improvement, human resource, technology, and public policy programs.
Phillips has undergraduate degrees in electrical engineering, physics, and mathematics; a master’s degree in decision sciences from Georgia State University; and a PhD in human resource management from the University of Alabama. He has served on the boards of several private businesses—including two NASDAQ companies—and several nonprofits and associations, including the American Society for Training & Development and the National Management Association. He is chairman of the ROI Institute, Inc., and can be reached at 205.678.8101, or by email at [email protected].
Patti Phillips, PhD, is president and CEO of the ROI Institute, Inc., the leading source of ROI competency building, implementation support, networking, and research. A renowned expert in measurement and evaluation, she helps organizations implement the ROI Methodology in 50 countries around the world.
Phillips’s academic accomplishments include a PhD in International Development and a master’s degree in public and private management. She is a certified in ROI evaluation and has been awarded the designations of Certified Professional in Learning and Performance and Certified Performance Technologist. Patti Phillips can be reached at [email protected].