Past Stack Trace
When we look at a stack trace in a memory dump, we see only the current thread execution snapshot of function calls. Consider this stack trace, for example, from Spiking Thread (Volume 1, page 305):
0:000> k
Child-SP RetAddr  Call Site
00000000`0012d010 00000000`76eb59ed App!WinMain+0x1eda
00000000`0012f7c0 00000000`770ec541 kernel32!BaseThreadInitThunk+0xd
00000000`0012f7f0 00000000`00000000 ntdll!RtlUserThreadStart+0x1d
By looking at Rough Stack Trace (page 39) we may be able to reconstruct Past Stack Trace of what had happened just before the memory snapshot was taken:
0:000> k
Child-SP RetAddr  Call Site
00000000`0012cfd8 00000000`76fd9e9e user32!ZwUserGetMessage+0xa
00000000`0012cfe0 00000000`ffd91a8c user32!GetMessageW+0x34
00000000`0012d010 00000000`76eb59ed App!WinMain+0x1dca
00000000`0012f7c0 00000000`770ec541 kernel32!BaseThreadInitThunk+0xd
00000000`0012f7f0 00000000`00000000 ntdll!RtlUserThreadStart+0x1d
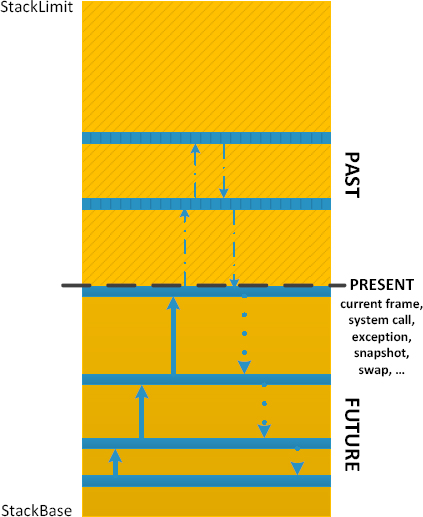
The stack region “time” zones are illustrated on the following picture:

The “Future” zone takes its name from the not yet executed returns. Of course, each stack subtrace generates its own partition. A similar version of this pattern was first introduced in Debugging TV Frames episode 0×24. You can watch the video8 and find source code, WinDbg logs, and presentation on Debugging TV web site9.
..................Content has been hidden....................
You can't read the all page of ebook, please click here login for view all page.
