Introducing the New IDE
If your main programming experience has been in Visual Basic 6.0 or earlier, the new Visual Studio .NET IDE will seem a little alien to you. As an evolution from the previous version of Visual Studio, the interface has more in common with Visual C++ 6.0 than with Visual Basic, but all of the features you need (and more) are there. When you first fire it up, Visual Studio will attempt to customize itself based on your background and preferences by asking you to select the appropriate “profile.” The choices include several that may be useful for a Visual Basic developer, such as the aptly named ”Visual Basic Developer” profile or even the “Visual InterDev Developer” profile. The real trick is to make sure you choose the Keyboard Scheme for Visual Basic 6, otherwise all of your memorized keyboard functions won't work inside Visual Studio .NET.
For now, choose the Visual Basic Developer profile, and you can come back to this page later to change these settings if you want. Click the Projects tab (along the top of the Web page) to leave the profile settings page. What you are currently looking at is the main work area of the Visual Studio IDE, a general location that holds a variety of content, such as code that you are editing or Web pages that you are designing. It also includes a built-in Web browser, which is used to display help and other HTML content.
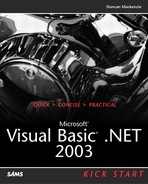
On the home page (see Figure 1.6), you have several useful options. The first tab, Projects, is the page that will be shown whenever you open Visual Studio. Designed as a launching pad for your work, this page provides both a list of recently opened projects and a link to create a new project, enabling you to get going with a single click somewhere on this page. For now, choose the Online Resources tab at the top of this page.
Figure 1.6. The home page provided by Visual Studio gives a functional view of projects you have recently opened.
Once you get to the Online Resources page, navigational options appear along the left side of the page. These options include the following:
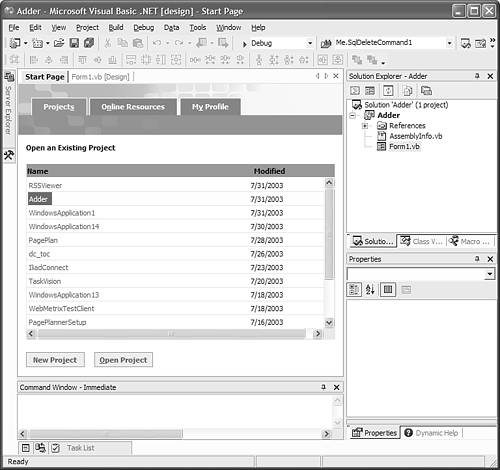
The ability to search for code samples by keyword or type (from the Getting Started page; see Figure 1.7).
Figure 1.7. The Getting Started Page lets you search for code samples right from within Visual Studio .NET.
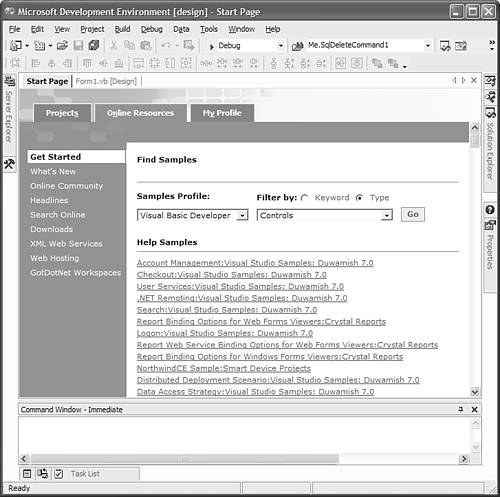
Details about the new features of Visual Studio .NET. What's New links to various online resources such as newsgroups (Online Community).
A live news page about Visual Studio and other developer-related topics.
A direct link to doing a Web search (Search Online).
A link back to the profile selection page you were shown by default on the first run of the IDE (My Profile).
All these are valuable resources for a Visual Studio developer, making this home page a good starting point for many people. However, if you feel like adding to these options or totally replacing the entire set of pages, the complete source of the default page is made available for you under Program FilesMicrosoft Visual Studio .NET 2003Common7IDEHTML. A note of warning though—the default pages are not simple, and it would be easy to damage them beyond repair. Make a copy of the directory as a backup before you start to customize!
The Main Windows of the Visual Studio IDE
As useful as this home page is, it is only one of the many windows available as part of Visual Studio and you are going to walk through most of them in this chapter. With the Visual Basic Developer's profile chosen, you have several windows visible already: the built-in Web browser, the Solution Explorer, the Properties, and the Toolbox, along the left side. The other windows, which I will discuss in today's lesson, but which are not visible by default in the current profile, are as follows:
Object Browser
Command/Immediate
Task List
Class View
Server Explorer
Later chapters cover a few other windows as they become relevant.
Common Window Features
All the features of these windows, including the entire concept of multiple little windows, revolve around making the most efficient use of space. In any IDE, and especially in Visual Studio. NET, the number of available options and tools is nearly limitless, but the area of your monitor is not. One solution to this problem is to get every developer a 21-inch (or larger!) monitor. For some strange reason, that still has not caught on, so other methods have been developed. One such method is to divide the options available to the developer into different windows, which is the approach taken by Visual Studio. NET. Now, the goal is to make the placement of these windows both easy and flexible enough for developers to create their ideal work environment. Each of these individual windows is referred to as a tool window. The members of a tool window all share some common features, such as the capability to be docked/undocked, hidden, and combined into tabbed groups of windows. They also can be resized in various ways.
Docking/Undocking
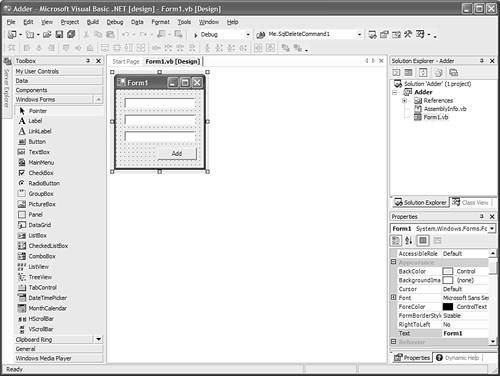
With the Visual Basic Developer's profile selected, the Solution Explorer and Properties are both flush with the right side of the encompassing Visual Studio, and the Toolbox window is flush to the left side (see Figure 1.8). The placement of a window flush to another boundary is described as docking that window. While docked, the window is locked to that boundary along one or two sides (two sides if docked into a corner). Any of the tool windows in Visual Studio .NET can be docked, and there is no limitation as to which edges of the application they can be docked to.
Figure 1.8. When Visual Studio.NET is set to the Visual Basic developer's profile, it arranges its windows in a close approximation to Visual Basic 6.0's IDE.
To move a docked window to another area of the screen, you can click and hold the mouse on the title bar of the tool window, and then drag the window to the new position. While you are dragging the window, an outline will appear on the screen to show where the window would be placed if you were to release the mouse button. To dock the window to another side of the IDE, simply drag the window, continuing to hold down the mouse button, to a border of the IDE and release the mouse button when the window's outline shows the desired result. On the way, you might have noticed that the outline can look as if it was not docked to any portion of the IDE. If you were to release at this point, the tool window would become undocked, also known as a floating window, at which point it is no longer attached to any of the IDE's borders. When you are undocked, you can re-dock a window by following the same procedure that you just used.
It can be tricky to get a docked window back into the exact place from which you moved it, so here is a little tip: Instead of dragging a window to dock and undock it, double-click the title bar. This will undock a docked tool window, or take a floating window and put it back into its original place.
Hide
Docked or undocked, the windows still take up space on your screen, but it is possible to hide or close individual windows that you do not want to have visible. Each tool window has an X button on it, similar to the regular close icon on other windows. Clicking this button closes the tool window, removing it from the screen. To get the window back, you will need to use a menu option. For instance, if you click the X button on the Solution Explorer, it will disappear from view. To get it back, you need to select Solution Explorer from the View menu (or press Ctrl+R). Not too difficult, especially for a window that you don't use often, but what about those windows that you might not be using right at this moment, but do use frequently? The Visual Studio.NET IDE provides a way to recover the screen space used by those windows, while still making them easily accessible—the auto-hide feature. Each docked tool window has an icon on its title bar that looks like a small pushpin (see Figure 1.9).
Figure 1.9. Every tool window has a small pushpin that enables you to lock the window in an open position.
![]()
This is a toggle button that controls whether the window should be automatically hidden when not in use. By default, the Server Explorer window is set to use this feature and therefore shows up simply as a gray tab or button along the left side of the IDE. Hovering over this tab with the mouse pointer will cause the full Server Explorer to become visible, sliding out into view. Any tool window with the auto-hide option turned on will automatically be minimized into a tab along the side of the IDE on which it is docked. The hidden window will be brought into view whenever the user moves the mouse over that tab, meaning that the window will only take up space when it is needed. This feature, along with the menu option Window, Auto Hide All, is what I use to configure Visual Studio to my desired appearance. This leaves maximum space for the main window, where code will appear when you have work open. Such an extreme interface might be unnecessary when working on a large monitor, but, as a laptop user, I find it perfect.
Tabs
Another space-saving feature, multiple tool windows, can be combined into a single area of the screen, where they will automatically become individual tabs in a multi-tab window (see Figure 1.10). In the Visual Basic Developer's profile, several windows have already been combined (the Solution Explorer shares space with the Class View window, and the Properties and Dynamic Help windows are similarly configured), but any combination of tool windows is possible.
Figure 1.10. Tabs enable you to have many tool windows open while using up the same amount of precious screen space.
To add a window to a group of tabs, or to create a tabbed window, simply drag one tool window (by clicking its title and dragging) onto another, releasing the mouse button when the outline changes to indicate a tabbed window, displaying a small tab extension at the bottom of the outline. Removing a window is done in a similar fashion. Simply drag one of the tabs away from the group until the outline loses the tab indicator, and then drag to the desired new location and release. Once a window has been added to a tab group, you can change the order of the tabs by dragging them left or right. Note that when you drag a window within a tab group, you will not see any helpful outline to indicate where you are moving the window.
Resizing
Any tool window can be resized, but, if the window is docked, it can only be resized along its undocked borders. To resize a window, move the mouse pointer over the edge of the window, until the pointer turns into a resizing indicator, which shows the direction of resizing allowed. When the pointer indicates that you have the mouse in the right position, click and drag to extend or retract the window's border to the desired size. Note that resizing between two docked windows is really changing both windows because one must shrink to allow the other to expand.
Toolbox
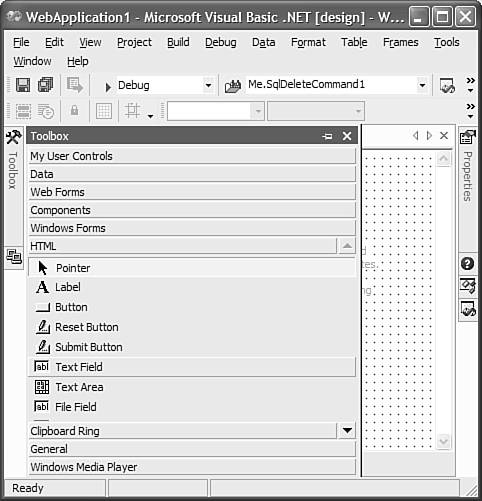
One of the more commonly used windows, the Toolbox, provides a listing of various text snippets, user interface elements, and other items that are provided for you to add into your projects. The Toolbox in Visual Studio .NET isn't all that different than what you would have been used to from Visual Basic 6.0, but it has a few extra features. First, the selection of items shown depends on what is being edited in the main window of the IDE. For instance, if nothing, or just the Web browser, is selected in the main window, the only available item in the Toolbox is the Pointer icon. This icon, which is always present, is provided as a way to deselect any other item in the Toolbox window. If you were editing something, such as the HTML of the Visual Studio home page (right-click in the Web browser and select View Source), additional tabs will be added to the Toolbox window. In the case of HTML editing, an HTML tab has been added (see Figure 1.11); it contains a variety of items representing different HTML tags.
Figure 1.11. When editing HTML, all of the common HTML UI elements are available through the Toolbox.
Any item, with the exception of the special Pointer item, can be used in one of two ways:
Click and drag the item into the editing window (releasing when you have moved the mouse to the desired location).
Double-click the item, which results in the item being added to the editing window at the currently selected insertion point (wherever the cursor was positioned in the editing window when the item was double-clicked).
Both these methods of using items are available for any type of document being edited, but if a graphic user interface (any visual, non-text document such as a Windows Form) is the current document, the preceding two options behave slightly differently and a third option also is available:
Clicking and dragging the item onto the visual document works the same as with text, but instead of a cursor insertion-point, you see an actual outline of the item as you move your mouse over the document.
Double-clicking also works, but, because a visual document does not always have a currently selected insertion point, the new item will be created in the upper-left corner of the document.
A third option, not available with text editing, is to select the item by clicking it once, highlighting it in the Toolbox, and then clicking and dragging on the visual document. This outlines the size and location at which you want the item to be added to the document and the new item is created accordingly.
I will walk through an example of using the Toolbox with a visual document later in today's lesson, as you create a Windows form as part of your first application using the IDE. The Toolbox is capable of holding any arbitrary snippet of text, in addition to the provided parts for HTML editing, forms development, and many other types of work, which means that you can create your own items that represent sections of text. This feature is a useful way to take some piece of text (which can be, and likely will be, code) that you expect to use often, and make it easily available.
THE NATURE OF THE VISUAL STUDIO IDEThere is a bit of vagueness to the preceding descriptions, which might make you wonder whether the Toolbox is more difficult to use than it seems. Well, the vagueness is a result of the nature of the Visual Studio IDE, because it can service a wide variety of programming languages, not all of which are even available today. With this in mind, the exact behavior of the IDE (or any part of it, such as the Toolbox) is difficult to describe. However, you can be confident that it will always work in the general fashion described previously, regardless of the language that uses it. |
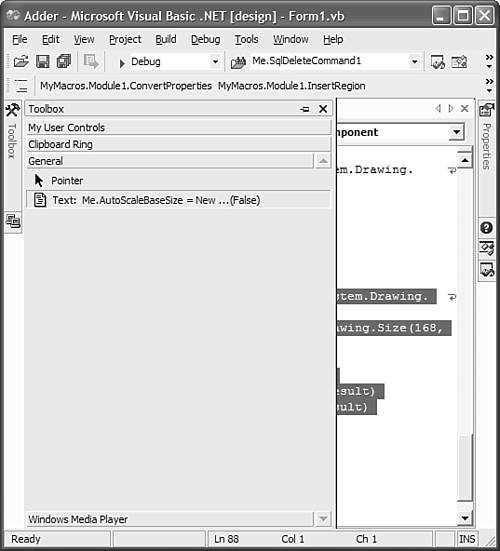
To accomplish this amazing feat of productivity, select the desired text in the editing window (which might involve typing the text first), and drag this selection onto the Toolbox window. Whichever tab you drag, its text will determine where your newly created item will appear. As shown in Figure 1.12, the item will display some boring and meaningless default name, such as “Text: Dim x as ...”, but you can right-click it and select Rename Item to provide a proper description. Voilå! You now have a new, custom item in the Toolbox, which you can use whenever you want simply by dragging it into the editing window.
Figure 1.12. Code, HTML, or other text snippets can be placed on the Toolbox and then used (dragged into code and HTML editing windows) just like any other Toolbox control.
The Toolbox, as with the rest of the IDE, has many additional options that I won't be covering, such as the capability to add more tabs (tabs are those sliding sections of the Toolbox window), rename tabs, and change your view of any section's icon list. These other features are accessible through the Toolbox's context menu (the right-click menu), and also are documented in the IDE help files. If you want to add controls to the toolbox, such as existing .NET or COM/ActiveX components, you can right-click and select Add/Remove Items.
Command/Immediate Windows
Do you ever find yourself running the command console (or DOS window, as some like to call it) to accomplish a task? For many people, some tasks can just be done faster using the keyboard and a command-line interface than using the mouse to navigate icons, menus, and dialog boxes. Because programmer productivity is the ultimate goal, any method that might be quicker is worth trying. Visual Studio .NET includes a window that provides two console-based ways to interact with the IDE. One has been part of Visual Basic for some time, the Immediate window, and one has been present in Fox Pro for many years and has finally been added to Visual Studio, the Command window.
In terms of usage, these are really two windows, but they have been combined to make things a little bit more confusing. You can think of them as two windows (I know I am going to), after you have learned two key things: how to switch the mode of the window (from Command to Immediate and back again) and how to determine which mode the window is currently in. First things first—let's make this window visible; select View, Other Windows, Command Window from the menu, bringing up this new window.
This window, now titled Command Window, should contain only a blank line proceeded by a > prompt (almost exactly like the command console, or DOS prompt that you are used to). This window is now in Command mode, and you can enter any command you want and execute it by pressing Return. To switch this window into Immediate mode, you can just type the command immed (and press Return or Enter) at the provided prompt. Now, the window will have switched into Immediate mode, distinguishable from the previous state by the addition of – Immediate to the window's title bar and the removal of the > prompt from the actual window text. To return to Command mode, type >cmd and press Return (yes you have to include the > prompt yourself). Now that you know how to switch back and forth between these two modes, you can look at the purpose and use of each mode.
The Command mode of this window allows you to control the IDE using typed commands—for example, typing File.NewProject to accomplish the same task as selecting the File, New, Project menu item. A console interface can often be faster than a graphical user interface. This duplication of functionality is provided as a potential way to speed up your work inside the IDE. A large number of commands are available, but the quickest way to find many of them is to go through the names of the visible menus. After you have typed a name (such as Edit, or File), add a period, and you will be given a drop-down list of available commands for that menu name. Here's a short list of commands worth knowing:
File.NewProject
File.SaveAll
Window.AutoHideAll
The Immediate window provides the capability to evaluate code statements directly (immediately!). This enables you to enter a single line of code, and see the results without having to create an entire sample project. This feature is usable when you are in Break mode, which is when you have stopped the execution of a program in progress. Let's create a quick sample project, in which you will use a breakpoint to cause program execution to stop on a certain line of code.
You will use the Command window to start this example, just to get a feel for how it might be useful to you in the future. Make sure that the Command window is visible and in Command mode by selecting View, Other Windows, Command Window from the menu bar. The Command window should now be visible, and have a > prompt showing that is it in Command mode. Type the following command File.NewProject and press Enter. A dialog box appears, prompting you to create a new project. Select the folder named Visual Basic Projects from the list on the left and the individual project type labeled Windows Application from the box on the right. Click OK to close the dialog box, creating a new blank project.
The project you have created contains only a single Windows form, and you have yet to add any code of your own. Under the covers though, Visual Basic has placed a small amount of code into your form already, the little bit of work that is required to create and initialize the new blank form. You can see that code by right-clicking the new form (in the center window of the IDE) and selecting View Code. This will add and select a new tab in the center window, a code window that displays the code associated with this form. Because you have added nothing to this form, the code is limited, but it is enough for the example.
Find the area of the code marked with “Windows Form Designer generated code” and expand it (it should be displayed as a box, with a plus symbol next to it, this is known as a Region). Find the line InitializeComponent(), and then select the line End Sub below it. Now, you want to mark this line as having a breakpoint, so that code execution will pause or “break” when it hits this line. There are three ways to mark the line. One is to click in the margin (the light gray area on the left side of the code window), another is to right-click the code line and choose Insert Breakpoint, and the third is to use the keyboard shortcut for this function by pressing F9. Using whichever method you want, add the breakpoint, and you will see a red dot appear in the margin next to the line. This dot indicates the presence of a breakpoint.
With this breakpoint in place, you can run the project, and the execution will pause when it hits this line. As with the breakpoint, there are three main ways to start a project: One is to use the Toolbar button (which looks like the play button on a CD player or VCR); another is to use the menu option Debug, Start; and the third is to use the keyboard shortcut F5. Of course, which option you use is up to personal preference. Many programmers find that, in the long run, the keyboard shortcuts are the easiest way to access the more common functions.
When you start the program running, it will quickly stop and display the line of code that you marked with a breakpoint. Now, you are in Break mode, as indicated by the [break] in the Visual Studio IDE's title bar. The yellow arrow that you can see in the margin of the code window indicates the line that is about to be executed (run). At this point, you can switch the Command window into Immediate mode and try it.
If your Command window was visible before running the project, it should still be present, although the layout could be different as certain windows are automatically opened when you are in the midst of a running project. If the Command window is not visible, open it by using the menu option View, Other Windows, Command Window. Click the window to select it (making it the active window in the IDE) and type immed (followed by the Enter key) to switch the window into Immediate mode. Now you can type in any Visual Basic statement, and it will be evaluated immediately (hence the name). Try the following statements:
? Me.Width
Me.Width = Me.Width * 2
? Me.Width
? 3 + 5
? 3 = 5
Using the up and down arrow keys while you are in the Command/Immediate window does not always move you to different lines within the window. Instead, if you have started entering some text already, you can cycle through commands you have already executed. If you do select a past line (in the window) and start to add text to it, a copy of that line with your new changes will be automatically created at the bottom of the window. This makes any text before the last line of the window effectively read-only.
Notice the ? in front of some of the preceding statements? This indicates “print” and, without it, Visual Basic does not know what to do with statements that return a value. For instance, 3 + 5 will evaluate to 8, but, without the print statement, 8 is not a valid Visual Basic command. On the other hand, Me.Width = Me.Width * 2 will work without the ?, because it is a valid assignment statement. Try that statement out before continuing.
Press F5 to make the code execution continue past the breakpoint, and the form will appear on the screen, wider than the original size if you executed the sample statements given previously. As you can see, it is possible to affect parts of your program from the Immediate window, making it an excellent tool for debugging.
It is worth noting at this point that Visual Basic .NET is missing an important feature of Visual Basic 6.0—Edit and Continue. In Visual Basic 6.0, you could stop your code at a breakpoint, change the code, and then have execution continue from that point. You cannot do this in Visual Basic .NET; to change code you need to stop debugging your program (by clicking the Stop Toolbar button), change the code, and then restart your application (by pressing F5 or the Play Toolbar icon). The Edit and Continue feature will be returning to Visual Basic in the next release (currently known by the code name Whidbey).
Dynamic Help
This tool window is set up as a tab with the Properties window (if you are using the Visual Basic Developer's profile settings), and provides context-based documentation references to Visual Studio's help files. Instead of waiting for you to ask for help, this tool window acts proactively when you press the F1 key or select something from the Help menu. Based on your current selection or task, it displays a list of related topics.
In addition to the directly related help topics, this window will usually display a link to several more generic topics such as (in this case) the Coding Techniques and Programming Practices section of the documentation. This tool window also provides a quick link to the contents, index, and search sections of the help documentation through the three Toolbar icons provided.
Server Explorer
This tool window (see Figure 1.13) provides a visual listing of two main resources, databases and servers. The first set of resources represents all the connections established between your project and various database servers, and enables you to explore those databases to see tables, stored procedures, and other useful information.
Figure 1.13. The Server Explorer provides a visual way to view and use resources from both the local server and other machines.
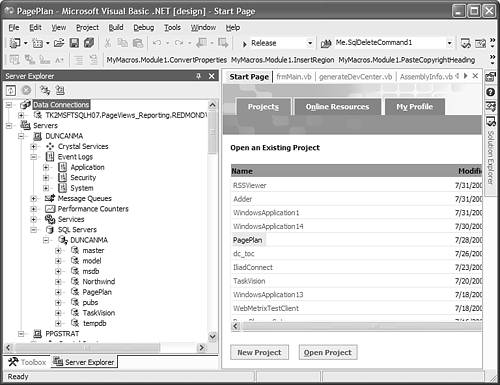
The second set of information, Servers, represents any machines that you can connect to and that provide a visual interface to the resources that those machines can make available to your program. These resources include performance counters, event logs, message queues, and more, all easily found through this tool window.
Properties
The Visual Studio IDE enables you to work with many items, projects, solutions, forms, classes, and more, all of which possess attributes or properties. These properties are pieces of information that describe the item, such as a name for a project. Although properties are automatically populated with default values, you need a way to modify them. The Properties window provides this functionality. Whenever an item is selected in the IDE, the attributes of that object will be displayed in this tool window. Some of these attributes might be read-only (they cannot be modified), but for those that are not, you can click them in this Properties window and change them as needed.
Solution Explorer
In many ways, the Solution Explorer is similar to the Project Explorer in Visual Basic 6.0. It is the file management interface within Visual Studio .NET. In Visual Studio .NET, the code you create can be organized using different layers of grouping: solutions (which replaces the idea of a project group from Visual Basic 6.0), projects, and files. The Solution Explorer window enables you to view a list of all of the available files in the current solution.
In addition to letting you view what is currently open, the Solution Explorer window gives you a variety of functionality. Through the window, you can
Add new files to a project (right-click the project and select Add)
Remove files (right-click an individual file and select Remove)
Add and remove entire projects from a Solution group (right-click the solution to add a project, and right-click a project for the option to remove it from the current solution)
Class View
As part of the discussion of the Solution Explorer, I explained that there can be many files involved in a single project or solution. Those files often correspond to the created classes (such as a Vehicle class or an Account class), but there is no requirement that the file organization must resemble the conceptual organization of the classes in the project. The Class View window is designed to let you view the object structure of your project and use that view to navigate within your code.
Within this window, you can collapse and expand the displayed objects to access the various properties and methods they expose. Double-clicking a particular item in the Class View will take you to that class, method, event, property, or procedure. If the item you double-clicked is not available as a part of your code, Class View takes you to the definition of that portion of the class within the Object Browser (see the next section). The Class View is useful as a way to look at your project through its defined classes, ignoring the physical details of the actual files.
Object Browser
All programming in .NET is based on objects—objects provided for you as part of the .NET Framework, objects you create, even objects that other parts of your own team have created. All of these objects have properties and methods through which you can interact with them, but how do you know what is available? The Object Browser is designed to assist you in working with all of these objects, by enabling you to browse and search through a catalog of available objects. This catalog includes the objects (classes) exposed by any referenced class libraries, along with the classes contained within your own project. Similar in some respects to the Class View, the Object Browser goes beyond the functionality of that other window by including objects outside of your project. This window is most useful as a form of documentation or reference, enabling you to find classes within the .NET Framework or other class libraries and view the details of those classes, such as their properties and methods. Just like in Visual Basic 6.0, you can bring up the Object Browser by pressing F2.
Task List
In any development project, even completed ones, there are likely to be a variety of outstanding tasks to be completed. Sections of the program might need performance tweaking. There might be known bugs or missing functionality that need to be remedied. When the outstanding tasks can be related to an actual area of the code, a common practice among programmers is to flag that area with comments. When the programmers consistently include certain words such as TODO or BUG in those comments, it is easier to scan through the code looking for those keywords to find the appropriate bits of code. Visual Studio .NET has formalized this process by providing an actual task list that is automatically filled with references to any section of your code that contains one of several keywords such as TODO (but, you can specify any keyword you want). Each comment found is then listed in an easy-to-use list, detailing not only the comment itself, but also the file and line at which it was found (see Figure 1.14).
Figure 1.14. Every comment flagged with a special keyword is shown in a nicely organized task list.
With a quick double-click a task, you are immediately taken to the code, where you can get to work on whatever the outstanding task indicates. In addition to this functionality—fairly useful on its own—the task list can hold a variety of other types of tasks. Visual Studio adds other tasks automatically, such as referring to compile errors and other notable items. It is also possible for you to add two types of tasks to this list: code shortcuts and user-defined tasks.
Code shortcuts are similar to comment-based tasks, but are a reference to any line of code. They do not require any special keyword. To add a code shortcut to the task list, click a line in the code-editing window and then select the Add Task List Shortcut menu item from the Edit, Bookmarks menu.
A new task will be added to your task list, with the description defaulting to the line of code selected (although you can, and probably should, change this to whatever description you want). Then, you can quickly return to that line just by double-clicking this task. When a shortcut has been created, a blue arrow will be placed in the left margin of the code window next to the appropriate line of code. You can remove the shortcut by clicking the line of code and then selecting Remove Task List Shortcut from the Edit | Bookmarks menu or selecting the new item in the task list and deleting it directly.
The other type of task that you can create is a user task, one that is not associated with any particular bit of code, similar to a standard task in Outlook. A user task is added by clicking the Click Here to Add a New Task section of the task list and filling in the details. Note that, unlike other tasks, these tasks do not have the file/line fields filled in, and therefore only have two fields available, the Description and the Priority (Low, Normal, or High). If you want to create a note about a particular area of code, you likely will find it more useful to create a code shortcut and change the priority and description to provide more detail on the actual issue.
Solutions and Projects
As discussed in the “Solution Explorer” section, multiple levels exist for grouping your code together. The first level, the solution, represents the overall system being created, whereas the individual components within it are represented by separate projects. Before you can write any code inside the Visual Studio IDE, you must set up the solution and at least one project. In this section, you will go through the basics of organizing your code, creating new projects, and working with existing projects and files. The following is a quick overview of these topics, but, in the section immediately following this one, you will get to practice these skills by creating a complete sample application.
Creating a New Project
A few ways exist to create a new project, but the most common method uses the menu option File, New, Project. This menu option brings up a dialog box showing all the different types of projects that the IDE is capable of creating (see Figure 1.15). Because the Visual Studio IDE works with a variety of languages, the dialog box shows options based on the languages you have installed, and might appear different from the one in Figure 1.15. For now, you will be creating projects based on the choices under the Visual Basic Projects folder.
Figure 1.15. Visual Studio has an expandable New Project dialog box, which allows for new project types to be added as you install additional templates or languages.
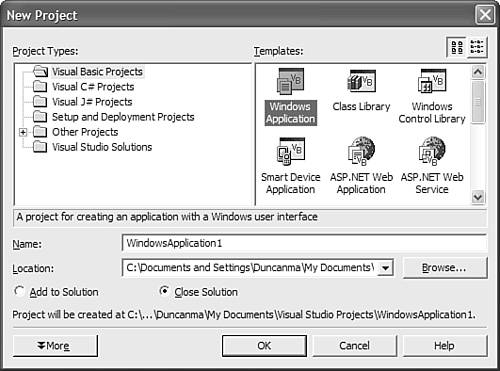
To create an application with a Windows-based user interface (with dialog boxes and other Windows UI elements), select Windows Application from the list of project types. To complete the creation process, enter a name for your new application and, if desired, modify the suggested path. Click OK, and Visual Studio creates your new project. It is a good idea to give your projects meaningful names, even when you are just experimenting; otherwise, you will quickly have a whole group of projects named WindowsApplication1 and WindowsApplication2, making it difficult to find anything that you have been working on.
Opening an Existing Project
When you close Visual Studio, it will ask you whether you want to save what you are working on, and automatically close everything for you. When you want to get back to a previous project, you will need to open it into the IDE. Visual Studio provides a few easy ways to open past projects. One method is to use the menu through either File, Open, Project, or directly through the Most Recently Used (MRU) section near the bottom of the File menu. Another method is through the Get Started section of the Visual Studio home page, an HTML page that lists the projects you have recently worked with. There, you can click the particular project you want to open, or even create a new project through an additional link. Opening a new project closes any other project you currently have open (actually the currently open solution), unless you use the menu option File, Add Project, which adds a new or existing project into the currently open solution.
Organizing Your Files
Solutions and projects exist almost purely for organizational purposes; the actual code resides in one or more individual files. When you create a new project, certain files are usually created for you, such as a new Windows Form (Form1.vb) when you create a Windows application and a new Module (Module1.vb) for a Console application. These files are created on disk and exist independently of their project, enabling a single file to be shared across multiple projects if desired.
Adding Files to a Project
In addition to the files that are automatically created as part of your new project, you might also want to add additional modules, classes, forms, or other types of code files. Through either the Project menu, or the menu brought up by right-clicking the project in the Solution Explorer window, you can choose to add any one of a variety of files. Regardless of the specific menu option you choose, with the exception of Add Existing Item, all of the choices will bring you to the Add New Item dialog box (see Figure 1.16). If, instead of creating a new item, you want to add an existing file from disk, the menu option Add New Existing Item will bring up a standard file open dialog box for that purpose.
Figure 1.16. Just like the New Project dialog box, the interface to add new project items is expandable.
Saving Everything
With all these different groups (solutions, projects, and files), it is important to know how to save any work you have done, even if it is located in more than one file. In the Visual Studio IDE, this is accomplished through two commands: Save and Save All. These commands, located on the File menu and on the Toolbar, enable you to either save just the currently selected file (selected in the Server Explorer window) using the Save command or to save all open files that have been modified using the Save All command.
If you are paranoid about losing work, as I am, you will be especially interested in one of the IDE's options. Under the Options dialog box (accessed through the Tools, Options menu item), you can expand the Environment group and select the Projects and Solutions item to see a set of three option buttons under a heading of Build and Run Options (see Figure 1.17). These options control whether the IDE saves any modified files before starting to execute a project. This is an important setting because, if the IDE is ever going to crash, it is most likely going to do it when you run your code. This option provides an easy way to ensure that all your changes are saved every time before you run your code.
Figure 1.17. Always check the “Save All Changes” setting when you use a new computer, to avoid losing a few hours of code.