
Chapter 9
Monitor and Recover
EXAM AZ‐303 OBJECTIVES COVERED IN THIS CHAPTER:
- Implement and Monitor an Azure Infrastructure
- Implement cloud infrastructure monitoring
EXAM AZ‐304 OBJECTIVES COVERED IN THIS CHAPTER:
- Design Monitoring
- Design for cost optimization
- Design a solution for logging and monitoring
- Design Business Continuity
- Design a solution for backup and recovery
- Design for high availability
This chapter covers some tools and scenarios that are helpful for monitoring the Azure platform. Take special note of the “for monitoring the Azure platform” phrasing because this is what the monitoring capabilities you will find on Azure are intended for. There may be a few places in this chapter where a tool is pointed out that may be useful for monitoring your application, but not so much. This is important to point out because you need to know what logs and metrics your applications need to produce and store to gauge its health. Azure Monitor will provide logs and metrics for the products and features your application runs on and not much more. Also, in this chapter, you will learn about disaster recovery and failover tools. But again, the focus is on the tools; you will need to determine what the application needs to continue working if one piece of your solution becomes unavailable. The most important Azure services that you need to know about in regard to monitoring and recovery are Azure Monitor, Azure Backup, and Azure Site Recovery (ASR). Each of these was introduced in Chapter 1 and in numerous other chapters throughout this book.
The monitoring and recovery portions of the lifecycle of an IT solution are typically owned by a support organization. The thing about support is that, by nature, IT support engineers are reactive. That means support team members usually wait until something is broken before taking an action, and typically there are enough broken things to keep them more than busy. It is a common behavior for support organizations to take on programs that focus on preventative support activities, where they aspire to lessen the reactive nature of the organization, i.e., try to become proactive. But unfortunately, the limitations of the human support resources often result in falling short of those aspirations. Monitoring is an absolute necessity if you aspire to take proactive actions on your production IT resources. A monitoring strategy must be created that requires direct financial investment because there are limited metrics available by default. You commonly have CPU and memory logs that might help you solve a number of issues, but those alone are not good enough.
In my many decades of work in the IT industry, mostly in a support role, I have never executed a full‐blown disaster recovery plan. The team has spent many hours on preparing and testing BCDR plans, but never have I completely moved a production application to another environment. I think it historically had to do with the cost of having an identical copy of a production environment sitting idle just in case it's needed. In most cases, when we triggered the disaster recovery plan, the issue mostly got resolved before we passed the point of no return. When I think back on those scenarios, I do not remember ever having a sense of confidence in the environment that we had built to act as the DR production environment. Perhaps this is the reason a complete move to the DR environment never actually happened. Remember that it is the support team that not only troubleshoots production issues but are also commonly responsible for executing the BCDR plan. If there was no confidence in the DR production environment actually working, then the support team would focus on fixing the issues instead of failing over. This lack of confidence would unfortunately result in longer downtimes and a more stressed support organization.
Those were challenging times that may never happen again since the cost of those failover environments are no longer significant. That means you can have an exact replica of your production environment ready to roll in a short time frame. Not only will you gain confidence by having the existence of an identical production environment for DR, but also Azure provides the tools required to perform the failover quickly and easily. You simply need to now build that BCDR culture into your support organization. Mitch Radcliff said, “A computer lets you make more mistakes faster than any other invention.” So, make sure you always have a backup plan for any action you take on a computer. Have metrics that you can use to measure the impact of those changes, and have a plan to fail back or roll over to another instance of your environment when things go wrong. Azure Monitor, Azure Backup, and ASR can help you achieve exactly that.
Monitoring Azure Resources
To begin with, you need to think about why you want to monitor the workloads you have running on Azure. Clearly define your objective in written form and then break that down into distinct measurable items and organize them in the order of importance. Then think about how you can measure those items, what metrics and tools exist that supply some kind of comparative value, and what value is an acceptable threshold. In reality, why you want to monitor is an easy question to answer. You must know how the platform and how your applications running on the platform are behaving. Your objective is to meet the service level agreements (SLAs) you have guaranteed to your customers, partners, and/or the business organization within your company. SLAs were introduced in Chapter 2 in case you want to refresh that now. In addition to meeting an SLA, you also should desire an IT solution that is both reliant and resilient. To achieve those objectives, focus your monitoring strategy on the following monitoring aspects:
- Availability/SLA monitoring
- Collecting, storing, and reporting
- Auditing
- Health monitoring
- Performance monitoring
- Security monitoring
- Usage monitoring
The definition of application availability is simply the amount of time the application is accessible for use. Calculating the availability of an application is achieved by using the following algorithm:
percent_availability = ((total_time - total_downtime) / total_time) * 100
Common values for
percent_availability
are, for example, 99.9%, 99.95%, 99.99%, and 99.999%. The last one is referred to as five nines and is the holy grail of availability because it is difficult and expensive to achieve. An IT application rarely exists on a single server, and it is rarely dependent only on itself. In Chapter 6, you learned about decoupling systems in an effort to make them more available. Without decoupling your systems, the calculation of availability for one tier of your IT solutions becomes a bit more complicated, especially when you want to need to pinpoint the root cause of
total_downtime
. Pinpointing the root cause of downtime is important for making improvements and not for finger‐pointing or blaming. The point is, the
total_downtime
value may not be caused by the application being accessed itself; rather, it's caused by one of its dependencies. There are certainly tools and metrics that can help you track the availability metric. Unfortunately, though, like many other topics summarized in this book, how to find why the availability issue is happening and how to fix it is another career‐worthy profession and is also worth a book of its own.
The Azure portfolio offers the following services for collecting, storing, and reporting details about your workloads:
- Azure Monitor
- Log Analytics
- Application Insights
- Azure Data Explorer (ADX)
In Figure 9.1, you see how the previous Azure services all fit together. You can see that Azure Monitor is in place to monitor the products running on the Azure platform and feed that data into Log Analytics for reporting. As well, monitoring data can be fed directly into Azure Data Explorer (ADX) or into some custom logging source. Application Insights is a tool that is useful for capturing logs that are more application‐specific, i.e., not platform‐specific. This monitoring data can be fed into numerous repositories and analyzed from the portal where the information is graphically presented. Or you can query the data using KUSTO‐like SQL queries aka KQL.

FIGURE 9.1 Azure Monitoring overview
Logging can be configured to track and monitor Azure VMs, containers, security, Azure Active Directory, and subscriptions. Just about all Azure products and features have the capability to create logs and expose an interface to retrieve and analyze them. Reviewing the log/monitor data is possible through numerous endpoints, starting within the Azure Portal. Additionally, there are dashboards and views in Application Insights, Log Analytics, and ADX that allow you to customize the data to analyze and customize the presentation of it. Each of those dashboards is presented to you later in this chapter. Keep in mind also that Power BI is a valid tool for the graphical representation of large complicated datasets. Azure Monitor is the main component you need to know and focus on when building your monitoring strategy, but you will learn a lot more as you proceed through this chapter.
You learned in Chapter 6 what you need to know when it comes to auditing. Being compliant with industry regulations and government privacy laws cannot be achieved without knowing what exists in your Azure footprint, what each resource does, and whether they are secure. There are some helpful tools in Security Center for auditing as well. In addition to Security Center, Azure Policy and Azure Blueprint are helpful in making sure your solutions remain compliant. Finally, remember that in Chapter 5 and Chapter 6 you worked with the
MODEL
column on the
MODELS
Azure SQL database table. In those exercises, you encrypted and labeled the
MODEL
column as confidential. You will later learn how to enable auditing on a database column and track who and how often that piece of data is being accessed. This is important if the data is extremely sensitive and perhaps there isn't a need to see it often. Therefore, when that data is accessed, it will show up on an audit report.
The next monitoring aspect has to do with health monitoring. What exactly is health monitoring? Think about it in the actual sense of a human, in that a human can perform a task even when unhealthy. However, if the individual were healthier, the effort required to perform the task would be less, leaving more energy to perform additional activities and making them more productive. The same is applicable with IT resources, in that if you have a bad piece of code that consumes an unnecessary amount of CPU or memory, then the compute can perform fewer computations over the same time frame when compared to the same process running a more optimal version of the code. Remember that in the cloud model where you pay for consumption, that is an important point. Bad, inefficient code can result in higher average costs since they consume more cloud resources. Health monitoring is generally constructed using colors. Green is when all is good, yellow is for partially good, and red is for not good. The thing is that you, the application owner, must know what is considered green, yellow, and red, because what is green for you may not be for someone else. Consider metrics such as CPU utilization, memory consumption, and how fast your application responds to requests. Logging the health data in a tool to interpret the data and report it for action is totally application‐dependent and outside the scope of Azure. However, the tools in Figure 9.1 are helpful to capture, store, and report the findings from that kind of data, from the platform perspective. One of the metrics mentioned is the speed in which a request to the application responds to a request made to it. How fast should it be, what is normal, and what is a threshold where you believe an action should be performed? These are some questions you need to ask yourself about the application. Is it normal for the response to come back in ten seconds, or is 500ms more the norm? What is considered healthy and what is not again depends on what the application is doing. It may be normal for your application to consume a large amount of memory. Caching large datasets into memory will typically result in large memory consumption, but doing so actually makes your application faster. The same goes for CPU consumption; if you are performing a lot of complex regular expression comparisons, then the application would consume more CPU.
Key performance indicators (KPIs) are something you may hear within the performance monitoring scenario. KPIs are the thresholds you set for your application in the context of, but not limited to, how fast an HTTPS response should take, how fast a database query should take, how long a ping between two servers should take, and how many concurrent connections is normal. When any of those KPIs are breached, then alerts need to be sent and analysis done to find out what happened and implement a solution to keep it from happening again if it caused downtime. If it didn't cause downtime or any disruption, then you should consider changing the KPIs so that it reflects “normal production activity.” The kind of information attained from this scenario is also helpful for managing growth by making some tweaks to the autoscaling rules you have implemented into your compute or data workloads.
There is no shortage of security‐related monitoring you will find in Azure; you already know there is an entire product offering named Security Center. Take a look at Chapter 2 to get more information about Security Center; specifically look at FIGURE 2.49. From a security monitoring perspective, some of the areas of interest are from a user access perspective. Azure Active Directory (AAD) provides some features under the Monitoring header on the AAD blade. There are also reports to run and manage an RBAC, User, Group, sign‐on, and audit logs, which describe what actions were taken under those login activities. Keep in mind that these security reports are targeted toward what is going on in the Azure Portal; if you need more information about what is happening in your application, there is more on that in the later section named “Monitoring Security.” However, a lot of the security‐related application responsibilities sit with you, the user of Azure products and services.
The last monitoring scenario discussed here has to do with usage. A useful usage monitoring report is available for you already; take a look back at FIGURE 8.2. It is the Cost Analysis report for a given Azure subscription. This report is broken down by resource group, region, and event to specific Azure products. This is helpful for you not only to see where you are having the most cost, but also where you have the most activity. Remember, cloud computing charges you based on consumption. The products and features with the most usage will typically result in the highest cost. But that can also be helpful to identify your most popular product or service. Why that is important comes down to making sure there is enough available resources allocated to it, especially if it is a revenue generator. There are throttling rules you can place on resources and subscriptions, and when the limit is breached, Azure can be instructed to stop allocating additional resources. You would not want to do that when it comes to your most popular product, right? A usage report is helpful in identifying those resources; then you can determine what limitations need to be applied to each. Instead of constraining a popular revenue‐generating application, manage spend versus consumption versus revenue and tune it for growth.
The remainder of this section is broken into two subsections. The first one has to do with Azure Service Health followed by the most important Azure Monitor service. You'll learn about Azure Service Health and then get ready to get your hands dirty with Azure Monitor.
Azure Service Health
Your migration or creation of IT solutions onto the Azure platform begins with trust. You are handing over a lot of responsibility to Microsoft, which can have a great impact on the success of your solution and company. In many cases, once you migrate to Azure, the success of your entire business is in the hands of Microsoft; perhaps all the revenue that your company makes is driven through the applications now running on Azure. If that's the case and there is a problem on the Azure platform, then you also have a problem. You can trust Microsoft Azure, and you can rely on the platform; it is truly the best suite of cloud products and features available. It is a stable platform, but it would be good practice to know and keep track of its general status. You want to know if there are any platform issues or changes that have impacted you, and you want to find out why those changes or transient issues had impact. Knowing and learning how Azure works will lead to an understanding that Azure is not only some architecture; there is also a massive amount of code and technologies working behind the scenes that keep all the components working together. The more you can learn about that, the more you can design and tweak your application to run on the platform. Azure Service Health is a tool that you can use to monitor what is happening on the platform. Take a look at Figure 9.2, which illustrates how Azure Service Health aka Service Health appears in the Azure Portal.
The output from this Azure feature is a report of service events, planned maintenance, health advisories, and security advisories. There exists also a feature for filtering and the history of platform health–related events by subscription, region, and service, where the service is something like Azure Virtual Machines, Azure SQL, or Event Hubs. To achieve this, select the option from the drop‐down lists shown in Figure 9.2. This filtering is helpful when performing root‐cause analysis of a disruption that was logged by one of your workloads running on the Azure platform. You could check the history, listed at the bottom of Figure 9.2, to see whether any of your services had an event that happened around the same time as your application incident. There is also a feature named Health Alerts, which you can see on the navigation menu in Figure 9.2. Access this feature either from the navigation menu or by clicking + Add Service Health Alert on the main overview blade, also shown in Figure 9.2. This feature will proactively send you information about any incident based on event type, i.e., service issues, planned maintenance, health advisories, and security advisories, that might have an impact on your Azure workloads. You can project the notifications by selecting specific subscriptions, regions, and services for those events and even send those events to specific people or groups for notification and possible reaction.

FIGURE 9.2 Azure Service Health Azure Portal blade
The concept of resource health has been a common theme throughout the book. In Chapters 4 and 6, application health was called out. In Chapter 6, there was a mention of Azure Health Monitor aka Azure Monitor and Azure Status, which should have provided clarity. As a reminder, Azure Status is located at status.azure.com and is useful for getting an overall view of what is going on with Azure.
In summary, Azure Service Health is focused on monitoring the Azure platform. If provides you with capabilities for being alerted when a platform event may have impacted your provisioned Azure products. It will also, in many cases, provide a root‐cause analysis (RCA) of what happened, why, and what is being done to prevent it in the future. Those messages are helpful for status meetings with management or business leaders. Also, in many cases there will be some tips on how you could better configure your workload to better react and respond to these kinds of events. Let's now get into Azure Monitor, which is helpful for logging and analyzing the Azure platform and some aspects of your IT solutions running on Azure.
Azure Monitor
This is the Azure service to start with when you want to design your Azure monitoring strategy. As you learned in the previous section, Azure Monitor is focused more on the platform than on the application. The word application has been used a lot in this book and can be a bit ambiguous. Some might interpret an application to mean the custom source code that you or your development team wrote that is running on a server. Others might abstract the meaning up or out a few layers. Are dependent code libraries or hardware drivers considered the application or part of the application? It would be generally accepted to consider an application as one component of your IT solution in totality. What you are going to learn in the following exercise is how to monitor the later definition of what an application is. An application is not the platform, and it's not the code; rather, it's a shared space between the two. With that understanding, recognize that the information placed into Log Analytics is mostly platform diagnostics. The diagnostics are metrics such as the number of connections, CPU, Azure resource CRUD operations, autoscale events, etc. Those metrics are not embedded into your custom code; they are generated from the operating system or platform.
It has been a common theme in the book that Microsoft is responsible for monitoring the platform and not the code running your application. You must include the log creation logic within your source code to track, log, and manage code exceptions. What you will learn in this section is that Azure Monitor and Log Analytics are a step closer to your code, but there is nothing in your application code to log unless you specifically placed it there. You will learn later, though, that Application Insights (AI) provides you with some metrics that are closer to the code than Azure Monitor or Log Analytics via a software development kit (SDK) to place unique code‐specific logging logic directly into your code. That data is then written into Log Analytics, which will support the querying of raw data or data that is graphically viewed in the Azure Portal. Complete Exercise 9.1 where you will configure an Azure Monitor and enable diagnostic monitoring.
That's good work—you configured some insights for an Azure virtual machine, you created a Log Analytics workspace for those insights to be stored into, and you configured diagnostic settings for one or more Azure resources. The first action you took in Exercise 9.1 was to look at the activity logs of Azure resources across the subscription. The Activity Logs navigation menu item is available on each Azure product Overview blade. If you have a lot of products, reviewing them one by one isn't feasible, so you have this Azure Monitor interface for seeing what is going on across the subscriptions. You also learned that you can retrieve the activity logs using Azure CLI and target a specific resource group. In all cases, there is a large amount of data. Therefore, it would be prudent to optimize your queries toward the specific kind of information you seek. Perhaps only look for errors or updates to Key Vault private keys; the tool is flexible but is up to you to decide what your application requires. An interesting point to call out in Figure 9.5 is that the
METASPLOITABLE‐VHD1
Azure Virtual Machine isn't able to be monitored. Monitoring requires a service to be installed on machines for monitoring, something like what was discussed shortly after EXERCISE 8.3 (i.e., Windows Azure Guest Agent). The reason for the message in Figure 9.5 is most likely because the OS that was deployed to the Azure VM is not considered a blessed, endorsed, or supported Linux image. Keep that in mind when you troubleshoot this kind of configuration running Linux OS, make sure the OS is endorsed.
In Figures 9.5, 9.6, and 9.7, you will see toward the top of the image items shown as Performance and Map. The Performance blade, as mentioned in the exercise, will show you the basic, default server metrics such as CPU utilization, memory consumption, and throughout. These metrics are useful and can be used as the early warning signs that there may be some trouble brewing. The other item is Map, which is illustrated nicely in Figure 9.7. This is a nice representation of the Azure VM properties, events, alerts, and connections. When you see visualizations such as this, the important aspect is that you look at it often, learn what is normal for your application, and if the picture suddenly looks different, take an action to find out why. There is another point to call out that you experienced in Exercise 9.1, specifically in step 7 where you configured the Destination detail for the Diagnostics settings, as shown in Figure 9.8. There were three options.
- Send To Log Analytics
- Archive To A Storage Account
- Stream To An Event Hub
In the exercise, you chose to place the selected logs to be sent to a Log Analytics workspace. You will learn more about that in the next section; however, you could have also chosen to place them into an Azure Blob storage container in JSON format. You could then write a custom application to query and report using that JSON document. The other option is to stream the logs into an Event Hub. You learned about Event Hubs in Chapter 6 and that it's a messaging service. The data wouldn't/shouldn't exist long in that location, so if you choose this one, there needs to be a consumer that will process the messages being sent to the Event Hub. This is an option where you might need to be analyzing and alerting application health in almost real time. Finally, note that there are some default limits for Azure Monitor; see Table 9.1 as a sample of the limits.
TABLE 9.1 Azure Monitor Limits
| Resource | Default Limit |
|---|---|
| Alerts | 2000 per subscription |
| Email alert notifications | 100 per hour |
| SMS | 1 every 5 minutes |
| KUSTO Queries | 200 per 30 seconds |
| Storage limit | 500MB–unlimited |
| Data retention | 7–730 days |
If you ever find that some logs are missing, then that may be due to one of the default limits. These limits are in place to protect you because the consumption of this resource has a cost; it is not free. If you need more than the defaulted limit, you can create a support case with Microsoft, and the limits can be increased or some feedback given on how to optimize your logging strategy. Keep in mind also that some limits are based on the pricing tier you selected when creating the Log Analytics workspace. Storage limits and data retentions are based on the pricing tier, so take a look at them when you need to determine your need. The pricing tier can be changed after creation, so perhaps begin small and grow as your needs require.
Log Analytics
Like many other Azure products, this isn't the first time you are exposed to Log Analytics. As you approach the end of the book, a big majority of the cloud concepts, Azure products, and features have already been covered. In the previous exercise, specifically in step 5 you created a Log Analytics workspace. Its creation was simple, in that it required only a location, a name, and a pricing tier. As you can see in Figure 9.1, it is the place where the logs and metrics are stored for reporting and alerting capabilities. The Log Analytics workspace has a lot of features, so take a look at them in the Azure Portal. Navigate to the workspace you created previously. There shouldn't be many options in the navigation menu that are unknown. Click the Logs navigation menu item. You will see something similar to that shown in Figure 9.10.
In the previous exercise, you enabled Diagnostic settings for one or more Azure products. It takes some minutes for the data to begin flowing into the workspace, but once it starts flowing, you can query the information by using the following query. The query and the output are also visualized in Figure 9.10. Clicking the Run button executes the query.
AzureDiagnostics| project Category| summarize Count = count() by Category| order by Count desc nulls last

FIGURE 9.10 Querying diagnostics in the Log Analytics workspace
The data for update management, change tracking, inventory, and other compliance and tracking data are also logged in a Log Analytics workspace. All the data is bound together in some way; this area is still evolving but is useful for getting some information about how your applications and application dependencies are behaving. Those kinds of metrics are helpful in taking proactive measures to manage growth and consumption as well; they are helpful in troubleshooting a current issue or finding a root cause of a historical issue. There are also limitations when it come to the Log Analytics workspace, as provided in Table 9.2.
TABLE 9.2 Log Analytics Limits
| Resource | Default Limits |
|---|---|
| Workspace limit | 10–unlimited |
| Returned rows in portal | 10000 |
| Max columns in a table | 500 |
| Max column name length | 500 |
| Data export | No supported |
| Data Ingestion | 6GB/min |
There is a free tier for a Log Analytics workspace, which is the one that has a limit on the number of workspaces per subscription. Also notice that it is currently not possible to export the data you store into the workspace. This is the current situation; it might change in the future. Lastly, the more diagnostic logging you configure, the more data that is generated. Note that there is a limit on the amount of data that can be placed into the workspace per minute.
Application Insights
Application Insights has a rather large set of capabilities. To begin with, you already know the difference between Log Analytics and Application Insights, right? Take a moment to remind yourself in what scenario you would look into Log Analytics data versus Application Insights. Figure 9.11 shows some additional differentiation, specifically, table names into which metric data is stored.

FIGURE 9.11 Application Insights versus Log Analytics workspace logs
Earlier there was an attempt to compare these two components that have been merged into the Azure Monitor service. I tried to explain how Log Analytics stores more platform‐specific information, while Application Insights stores application and code data. Specifically calling out that the Event table shown for Log Analytics is more platform‐related, you would expect to find within it what you see in the Event Viewer on a Windows server. Exceptions or request tables accessible through Application Insights are, simply by name, more associated to the code and an application than to a platform. It is hopeful now that the relation (or lack of relation) between the two is clearer. Also, as illustrated in Figure 9.11, it is possible to perform queries across the two data repositories, both of which are ADX clusters. This will become more obvious later.
Take a look back at Figure 9.9, and you will see the Applications link in the navigation menu. Navigate back to the Azure Monitor blade and click that link. On that link you will be provided with the ability to add a new Application Insights service. It is a simple process and requires only a subscription, a resource group, and a name. Once created, navigate to it and click the View Application Insights data link and notice two specific items. The first one is on the Overview blade; there is an attribute called the Instrumentation Key that looks a lot like a GUID. This is the piece of information that uniquely identifies your AI logs. The Instrumentation Key is a necessary, required piece of information for configuring AI logging from within application code. In an ASP.NET Core application, you wire the two together in a configuration file; it resembles something similar to the following:
{ "ApplicationInsights": {"InstrumentationKey": "appInsightsInstrumentationKey"},"Logging": {"LogLevel": {"Default": "Warning"}}}
Then you install and configure the
Microsoft.ApplicationInsights.AspNetCore
NuGet package to create logs into the AI service as desired. This is what is truly meant by “application code monitoring” because the logging capability is really inside of the custom code running on the Azure platform. Next, take a look at the navigation menu items available for AI, and you will find one named Logs. Click Logs, and you will have the same query interface as you see in Figure 9.10; however, the tables you will see are those specific to AI, as shown in Figure 9.11. On the Overview blade for AI, you will see an Application Dashboard link. Click it, and you will see some impressive default information. See Figure 9.12.

FIGURE 9.12 Application Insights—Application Dashboard
Before continuing to the next section, be aware that for all Azure products there will exist a Monitoring section in the navigation menu in the Azure Portal. The contents in that section are standard and contain something similar to Figure 9.13. Note that in most cases all of them use the same backend technology for storing the data. Those tools allow you to configure, view, and in many cases manipulate the data. It also supports direct access so you can create your own tools and reports based on your exact requirements.

FIGURE 9.13 Monitoring section in Azure Portal
At the moment, only Azure App Services and Azure Functions have built‐in, default support for Application Insights. When creating either of those in the portal, you will notice a step is to enable that feature. Application Insights can be enabled later for those Azure products and can be enabled for any application by creating an AI service and using the Instrumentation Key within your code.
Azure Data Explorer
If you wanted to build your own custom monitoring and reporting system, this is a good place to begin that journey. You might have already realized that both Log Analytics and Application Insights, which are components within Azure Monitor, store the data onto the same type of data source. This storage location is commonly referred to as a KUSTO cluster or ADX cluster. Take a look at Figure 9.14.
You see that the cluster that Azure Monitor uses is a shared cluster, which means all Azure products that you have configured to use Azure Monitor will store their logs into that cluster. This is the location of the log storage which you created in Exercise 9.1, specifically, in step 5 where you enabled the monitoring for an Azure VM and selected a Log Analytics workspace. Behind the scenes, it configured and linked to an ADX cluster. Application Insights does similar work behind the scenes when you create it. In the Application Insights scenario, the ADX cluster is bound only to the clients that have the Instrumentation Key and is therefore considered private. Lastly, recall from EXERCISE 5.7 where you created a stand‐alone ADX cluster and database; then later in EXERCISE 6.5 you configured Event Hub to send information to the cluster. IoT Hubs and Azure Blob containers, in addition to Event Hub, have built‐in support for ADX integration. There exists also an Azure Data Explorer SDK; its NuGet package is named
Microsoft.Azure.Kusto.Ingest.NETStandard
and can be used from any client to send logs to the cluster. You have already had some exposure to the Kusto Query Language (KQL) in previous chapters and also in this one. If you would like to learn more about this query language, take a look here:
docs.microsoft.com/en-us/azure/data-explorer/kusto/query

FIGURE 9.14 Shared, virtual, and private ADX clusters
KQL has a lot of capabilities and feels similar to SQL. I haven't used KQL enough to find any significant differences it has with SQL or limitations. Both have worked well in the scenarios that they are designed for, and I have no complaints. Becoming an expert with KQL is an area where you will need to branch off from the book and investigate more in that area if it interests you. This seems like a good time for an exercise. In Exercise 9.2, you will add the Log Analytics workspace you created in Exercise 9.1 to Azure Monitor in ADX at dataexplorer.azure.com. You did a similar activity in EXERCISE 5.7 when you created a stand‐alone ADX cluster. Additionally, you will add Application Insights to the ADX cluster. By adding these to ADX, you will be able to visibly see them all in one place, which will be helpful when you create cross‐cluster queries. You can visualize cross‐cluster queries in Figure 9.14, as well as a proxy cluster. A proxy cluster is something you must create to query the shared instance of the ADX cluster.
That query is a template only and is intended to provide you with an example. You can probably recognize the possibilities and complexities with this. It is an interesting area. Before moving on to the next section, it is important to discuss the data retention and security topics regarding logged metric data. In Chapter 6, where you learned about governance and compliance, one of the topics had to do with the location, protection, and storage of data. When you create the Log Analytics workspace or an Application Insights monitor, part of the creation is the selection of its location, and you have control over that. Any Azure product or resource from any location will be able to write into the data store regardless of location. That means your data can remain in a specific geographical location regardless of where the data producers are located. Remember also that when you configured Azure Monitor for an Azure VM, part of the configuration was the selection of a Log Analytics workspace that is also bound, i.e., created in a chosen region. The point is that you have control of the location into which your metric and tracing data is stored. You might also consider an Azure Policy to prohibit the creation of a Log Analytics workspace into any region, which results in noncompliance to any of your privacy regulations.
The data that exists in the ADX data clusters is encrypted at rest by default. As well, all data communications between the SDKs and the portal happen over HTTPS, which means the data is encrypted in transit as well. Take a look back in Chapter 2 if you need a reminder of what the encryption of data at rest and data in transit mean. Also discussed in Chapter 6, specifically in the “Azure Cloud Compliance Techniques” section, there is some discussion about who has access to your data and how it is protected. Take a quick look back at FIGURE 6.8, which illustrates the different kinds of security around your data and where the responsibilities fall between you and the cloud provider. Finally, take a look at Table 9.1 where the limits for data retention for Azure Monitor are provided. For Log Analytics, the values are from 7 and 730 days and are based on your pricing tier or configuration. Application Insights is 90 days by default. The following sections are intended to show some of the monitoring features available per Azure component such as security, networking, compute, etc. The information provided is for starting your design of a monitoring strategy per vertical. As you have experienced in your career, monitoring is an area that typically doesn't get the attention or investment it deserves. Monitoring is a rather complicated area and typically has great impact on troubleshooting and forecasting and is worthy of focus and capital investment.
Azure Monitoring by Component
This book is organized in a way that your migration or initial consumption is performed on the Azure cloud platform. The order in which you design the deployment of your workloads onto Azure will have a higher probability of success if your plan flows in the same sequence, i.e., security, network, compute, data, etc. Knowing what is going on with your IT solutions after deployment to Azure is complete is a must‐have component. You probably cannot imagine running an IT organization without some kind of reporting and metrics that explain how things are going. The following will provide some insights into monitoring features per Azure components. You should consider including these monitoring concepts into the initial design of your approach for each component and then build your customization on top of them. Waiting until the end of your project to consider monitoring, after the workloads are running on Azure, may result in not receiving the investment required to complete this important part of your IT support model. You might find yourself in a troubleshooting scenario and not have any information to help you resolve the issue.
Monitoring Security
There are three fundamental areas to monitor regarding security on Azure. They are Azure Active Directory, RBAC, and your Azure products. There is one additional, your application security; however, that is dependent on your application requirements and behaviors, so that's not covered much here. Like many other Azure products, you will find the Diagnostic settings and Logs menu item on the navigation blade; it exists for Azure Active Directory as well. Once Diagnostic settings are configured, the logs are placed into a Log Analytics workspace and become available for KQL querying. There are two tables added to the data store when you enable Azure Active Directory (AAD) diagnostics,
AuditLogs
and
SigninLogs
. The audit logs provide information about an identity that can then be linked to activities performed in the portal, for example. If you wanted to see who made a change to an RBAC group, you could analyze this table to find that out. The sign‐in logs will provide just that, namely, who attempted to sign in and what was the status. Table 9.3 summarizes the current
AuditLogs
and
SigninLogs
table schema.
TABLE 9.3 AAD Diagnostic Log Table Schema
| AuditLogs | SigninLogs |
|---|---|
| AADOperationType | AADTenantId |
| AADTenantId | AppDisplayName |
| ActivityDateTime | AppId |
| ActivityDisplayName | Category |
| AdditionalDetails | ClientAppUsed |
| Category | ConditionalAccessPolicies |
| CorrelationId | ConditionalAccessStatus |
| DurationMs | CorrelationId |
| Id | CreatedDateTime |
| Identity | DeviceDetail |
| InitiatedBy | DurationMs |
| Level | Id |
| Location | Identity |
| LoggedByService | IPAddress |
| OperationName | IsRisky |
| OperationVersion | Level |
| Resource | Location |
| ResourceGroup | LocationDetails |
| ResourceId | OperationName |
| ResourceProvider | OperationVersion |
| Result | OriginalRequestId |
| ResultDescription | Resource |
| ResultReason | ResourceProvider |
| ResultSignature | ResourceGroup |
| ResultType | RiskDetail |
| SourceSystem | RiskLevelDuringSignIn |
| TargetResources | RiskState |
| TimeGenerated | UserId |
| Type | UserPrincipleName |
Those table columns should give you an idea of what is stored and how the data within them could be used. The information stored in the
AuditLogs.ResourceProvider
column, for example, would show the Azure resource an action was taken on. The
SigninLogs.RiskLevelDuringSignIn
column would determine how risky the login was. In Chapter 2, you learned that the values for this risk can be High, Medium, or Low and are calculated by sophisticated Azure platform security algorithms for you. Consider the following KUSTO query and recall from Figure 9.10 the + New Alert Rule feature; you see it also in Figure 9.16. That feature will allow you to configure an alert when the specified query retrieves a specific number of results in a given timeframe.
SigninLogs| where RiskLevelDuringSignIn == "High"

FIGURE 9.16 Log Analytics altering
There are many options for creating queries and setting alerts based on their findings. It is only a matter of your requirements, your creativity, and the cost. Keep in mind that these alerts will cost, because some compute power is required to execute and analyze the result on your behalf. From a role‐based access control (RBAC) perspective, the best way to monitor that is by selecting the Activity Log navigation menu item. For example, click the Activity Log navigation on a resource group, a specific Azure service, or at the Azure subscriptions level to get the report of what happened at each of those levels. Add a filter to the log and look for the following operations:
- Creating A Role Assignment
- Deleting A Role Assignment
- Creating Or Updating A Custom Role Definition
- Deleting A Custom Role Definition
Figure 9.17 shows the output of such a query using the activity log feature for an Azure subscription. You can click the results and filter down into the details of the log. You will also notice the Logs link, which will open the Log Analytics workspace console where you can pull the same information using KQL queries.
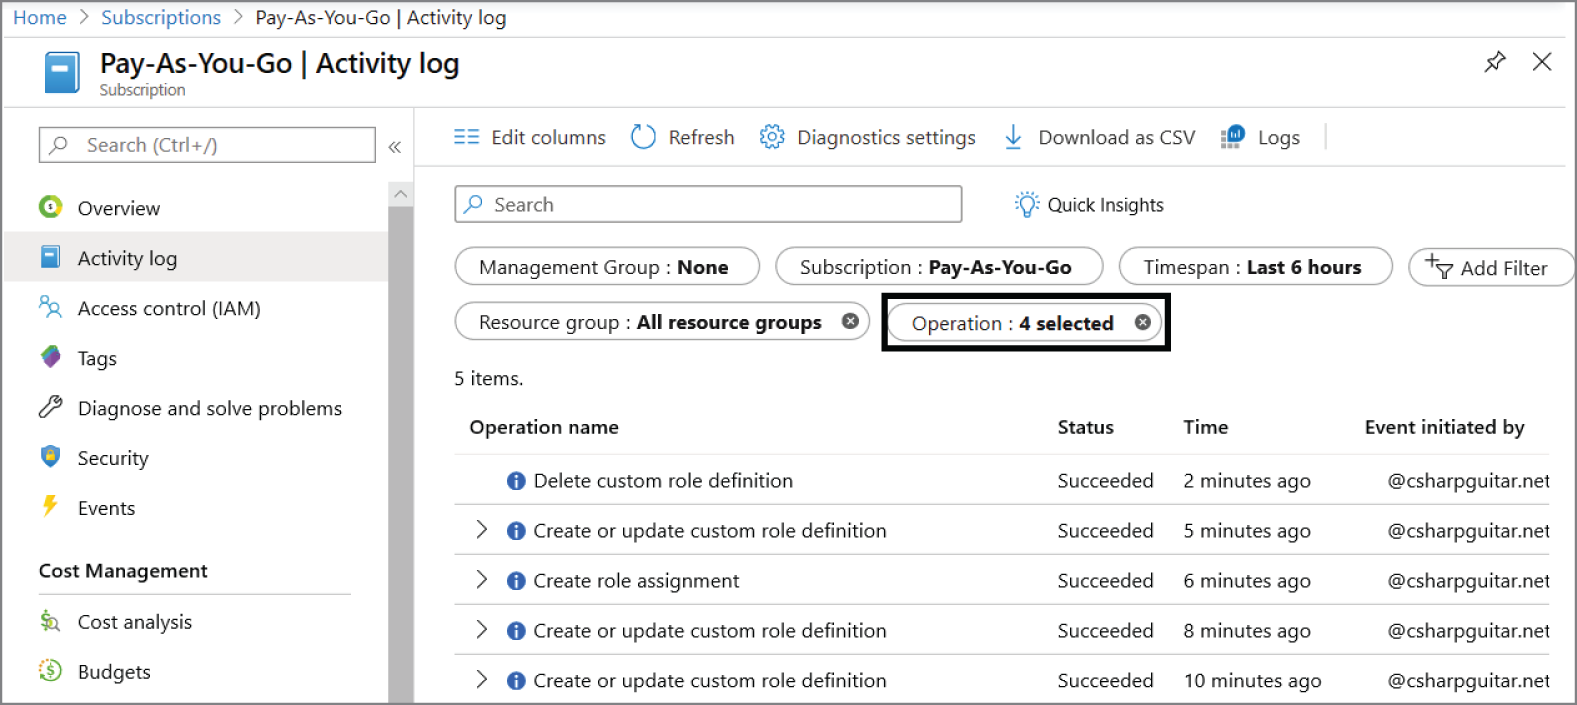
FIGURE 9.17 RBAC activity log in the Azure Portal
The last monitoring component for security has a focus on your Azure products, resources, and platform. You know about Security Center, which has many capabilities for looking after your workloads and resource in your Azure footprint. Specifically, on the Security Center blade, you will see a navigation menu item named Security Alerts under the Threat Protection header. Click this to see occurrences where the platform has identified suspicious behaviors, for example, the identification of accesses from an unknown location or IP address range. There is also a platform feature named Azure Sentinel that was introduced in Chapter 2 and more in Chapter 6. Azure Sentinel is a security information and event management (SIEM) security system that utilizes artificial intelligence to monitor the platform for activities matching known malicious behaviors.
Monitoring Network
With both IaaS and PaaS, the networking aspects of your IT department have been outsourced once you are running on Azure. Therefore, you need not worry too much about that, that is, until you start getting some latency issues and have reviewed everything else and haven't found the reason. If that is the case, a go‐to tool is Network Watcher. With Network Watcher you can diagnose VM routing problems and log VM network traffic. You performed an exercise in Chapter 3, EXERCISE 3.1, where you utilized Network Watcher. In that exercise, you worked with it via Azure PowerShell, but there is also a rich set of capabilities available in the Azure Portal. Take a look at FIGURE 3.48 where you see how Network Watcher rendered a topology of your network. On the Network Monitor blade, you will find a link in the navigation menu called Connection Monitor. This feature will provide you with the means for monitoring connectivity and latency metrics between two Azure VMs, as well as track any changes to the network topology. You will find numerous additional troubleshooting tools in the Network Monitor navigation menu.
There is also a nice feature that hasn't been discussed up until now. It's called Metrics, which you will find on the Azure Monitor blade; see Figure 9.18. In my pursuit to find more options for monitoring networking and the connectivity between machines, I found this web page: docs.microsoft.com/en-us/azure/azure-monitor/platform/metrics-supported. It describes all the supported metrics based on resource provider; see TABLE 8.4 as well as a refresher on the products covered in this book. The resource provider of interest is
Microsoft.Network/*
.

FIGURE 9.18 Azure Monitor metrics
As you see in Figure 9.18,
Microsoft.Network/networkInterfaces
and
Microsoft.Network/networkWatchers
are added to the metric. Table 9.4 shows the metrics available for each.
TABLE 9.4 Networking Azure Monitor metrics
| Network Interfaces | Network Watcher |
|---|---|
| Bytes Received | % Probes Failed |
| Bytes Sent | Avg. Round‐trip Time (ms) |
| Packets Received | Checks Failed Percent |
| Packets Sent | Round‐Trip Time (ms) |
There exists a lot of information to capture, store, and analyze your Azure products. You will need to spend some time on this to find the reports and products that provide the information required to answer the questions you are being asked or are asking yourself. Interpreting the data into an actionable set of tasks comes with experiences not only with the technology but with the product that you are analyzing. All applications have their own unique behaviors that can only be learned over time while working with them.
There is one more networking appliance that needs to be covered in this section, and it is the WAF/Application Gateway. In many scenarios, this is the entry point into your internet‐accessible Azure workloads. The endpoint is globally accessible and therefore likely needs some additional monitoring. Be certain that if you have configured Security Center and/or Azure Sentinel that you get malicious behavior notifications and preventative tips/actions by default. If for some reason those features are too costly, you can monitor some Application Gateway behaviors using the Azure Monitor metrics. As you saw in Figure 9.18 and earlier, there is a link, + New Alert Rule, on the Metrics blade. Once you identify a baseline that describes the normal behavior for your appliance, if there is something that exists outside of this normalcy, then you can be alerted or send alerts to the team, which should take the action.
Monitoring Compute
The Monitoring component is where I think you will spend most of your time configuring, optimizing, and analyzing metrics. This is where your application is running and is the location where your customers, users, clients, or employees will report as the source of the problem. Not only is it important to have the metrics configured, alerts created, and your IT support team notified, it is crucial to have actions in place to respond to those alerts and take actions when they occur. When designing a monitoring solution for Azure compute, it would be a good approach to categorize compute into the following cloud service models. These models were introduced in Chapter 4; see also FIGURE 4.1 as a refresher.
- IaaS: Azure Virtual Machines
- CaaS: AKS and ACI
- PaaS: Azure App Services
- FaaS: Azure Functions
Azure Virtual Machines, as you may have noticed, is the odd one out when it comes to the available features for monitoring. When I say odd, I really mean best. As you learned in Exercise 9.1 versus what you have seen when configuring other Azure resources in Azure Monitor, Azure Virtual Machines works a little different. This is mostly because of legacy technology; Azure Virtual Machines was the first product offering Azure had, and many customers are dependent on how it currently runs, so making a change to how they operate and log metrics isn't to be taken lightly. However, over time the Azure team has learned some lessons and identified opportunities for optimization and simplifications and then made enhancements based on those findings. Some of those enchantments cannot be added to Azure VM metrics due to compatibilities, which is the reason for the differences. The monitoring features I refer to are the following and have already been covered in great detail throughout this book:
- Update management (Figure 8.44)
- Change tracking (Figure 6.14)
- Configuration management
- Inventory
- Security Center: Compute & Apps (Figure 6.13)
For the other Azure compute products, the monitoring capabilities exist as shown in Figure 9.13 and listed here:
- Insights aka Application Insights
- Metrics
- Logs
- Diagnostic settings
- Alerts
In addition, do not forget about Azure Automation runbooks, which can be used to monitor not only Azure compute but most anything imaginable. Take a look at Figure 9.19, which illustrates the search results for Process Automation Runbooks, filtered where an associated tag equals Monitor. You can reuse them or modify them a bit to meet exactly what you want to monitor.

FIGURE 9.19 Azure Automation Monitor runbook templates
When configuring the Metrics feature for Azure App Services and Azure Functions, you will find them to be similar, especially when the Azure Functions trigger is from HTTP. Find some examples of metrics for the
Microsoft.Web/sites
resource provider in Table 9.5.
TABLE 9.5 Azure App Service and Azure Functions Metrics
| Azure App Service | Azure Function |
|---|---|
| Http5xx | Http5xx |
| MemoryWorkingSet | MemoryWorkingSet |
| Gen0‐2Collections | Gen0‐2Collections |
| HealthCheckStatus | Health check status |
| Requests | FunctionExecutionUnit |
| ResponseTime | FunctionExecutionCount |
| Handles | RequestsInApplicationQueue |
| Threads | FileSystemUsage |
| CurrentAssemblies | CurrentAssemblies |
For Azure App Service metrics, you will find that they have much of the same details you would find when looking at IIS web server logs. There is a lot of information stored that can give you a good overview of what is going on with that product and, in some cases, the application.
Monitoring Data
Monitoring your data store has a lot to do with the cloud model on which it is hosted and the kind of DBMS. If you're running a SQL Server virtual machine, then you would want to make a hybrid monitoring solution using what you learned in the previous compute section combined with stand‐alone SQL Server metrics. If the data store is an Azure SQL or Azure Cosmos DB, then you can use the common monitoring components such as Metrics, Diagnostic settings, and Logs (i.e., Log Analytics). Take a look at Table 9.6, which summarizes the metrics available for Azure SQL and Azure Cosmos DB data stores.
TABLE 9.6 Azure SQL and Azure Cosmos DB Metrics
| Azure SQL | Azure Cosmos DB |
|---|---|
| allocated_data_storage | DataUsage |
| blocked_by_firewall | DocumentCount |
| connection_failed | DocumentQuota |
| connection_successful | IndexUsage |
| cpu_percent | RegionFailover |
| deadlock | ReplicationLatency |
| dtu_consumption_percent | ServiceAvailability |
| dtu_used | TotalRequests |
| storage_used | UpdateAccountKeys |
The Azure Cosmos DB has a nice graphical representation of the metrics in the portal, as shown in Figure 9.20.

FIGURE 9.20 Azure Cosmos DB metrics
Notice the tabs across the top of the Metrics blade: Overview, Throughput, Storage, Availability, Latency, Consistency, and System. Those metrics and their visualization should give you a good overview of what is going on with your Azure Cosmos DB. From an Azure SQL perspective, you will find similar metrics and diagnostics. What I want to follow up on here is the exercise that you performed in Chapter 6, which had to do with setting sensitivity levels on specific columns on a database table. Take a look back at EXERCISE 6.3 and view FIGURE 6.11, which may help you remember. You might take a moment and execute this Azure PowerShell cmdlet to confirm you have settings like this on an Azure SQL table and to see what the settings are. The output would resemble something similar to that shown in Figure 9.21.
Get-AzSqlDatabaseSensitivityClassification -ResourceGroupName "<rgName>" `-ServerName "<sName>" -DatabaseName "<dName>"

FIGURE 9.21 Azure SQL sensitivity level
That is great, but what about monitoring who is accessing it and how often it gets accessed. This can be monitored by using the Auditing feature for the Azure SQL database. You will find this feature in the portal on the Azure SQL database blade under the Security header. It is disabled by default, and you will first need to enable it; only then will the monitoring of the access be logged. Once enabled, notice a menu item named View Audit Log at the top of the Auditing blade. Click it and then click the View dashboard link, and you will be presented with an overview, as illustrated in Figure 9.22.

FIGURE 9.22 Azure SQL sensitivity‐level overview
When you compare the settings in Figure 9.21 and in Figure 9.22, you will get an understanding of how they fit together. To create that report and generate the audit logs, I ran a
SELECT
query numerous times against the
MODEL
table on the
guitar
database. To get more access details, click the Azure SQL – Access to Sensitive Data metric, as shown in Figure 9.22. You will find information about who performed the query and from which client; see Figure 9.23. There are certainly ways to find out which columns and tables the queries were accessing using KQL on Log Analytics too. Which database, table, and query that are running are important pieces of information, but they are apparently not part of the default reporting feature. Instead, only the numbers of times access to tables and columns with this type of status are provided, i.e., not the table and column names specifically. However, you can get them manually using Log Analytics and KQL and then export the result as CSV and create your own reports in Power BI or Excel.

FIGURE 9.23 Azure SQL sensitivity level who, how often, and from where
There are also many metrics for data storage products such as Azure Blob containers, Azure Queues, Azure Files, and Azure Tables; see Table 9.7 for a summarized list of existing, helpful metrics for monitoring Azure storage.
TABLE 9.7 Blob, Queue, and Table Storage Metrics
| Azure Blob | Azure Queue | Azure Files | Azure Table |
|---|---|---|---|
| BlobCapacity | QueueCapacity | FileCapacity | TableCapacity |
| BlobCount | QueueCount | FileCount | TableCount |
| ContainerCount | QueueMessageCount | FileShareCount | TableEntityCount |
| Transactions | Transactions | Transactions | Transactions |
| Ingress/Egress | Ingress/Egress | Ingress/Egress | Ingress/Egress |
| Availability | Availability | Availability | Availability |
Don't forget about Storage Explorer, which was introduced in Chapter 5. Take a look back at FIGURE 5.10 and read about that product more there. Those tools give you some good overview and monitoring capabilities. Additionally, activity logs are helpful for data storage products and show you specifically which actions have recently been taken on the configuration of the specific Azure storage product. You will find the Activity Logs navigation menu item on all Azure product blades in the Azure Portal.
Monitoring Messaging
As you learned in Chapter 6, there are four Azure messaging services: Event Hub, Service Bus, Azure Storage Queue, and Event Grid. The common monitoring features are found for each of the messaging services on their respective Azure Portal blade. See Table 9.8 for information about which monitoring services are available for which messaging service.
TABLE 9.8 Azure Messaging Monitoring Support
| Monitor | Event Hub | Service Bus | Storage Queue | Event Grid |
|---|---|---|---|---|
| Alerts | ✓ | ✓ | ✓ | ✓ |
| Metrics | ✓ | ✓ | ✓ | ✓ |
| Diagnostic settings | ✓ | ✓ | × | ✓ |
| Logs | ✓ | ✓ | × | ✓ |
| Insights | × | × | ✓ | × |
An important aspect to consider with those Azure products is at which level you want to monitor. Event Hubs and Service Buses have a namespace into which you place hubs for Event Hubs and queues or topics for a Service Bus. An Azure Storage Queue exists within a storage account, and an Event Grid can contain one or more topics existing within an Event Grid domain. You would probably like to have some monitoring metrics on the applicable namespace, account, or domain and the part of the product that is receiving and managing the events or messages. This is something you need to take specific actions to differentiate and configure. You should again look at the available metrics here to determine which specific logs you need:
docs.microsoft.com/en-us/azure/azure-monitor/platform/metrics-supported
As you see in Figure 9.24, there are some metrics available on the Overview blade for each of the messaging services by default.

FIGURE 9.24 Azure Messaging metrics examples
Monitoring Compliance
Once you have implemented your compliance and governance rules, the whole idea behind it is monitoring those rules and making sure people and IT systems adhere to the rules. In Chapter 6, you were introduced to Azure Policy and saw in FIGURE 6.3 that the entire Policy Overview blade is dedicated to showing you the status of the policies that you have created and applied. You also learned that when you are not in compliance that the Azure Policy feature will provide you some tips that define some steps to help you become compliant. There also exists some details and metrics, in regard to policy and compliance within Security Center. Take a look back at FIGURE 2.49 and FIGURE 6.9, which show metrics concerning regulatory compliance.
Additional Monitoring Topics
You can monitor numerous additional areas. In this section, you'll find a short summary of monitoring deployments and how tags and labels contribute to a better monitoring experience.
Deployment Logs
If you ever wanted to get an overview of the deployments that are happening within your subscription, there are two places to look. This is not concerning the monitoring of application code deployments that was discussed in Chapter 7, rather, deployments of and to Azure products, features, and services. One interesting point is checking the deployments that happen within a resource group. As you can see in Figure 9.25, there is a header named Deployments that exists on the resource group's Overview blade. Beneath the header there is a link that shows the number of failed and successful deployments.

FIGURE 9.25 A view of deployment status from the Azure Portal
If you click the link, you will get the details of each deployment. There is also a navigation menu item named Deployments, also shown in Figure 9.25, which will direct you to the same list of failed or successful deployment details. The activity log will show you all operations that have taken place in the select context for the selected timeframe. Context means, for example, that a resource group and timeframe is perhaps the previous six hours. The same list of operations can also be run in the subscription context where you would get a wider view on what has taken place.
Tags and Labels
Both tags and labels were introduced in Chapter 6 and are helpful from a monitoring perspective. They are helpful simply because tags and labels provide an extra queryable attribute to the metrics or logs that your Azure product, features, or your software applications generate. From a tag perspective, the example used in Chapter 6 had to do with identifying Azure resources by environment where the product could be production, testing, or development. Someone who has hands‐on and real‐time engagement with a specific application would likely know which servers and which Azure products are the production ones and which are not. It is common to place the environment of a server into its name; for example, naming an Azure VM as CSHARPGUITAR‐PRO or CSHARPGUITAR‐DEV would help identify them. However, what happens if you failover or the role of the server changes? Then this approach isn't so appealing. Having these tags are helpful for newcomers or people who are not actively engaged in the project to get some understanding of the environments quickly and safely. The labeling concept has to do with setting sensitivity levels of data or the management of documents that can or should be shared only with certain groups of people. You have been shown how to audit these kinds of elements that can help you remain in control and, of course, govern your Azure workloads and IT solutions and remain compliant with regulations.
That is all for monitoring. The most important takeaway is that you know what Azure Monitor, Log Analytics, and Application Insights are and with which use cases you would use them. It's now time to move onto the final section of this book.
Recover Azure Resources
If you reflect back a bit in your IT career up to now or perhaps to a time in your studies, you may remember losing a file. Perhaps it was a picture, a document, or a research paper that you didn't save for a while and your PC locked up. Either way, I think we have all had those moments. These are moments where you think, why didn't I back that up or why didn't I save more often? After some time, in most cases, you forget about it and recover from it, but did you really take any action to prevent it from happening again? Probably not. It is likely you rewrote what you lost, and, over time, you simply moved on. The unfortunate reality is that this behavior is often carried over into the professional IT industry; however, the impact is much greater, and the ability to simply move on is in some cases not possible. What does a company move on from if it has lost its data and source code? Starting over is not an option when there are high costs and multiple people or organizations involved in doing so.
To avoid losing business IT data or applications, you need to have backups, redundancies, and disaster recovery plans. Running a company without having those three DR aspects embedded into the culture of the IT organization is a great risk. Azure provides products and features that help customers to design, test, implement, and maintain BCDR solutions. Azure Backup and Azure Site Recovery (ASR) were introduced in Chapter 1, so take a look over them again; both are covered again later as well. This section isn't the first time you would have read about BCDR; there are discussions in Chapter 3, Chapter 5, Chapter 6, and numerous other places in the book. Don't overlook this important aspect of IT and read further to learn more about the product and features Microsoft Azure provides for helping customers prevent catastrophic events that can destroy your business.
What Is BCDR?
When there is a disruption in your IT systems that impact your business operations, you need to have a plan of what to do, by implementing a business continuity and disaster recovery (BCDR) plan. The first step is to identify what constitutes as a disruption. Is it a disruption caused by a transient issue, is it an outage that might take several minutes or hours to resolve, or does it look like there will be some long‐term downtime? The first step is to have good monitoring, so you know what is really going on and then define the metrics that determine when to activate your BCDR plan. Once the metrics are clarified and the thresholds breached, you then execute the plan that can include changing routing on Azure Front Door, using Azure Traffic Manager (ATM), or making a DNS change to route a web address to a new IP address. It is also possible to failover to a replica of your production environment into a different region. There are many scenarios, and each plan needs to be described in detail based on the application requirement and maintained with ongoing updates to reflect any changes in the application architecture and behavior. Finally, once you have executed the failover and all is well, you need to determine whether you will now run your business in this state or whether you will work on getting the previous production back up and functional and then reroute your customers or employees back to it. There is so much work, stress, and complexities in those previous words having to do with the actual execution of a BCDR plan. Anyone who has ever been in that situation knows this; without a plan it is worse and very chaotic, but read through the remaining sections, and you will get some tips on how to make a situation like this more tolerable. Let's start with a closer look into business continuity specifically.
Business Continuity
Scenarios where you need these kinds of procedures are usually intense and complicated. They are complicated because in most cases no one has actually ever executed a BCDR process and the risks are high. The best way to uncomplicate any scenario is to break it down into smaller pieces and then learn and execute them one after the other. The concept of business continuity has to do not only with IT continuity, but as the name implies, it describes how the business will operate if there is a disruption and isn't necessarily a technical aspect. Consider that your company works with partners that place orders for your product and the internet portal for them to do this is down. Is it possible to increase human resources in a call center to manually take these orders on paper and then enter them into the system later when it is back up? Another aspect would be to find out how long this business continuity process can exist before you need to activate your disaster recovery plan. How much impact the outage has on your business and how long it can remain in this state define the time when you begin to perform configurations on your production environment to route customers and employees to another instance of your application. Ideally, you have this environment and the plan to use it; otherwise, it's too late to build one when you are in crisis mode. Not having a plan is risky and would reflect badly on the IT organization if one is required and found not to exist.
Disaster Recovery
This portion of the BCDR plan is focused on the IT aspects and is much more low level. It starts when the thresholds that define an IT disruption are breached and means it's time to execute the plan. There is no going back from this point; making a decision like this is a huge risk because you most likely don't know if what you're about to do will be successful. Your IT organization has likely spent years if not decades getting the solution to work as it does now on its current environment, and you are now going to attempt to replicate that environment over the next few hours. These references are coming from a historical perspective driven by on‐premise or private data center scenarios. In those days the IT solutions were run on expensive trademarked hardware, and having a duplicate of production sitting idle was a conversation that couldn't get started; it was simply too expensive. However, in the cloud, where you can configure a disaster recovery (DR) environment and not use it, at a reasonable cost, changes the landscape a lot. Remember in the cloud you are charged only when the product or feature is consumed. Having a DR environment in the cloud has opened the DR conversation channel and resolves the main stopping point for having a BCDR plan, i.e., the cost. But you still need to plan; the plan needs to include thresholds, and the plan needs to be tested and maintained as required. The following section will provide you with some means for creating, testing, and executing the BCDR plan if ever you are required to do so.
Azure Recovery Services
The remainder of this chapter will cover some Azure products and features that are helpful with creating, testing, and executing a BCDR plan. The design part is too application‐specific, so that part will need to be done on a case‐by‐case basis. Some topics you might need to design, just for an example, are having a clear overview of what Azure resources you have that make up your IT solution. This is one area that has been pushed in many places throughout the book in regard to resource groups and tags, both of which are a useful feature for grouping together Azure resources that make up your IT solution. Once you know what you have, you need to determine whether you will create an exact replica of the environment or only parts of it. Remember one example in the previous chapter called out that you can export an ARM template that contains all of your Azure resources for a given resource group. That would only contain the provisioning piece of the Azure footprint, but it could be a start. If you decide to re‐provision the same workloads in another region, then using the ARM template might be an option. It wouldn't be recommended to attempt to deploy using the template while you are actually executing the BCDR plan. That approach would need to be completed beforehand because after provisioning you would then need to make configurations to the new platform. That's too much work to do in crisis mode.
If you only need to failover specific pieces of an application, then you need to identify them and make a plan to do so. Azure Traffic Manager (ATM) can do this for you automatically if you configure it to do so. For example, if one of your web servers becomes unhealthy, ATM will stop sending traffic to it, and if you have other web servers in other regions configured as failover, then you would experience only a transient outage. The same goes for your data stores such as Azure SQL, Azure Cosmos DB, or a SQL Server virtual machine. Each of those would have a different BCDR plan. The plan wouldn't only cover how to get the database back up and accessible but also how to make sure all the clients that connect to it are updated or notified of the new connection requirements. The next sections begin with a discussion concerning how you can capture an overview of what you have running on Azure. Ideally, you have those pieces organized in a way that make this easy. Then you will learn about backups that, if you make them, will get you into a position to recover from an incident that triggered the BCDR plan. Finally, you will perform some tasks that simulate a failover that would be one of the actions taken in a real‐world BCDR recovery plan creation. The last section in this chapter will give some details about specific recovery options per Azure product, similar to what was provided for monitoring previously in this chapter.
Azure Resource Graph
This Azure feature is helpful for determining what you currently have provisioned and running on the Azure platform. There is a tool named Azure Resource Graph Explorer where you can execute KUSTO queries (KQL) to gather information about your resources. As shown in Figure 9.26, a query can be executed to find all the resources that have a tag named Environment that is equal to Production.
You can also query for the same output as seen in Figure 9.26 using Azure CLI and the following command:
az graph query -q "Resources | where tags.Environment=~'Production' `| project name, type, location"
Once you get all the Azure resources you need in order to have a complete replica of your production environment, then you need to decide which ones you will include in the BCDR plan. Once that's decided, go through them all and make sure you know the schedules and the locations for all their backups. Take a look at the Azure Backup feature that can help you manage backups of your provisioned Azure resources.

FIGURE 9.26 Azure Resource Graph Explorer KQL query
Azure Backup
Before you can recover from data loss, a server crash, or an all‐out disaster, you must have something to recover from. You typically use a backup to recover from an incident where you have lost data or a server. Azure Backup is the tool you should choose for capturing backups for Azure VMs, Azure Files, and SQL Server virtual machine. Some details about creating backups have been covered in previous chapters, such as Chapter 4 for Azure VMs and Chapter 5 for data stores. Take a look at those chapters as a refresher in case you are jumping straight to this section and want more information. For this section, the following topics are discussed from an Azure platform perspective:
- Description of a backup
- How backups work on Azure
- Storing and managing backups
- Backing up other products
- Linux versus Windows backups
Like many other activities that are required to run a successful IT organization, making backups is a complicated endeavor. There is nothing simple about taking, managing, and restoring a system from a backup. You first begin by determining which specific servers you need to back up, as discussed previously. After that, you need to determine whether everything on that server is required to be backed up.
Description of a Backup
Remember that storage has a cost, so you wouldn't want to store more than is necessary. Storage is not one of the more expensive products available on Azure; however, it is never a good idea to spend more than you must. When an Azure Backup is performed on an Azure VM, the most common updated components are the files, folders, system state, and app data. The first two components are self‐explanatory, files and folders, which is what you see in Windows Explorer, for example. The system state would contain the registry, which may contain custom settings, environment settings, or process execution paths. You would agree that many applications have dependencies on other assemblies that are located in a specific location. Those configurations are considered the state of the system and are backed up by default when you configure Azure Backup. App data is commonly used for local temporary storage and to store application‐specific information. For example, if the application needs to parse a file, that file needs to be stored someplace temporary while the process works with it.
From a data store perspective, like SQL Server, the Azure VM on which it is running needs to be backed up, as just discussed, as does the database. The database itself, as you learned in Chapter 5, is simply a large file that the DBMS manages access to. Therefore, backing up a database is all about backing up a file and any specialized database configuration. How that works is covered in the next section; right now let's look at the different types of backup, which are provided in Table 9.9.
TABLE 9.9 Azure Backup Types
| Backup Type | Azure Product | Description |
|---|---|---|
| Full | VM/SQL | A complete backup of the entire source |
| Incremental | VM | A backup of changes since last backup |
| Differential | SQL | A backup of changes since last backup |
| Transactional | SQL | A log which enabled PITR restoration |
The difference between an incremental and differential backup is that a differential backup requires a full backup to perform a restore, because unchanged data is not included. When a differential backup is performed, only the data that has been modified is backed up. A differential backup decreases the storage requirements, network consumption, and time required to perform the backup, when compared to the other Azure Backup types. It is supported to perform a full data backup every day; however, you need to determine whether it is required in your scenario. Keep in mind, again, that storage has an associated cost, and if you have a 5GB database that you back up each day, the cost, like the amount of required storage space, could get big, fast. Watch out for that and make sure you optimize what and how often you back up. As you may recall point‐in‐time restore (PITR) from Chapter 5; see FIGURE 5.48, which is where you were exposed to this concept. PITR allows you to recover a database to its state up to a specific second. In contrast, an incremental or differential backup supports either daily or weekly schedules, meaning you could lose a day's worth of data without transactional backups. Can you live with that? Is it worth the cost? Those are questions you need to decide based on the criticality of the data and the impact its loss would have on your company.
How Backups Work on Azure?
Azure Backup relies on a number of different Azure products and services to perform a backup. The simplest way to back up an Azure VM or a SQL Server virtual machine is to utilize the Azure Backup extension, which is installed into the Azure VM agent running on the VM. After configuring Azure Backup for your VM, as you will do in Exercise 9.3, when you navigate to the Extensions blade in the Azure Portal for the VM, you will see the Microsoft Monitoring Agent installed; this is previously referred to as the agent.
In the previous chapter, you learned that Microsoft Azure Recovery Services (MARS) can be useful for deploying workloads to the Azure platform. The same is true for performing backups; take a look back at FIGURE 1.8 also, which illustrates the use of MARS for backing up both on‐premise and Azure VMs and storing them on Azure. Microsoft Azure Backup Server (MARS) and System Center Data Protection Manager (DPM) are useful tools for backing up on‐premise VMs to Azure. Both MARS and DPM require installation and configuration of server software and either the provisioning of an Azure VM or an on‐premise machine to run the server software. If you currently have a DPM license, then you or your company would already have the skillset required to perform those kinds of backups. In the case where you already have DPM, you would need to change the location where you store the backup to be on the Azure platform. If you do not have a DPM license, then you can use MARS for achieving the same backup capabilities as DPM. The benefit of DPM is that it is part of the System Center suite of tools. To learn more about System Center, read this page: www.microsoft.com/en-us/system-center.
Another option for performing backups and restores is to use an Azure Automation script. Azure Automation was discussed in the previous chapter. Scripting your backup activities would increase the scope of VMs you could maintain all at once and reduce the complexity and the chance of making any mistakes. In Exercise 9.3, you will configure a backup for an Azure VM; the configuration is performed on a single VM. If you have many Azure VMs and/or a SQL Server virtual machine that needs to be backed up, doing this one at a time wouldn't be feasible. Instead, you could script the backup process using a PowerShell script executed with Azure Automation. Complete Exercise 9.3 to learn how to configure an Azure Backup for an Azure virtual machine.
In the exercise, one of the steps required to configure Azure Backup was the creation of a backup policy. It contained three components: the backup schedule, snapshot recovery, and retention ranges. The backup schedule defines the frequency (daily or weekly), time, and time zone for which a backup is taken. As you may recall from Chapter 4, a snapshot is a copy of a disk that is bound to the VM and can be used to build replicas or, in this case, recover from a server crash. A snapshot doesn't carry with it the configurations and environment settings as they are when a backup is performed using Azure Backup. The amount of time a backup must be retained may be driven by a compliance or governance requirement. If your scenario has no reliance on either of those, then you need to determine how far back it would make sense to recover to. The timeframes would be different based on usage and how often the configuration or data changes over a given timeframe. How often you back up and for how long you retain the backup are unique to your application's scenario. However, in my experience and without being bound by any compliance, legal, or governance constraint, I wouldn't consider recovering to a database state more than one to two weeks ago. There are many constraints and conditions you need to consider; take the time to figure out what works best in your scenario.
After a few backups have run from the Azure Backup configuration, you performed inExercise 9.3, clicking the Backup link in the navigation menu will render something similar to that shown in Figure 9.27. You will see three states of restore points: Crash Consistent, Application Consistent, and File‐System Consistent.
When taking a backup of a data store or a VM, the best state in which it can be in is off. From a data store perspective, off means that the database is not accessible, and from a VM perspective, it means no client is connecting to it, and there are no jobs or services running on it. If the service that you are backing up is in use when a backup is run, then attempting to back up a file that is being accessed can hang, which can result in only partial data being backed up or only some of the expected content/configuration being backed up. All of those scenarios would result in some issues if you attempted to restore using one of the partially successful backups. Unless you take preemptive actions to make sure that your services being backed up are “off” when the scheduled backup is run, then you need to expect and plan for some troubleshooting when you attempt to restore it. This is the reason and purpose of those three consistency status codes. The reason is that you know how good the backup is, which helps you determine the probability of success if they are used to recover from an outage or crash.

FIGURE 9.27 Azure VM configured Azure Backup
Crash consistent wouldn't be considered a good backup. It means that the backup ran when the VM is in a stopped or deallocated state. The VM needs to be running but “off” in order to get a good backup, where “off” means that there are no activities happening, no programs running, and no user is accessing anything on the VM.
You may be able to recover and boot from one of these backups, but if that is all you see on the Backup blade, consider running a backup manually to make sure you have at least one. Application Consistent is the status you want to see. This one means that the backup was successful, and all aspects of the backup were successful. Using a backup in this state for a restore would offer the highest probability of success. As you might expect then, File‐System Consistent is between the two and means some or part of the backup failed. The reason for the failure can be caused by the VM not being “off” when the backup is executed. Not being “off” can cause issues like the ones mentioned earlier, one of which is a file, which is currently being accessed and is therefore locked and cannot be accessed by the backup process.
Storing and Managing Backups
When you configured Azure Backup for an Azure VM in Exercise 9.3, part of the configuration was the provisioning of an Azure Recovery Services Vault. A recovery vault was also called out in Chapter 8 and shown using FIGURE 8.4, which shows the Site Recovery dashboard, which is also discussed later. The dashboard of interest now is the one focused on the Backup tab and is illustrated with Figure 9.28.
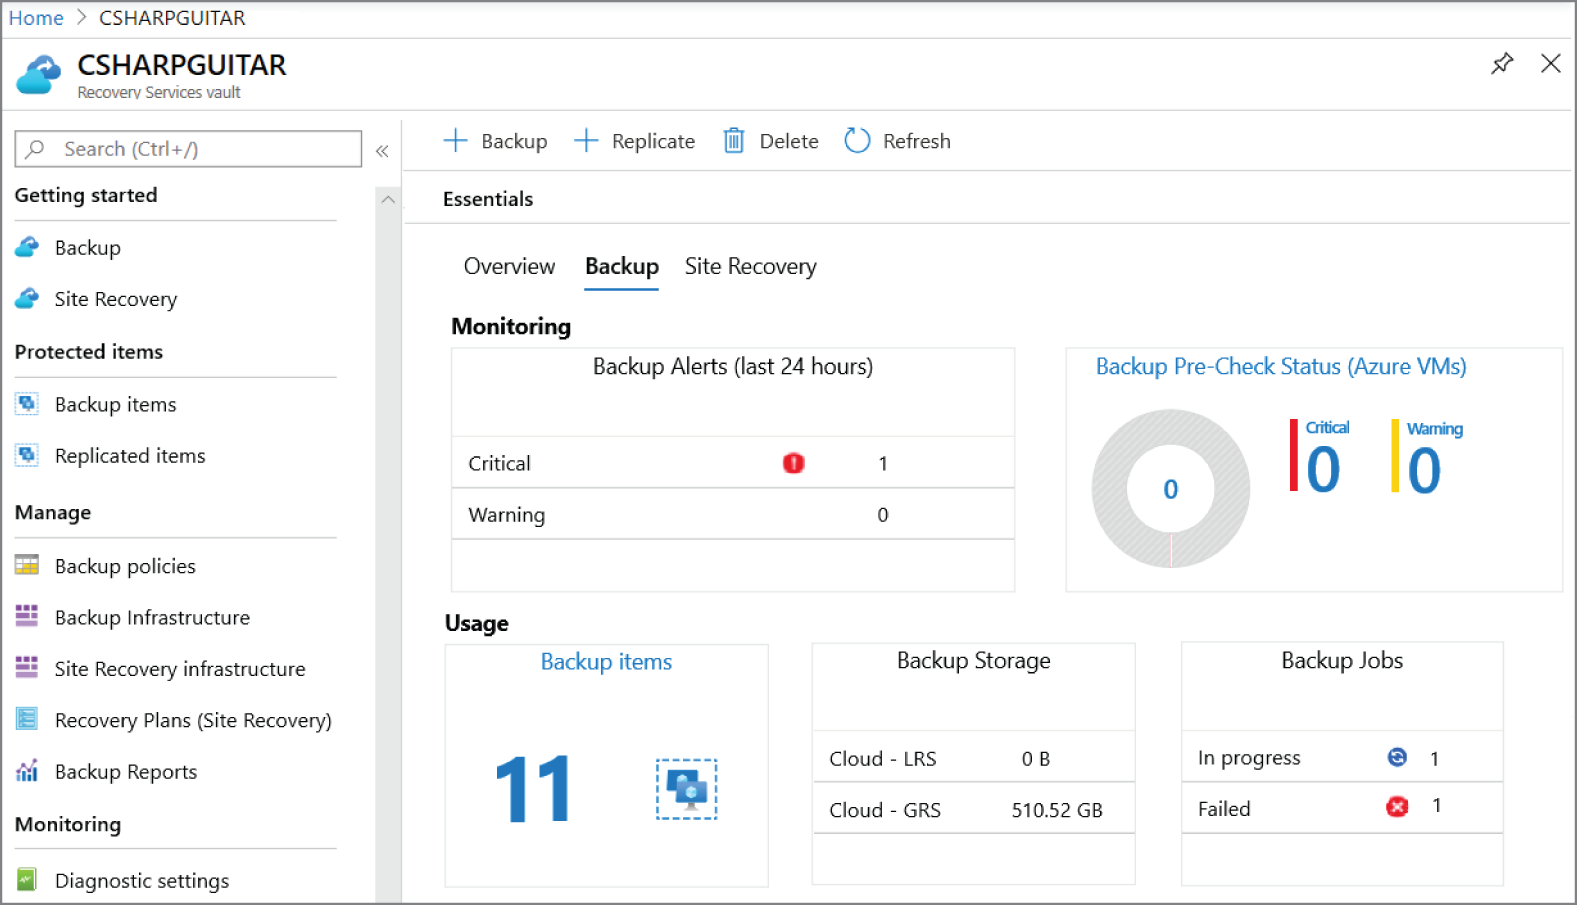
FIGURE 9.28 Azure Backup, Azure Recovery Services Vault
The Backup dashboard provides you with an overview of the current state of any Azure Backup that is in progress or in a failed state. It identifies how many backups have been performed and stored in the Recovery Services vault. If you were to click the Backup Items link in the Usage text block, near the number 11, you would be presented with a list of how many of each backup types have been performed. See Figure 9.29.
If you then click a specific backup management type, for example, Azure Virtual Machines, a detailed list of specific VMs that were backed up is provided. For example, you will see the VM name, the resource group in which is exists, and its status. One last detail from the Backup dashboard from Figure 9.28 is the Backup Storage text box. This shows how much storage your backups are consuming. Both LRS and GRS storage types should seem familiar. You learned in Chapter 5 about the different Azure Storage redundancy types. Based on that information shown on the Backup dashboard, you can conclude that your backups are stored as Azure Blobs in an Azure Blob Storage container and by default uses the GRS redundancy type. As a quick review, GRS means that your backup is backed up three times in your primary region and then again in a secondary region.
Now you know how Azure Backup works, it uses an agent running on the VM for VMs on Azure. You then configure a backup policy that defines the frequency and retention of the backup. Use MARS/DPM for backing up VMs to Azure that are running in an on‐premise data center. When you configure either of those agents for backing up VMs, the backups are stored into an Azure Blob storage account. The Recovery Services vault is the location from which you can then monitor and manage your backups. From a management perspective, there are two points that are important to cover: security and management of the backups. From a security perspective, all data is encrypted in transit and at rest, which means there is no way for anyone, if they happen to get a copy of your backup, to use it. Backup data is sent over an HTTPS link, and when the backup is stored using the Recovery Service vault, it is stored encrypted. From a management perspective, if you no longer want to perform a backup, you can disable the backup by clicking Stop Backup, which exists on the Azure VM Backup blade, as shown earlier in Figure 9.27. When you click the Stop Backup button, you are asked if you want to retain or delete the backup data. If you choose to retain the data for some time and then want to delete it later, you can return to the Backup blade for the Azure VM and click the Delete Backup Data menu option, also shown in Figure 9.27. It is grayed out there because the backup is still enabled; however, when the backup is stopped, it will be enabled. Remember that your old backups are deleted automatically based on the retention settings you provided when creating the backup policy.

FIGURE 9.29 Azure Backup Items in Azure Recovery Services Vault
Backing Up Other Products
In the previous sections, you learned about backing up Azure VMs and SQL Server virtual machines, but what about other Azure products and features? The approach toward answering this question is greatly linked to the kind of cloud hosting service that you work with. Azure VMs are IaaS, and because you have taken responsibility for the platform, you are responsible for managing it, which includes backing it up. The same is not true when you run on a PaaS cloud hosting service such as Azure App Services, Azure Functions, Azure SQL, or Azure Cosmos DB. Your only concerns when running in PaaS are your application and your data, and therefore you only need to back up that. When you deploy an Azure App Service or Azure Function, their configurations are stored as part of the product offering and are backed up automatically by the platform. For example, if your application requires .NET Core binaries, if it allows HTTP or the name and value in an application setting connection string, basically any configurations you see in Figure 9.30 under the Setting header are stored and protected by the platform. This must be the case; since that configuration information is what's used to scale out additional instances of your application, they all need the same source code and configurations. The point is, unlike IaaS, PaaS provides the backing up of your operating system and application configurations for you.
There exists both backup and snapshot capabilities for Azure App Services and Azure Functions, as shown in Figure 9.30. Those will help you improve the speed at which your application could be recovered if required. When you configure the backup, you can also configure it to include any database that the application is connected to.

FIGURE 9.30 Backing up Azure PaaS products
Like Azure Backup and the Recovery Services vault, an Azure App Service or Azure Functions backup is placed onto an Azure Blob Storage container. You select which one when you configure the backup by clicking the Configure menu link, also shown in Figure 9.30. Remember to be careful to store your content and code in a source code repository such as Azure DevOps or GitHub, for example. Because, as you know, there is a difference between the source code and the code that runs on a server. The difference is the one on the server is compiled and you cannot make bug fixes or code enhancements to it. I am just calling that out to make sure it is recognized; sometimes when people hear the word backup, they think it means everything is backed up, but there are many components that need to be backed up, as you have learned.
The way I see this PaaS backup process implemented is because it simplifies the backup of any associated database. This is good, but as you learned in Chapter 5, both Azure SQL and Azure Cosmos DB are backed up automatically for you. Therefore, the benefit of the backup feature for Azure App Services and Azure Functions comes mostly from the simplification of management by having a single point of entry into it. That means you can manage your PaaS and your backups (application and data) from the same set of Azure Portal blades. However, as your Azure consumption and footprint grow, so would the complexities of managing your backups. This would lead to a desire to have a greater overview of all your backups in a single location. That location is found within an Azure Recovery Services vault; this approach is for companies or individuals with smaller Azure footprints.
Linux vs. Windows Backup
When you are planning your backup strategy, you will need to know some details about what is supported and what is not. There are a number of differences between what is supported in regard to the operating system of the VM that you want to back up. Table 9.10 provides some details about what is and what is not supported when backing up Linux versus Windows operating systems. Performing Azure Backups on Linux requires that it is an endorsed or blessed version. This topic was discussed previously in Chapter 4, specifically on TABLE 4.5; also consider referring to docs.microsoft.com/en-us/azure/virtual-machines/linux/endorsed-distros, which lists the currently endorsed Linux distributions on Azure.
TABLE 9.10 Linux vs. Windows Azure Backups
| Feature | Linux | Windows |
|---|---|---|
| 32‐bit operating system | × | ✓ |
| 64‐bit operating system | ✓ | ✓ |
| On‐premise MARS | × | ✓ |
| On‐premise MABS | ✓ | ✓ |
| On‐premise DPM | ✓ | ✓ |
| Azure MARS | × | ✓ |
| Azure MABS | × | ✓ |
| Azure DPM | × | ✓ |
| File‐system consistent is default | ✓ | × |
| Application consistent is default | × | ✓ |
Microsoft Azure Recovery Services (MARS) is supported only on Windows machines, and therefore you can by default exclude that tool when you are discussing machines running Linux. If you need to back up one of the endorsed versions of Linux that is running in an on‐premise data center to Azure, then you would choose either Microsoft Azure Backup Server (MABS) or Data Protection Manager (DPM). However, neither MABS nor DPM can be used to back up an Azure VM running Linux, rather, only on‐premise. Using Azure Backup will work; take note that for Linux the default restore point status is File‐System Consistent. Microsoft does provide customers running Linux with an option to configure Azure Backup so that application‐consistent restore points are captured. For more information about that, read docs.microsoft.com/en-us/azure/backup/backup-azure-linux-app-consistent.
The ability to capture application‐consistent restore points boils down to the Microsoft feature used to take such a backup. That feature is a Windows Server service named Volume Shadow Copy Service (VSS), which is supported only on Windows. From a Linux perspective, you will need to have Python installed and utilize a feature named
fsFreeze
. You can find more information about those two services provided here:
- VSS:
docs.microsoft.com/en-us/windows-server/storage/file-server/volume-shadow-copy-service - fsFreeze:
github.com/Azure/azure-linux-extensions/tree/master/VMBackup
In addition to different backup support between Linux and Windows operating systems, like other Azure products, there are limitations that exist for Azure Backups in general. Table 9.11 provides some details about them pertaining to both Linux and Windows. Remember that in most cases, default limits are in place to protect you from unknowingly triggering a task that attempts to consume infinite resources that result in astronomical charge. If you need more, open a support case with Microsoft, and they will surely increase the limit for you.
TABLE 9.11 Azure Backup Limits
| Product/Feature | Limit per Subscription |
|---|---|
| Recovery Services vault | 500 |
| Machines per vault | 1000 |
| Azure Backup of Azure VM | Once per day |
| Backup using DPM/MABS to Azure | Twice per day |
| Backup using MARS | Three times per day |
| Azure App Service (premium tier) | 50 per day, once per hour |
The default limitations are generous with supporting the backup of 500,000 machines per subscription. That would be a lot of machines and a rare scenario for any company to run up against that, but never say never. If you quickly did the math for the Azure App Service entry and calculated that if backups are limited to once per hour, then the maximum could only be 24, so why is 50 supported? First, the ability to do backups on an Azure App Service depends on the pricing tier. Only Azure App Services running in Standard or greater can perform backups, and in Standard, 12 backups per day is the maximum and one backup every two hours. The math there works; the difference is that you are also allowed to take manual backups. Therefore, if you take scheduled backups every hour and then 26 manual backups in 24 hours, you would still be OK.
Azure Site Recovery
Let's assume now that you have all the Azure products identified that make up your production environment, and you have them backed up just in case you ever have to restore them. Let's hope you never need to do this. ASR is a tool that can help you move the resources from one region or one location to another region or location. The location is specifically called out here because ASR not only supports moving VMs hosted in Azure; it also supports customers who are running their workload on‐premise, i.e., in private data centers. In the scenario where customers are running on‐premise, when an outage happens, they could use ASR to move their workloads to Azure until the on‐premise incident is resolved.
Take a look in Chapter 1 where ASR was first introduced. FIGURE 1.8 illustrates how ASR can be used to back up and restore VMs already within Azure or from on‐premise to Azure. In Chapter 4, you learned about the differences between Azure Backup and ASR. Additionally, you learned that ASR is a helpful tool when it comes to migrating an on‐premise VM to the Azure platform. And again, ASR was discussed in Chapter 8 where you learned it can be used not only for migrating Windows and Linux VM running on either Hyper‐V or VMware, but also stand‐alone, nonvirtualized servers. The final piece of ASR that remains is the actual execution of a failover. In EXERCISE 8.3 you used the Backup and Restore capabilities provided to you within the Recovery Services vault. Then in EXERCISE 8.4 you used the replication feature, which is ASR, to move an Azure VM from one region to another. EXERCISE 8.4 was straightforward and required only four steps; it was not a complicated activity. In Exercise 9.4, you will use the Site Recovery feature within the Recovery Services vault to recover an Azure VM running in West Europe (AM2) to North Europe (DB3). You will see the navigation menu item named Site Recovery in both Figure 9.28 and Figure 9.29 provided earlier.
There are a few things to call out from that exercise starting with the fact that you can only failover to regions in the same geography. This was mentioned once before but is worthy of stating again. It would not be possible to use ASR to failover from a VM in North Europe (DB3) to South Central US (SN1), for example. The locations used in the exercise are for example only, and you would want to choose the ones required in your scenario. Also, if you were setting up Site Recovery so you can use Azure VMs as DR for your on‐premise workloads, you would choose the Azure region closest to your private data center. This will speed up the failover and also avoid any compliance and governance data issues if they are relevant in your scenario. The next point is the description and purpose of the recovery plan you created in EXERCISE 9.4.
The recovery plan is a template that is used to define the source, target, and items that need to be failed over when the failover process is executed. EXERCISE 9.4 was a simple example that contained only a single Azure VM. In real‐world scenarios the number of Azure VMs and the relationships between them are much more complicated. This is why there is a Customize pop‐up menu item that lets you tailor the recovery plan to your specific needs. One reason for this customization being important is if there are any requirements on the order in which you failover, shut down, or start up your workloads in a BCDR scenario. For example, if you have a batch job that will start feeding a database with data as soon as you start it up, you need to make sure the database is ready to receive the data; otherwise, you may create another mess that requires cleanup. Perhaps the batch job itself has a dependency on a system for attributes required for correctly processing the data. If those data parameters are not available, you may get corrupted data on your database, which is another problem you'd need to resolve. This customization capability is present for just these kinds of reasons. The reason is that defining in which order VMs need to be shut down, moved, and then restarted has great impact on the successful execution of a BCDR plan.
In practice, it wouldn't be a good idea to actually perform the failover until it is actually required; if you do, the VMs identified in the recovery plan would be moved into that other region. You should consider only performing the test that would confirm that if the time ever comes where you need to really failover to another region, that it will work. If you do need to perform an actual failover, then as you learned in EXERCISE 9.4 you select Failover from the pop‐up menu. You are not completely finished with the failover once the process triggered by selecting Failover from the pop‐up menu completes. Two additional pop‐up menu items you may have noticed are Commit and Re‐protect. If you recall, if you selected Failover, part of the information required was the selection of the recovery point for the given VM. The contents of the Recovery Point drop‐down list are the following:
- Latest (Lowest RPO)
- Latest Processed (Low RTO)
- Latest App‐Consistent
What app‐consistent means should be clear because it was already discussed. An app‐consistent status means all aspects of the backup were successful. This is the status you want to have because it has the greatest probability of being successful when deployed. The recovery point objective (RPO) and recovery time object (RTO) are measurements that identify the amount of data you are willing to lose based on the backup schedule and how much time is required to get your backup running again. An RPO consideration is one that can be linked to the decision between daily or weekly backups. If you were to choose a weekly backup schedule and your VM crashes six days from the last backup, you lose six days' worth of data. An RTO consideration has to do with available network bandwidth, the size of your backup that would require transfer, and the speed of the disks bound to the VM. RTO is focused on getting your VMs and other services up and running as fast as possible. Latest Processed (Low RTO) is the default. Therefore, you should conclude the most common objective from those executing a BCDR plan is to get the DR environment deployed, set up, and running as fast as possible. Make the selection wisely; you can use the test failover capability to see which works out best for your given scenario. Be conscious of the fact that after a real failover, once you commit, you cannot change this recovery point. But until the commitment is enacted, by selecting the Commit menu option, you will have these other recovery points, which you can use in case there are problems with any of the other recovery points.
If you are using Azure as the platform for your DR compute requirements from an on‐premise data center, then re‐protect is relevant to you. In many scenarios, a DR failover is only a temporary solution until the actual production environment is back up and running again. When you are ready to fail back from your DR on Azure into your on‐premise data center, you must first select Re‐protect. Once the Re‐protect process is completed, you would see a pop‐up menu item called Unplanned Failover, and clicking that would initiate the process for moving the workloads from Azure back into your on‐premise data center. To perform a fail back, all the VMs in your recovery plan must have at least one recovery point on Azure. Therefore, you need to make sure you run at least one backup while you are running the DR machines on Azure. This is likely a good step to add to your overall BCDR plan, specifically, to create a backup before triggering a failback.
Two final points before moving onto the next section have to do with Azure Automation and the monitoring of your site recovery activities. You created a simple Azure Automation script in the previous chapter, and as shown in Figure 9.19, you can write scripts to automate many activities you perform on Azure. The scripts can perform monitoring activities, and what is relevant here is that the failover process can be scripted too. Although EXERCISE 9.4 was not a complicated one, it would be simplified by scripting it. Imagine instead of the numerous steps to perform a real‐world, complicated failover, you could instead execute a single PowerShell cmdlet. In scenarios where you have a large number of resources, dependencies, and complexities, you should consider scripting the failover process. From a monitoring perspective, take a look back at FIGURE 8.4. That figure illustrates the Site Recovery dashboard within the Recovery Services vault. That dashboard provides an overview of how many failovers you have performed and their status. This overview can be helpful, especially if you are using Azure Automation to perform the failovers automatically when specific events occur that warrant such an action.
Site Recovery Deployment Planner
As introduced in Chapter 1, Site Recovery Deployment Planner (SRDP) is a command‐line tool useful for analyzing on‐premise virtual machines you want to potentially failover to Azure. This tool works with both Hyper‐V and VMware virtualization scenarios. The output of the analysis will identify any compatibility issues, such as number of disks, IOPS, disk sizes, boot type (EFI/BIOS), and OS version. If there are any issues, you will be notified and would be able to take an action to make the on‐premise VMs compatible. The amount of bandwidth required to perform the operation is also provided as output from the tool. This information will help you decide if you need to create an ExpressRoute connection or VPN or if you can simply replicate over the internet. Information about your storage requirements and the number of VMs required to execute the recovery plan will be a helpful tool in the calculation of the cost if you are ever required to trigger the failover.
Azure Recovery by Product Type
Most of the information required to back up, recover, or build in redundancies for our Azure products and features have already been covered. The contents in this section are provided for an additional review and may contain some supplementary tips, procedures, or diagrams that are helpful for building a reliant IT solution on Azure.
Recovering Azure Networking
The networking backbone on which Azure Functions is fully supported by Microsoft for all cloud hosting models. You wouldn't need to take any proactive activities from a networking infrastructure perspective. Because of that, from a BCDR perspective, you should focus on two other aspects. The first one has to do with your IaaS‐based Azure products that are supported specifically by ASR. From a networking perspective, notice in Figure 9.34 that when you test a failover, you select the Azure virtual network into which you want to place the recovered items. If one doesn't exist in the target region, you are prompted to create one.

FIGURE 9.34 Azure Site Recovery Test failover VNET creation
Once the test is successful and you need to actually trigger a failover, the virtual network in the target region is the place where your VMs will be placed into. That virtual network is ready to support the compute resources running within it. The other aspect concerns the utilization of the plethora of network virtual appliances (NVAs) available to you from Azure. Mostly in Chapter 3 where networking was covered, you learned about the API Management, Azure Front Door, Azure Traffic Manager (ATM), and Web Application Firewall (WAF) capabilities running in collaboration with Azure Application Gateway. All of those Azure networking products are mostly in place to help failover scenarios instead of requiring a failover scenario themselves. A WAF would need to be manually configured to reroute traffic from one endpoint to another; this isn't the case for ATM. An ATM can be configured to monitor the health of an endpoint, and when the configured threshold is breached, perhaps based on response time, an ATM can redirect all traffic to another endpoint running the same application, as illustrated in Figure 9.35.

FIGURE 9.35 How Azure Traffic Manager works
Notice that when a request comes from a client, the request is routed to the Azure Traffic Manager instead of an actual web endpoint running an application. The DNS has a CNAME, which would route a custom domain to the ATM endpoint, which is configured, as per Figure 9.35 to route requests to an Azure App Service and/or an Azure VM running in the North Europe (DB3) region. ATM can also be configured to route traffic to an endpoint not hosted in Azure. If the health monitor finds that the endpoints in DB3 are not responding as expected, West Europe (AM2) automatically begins accepting traffic from clients.
Recovering Azure VMs
The approach for recovering an Azure virtual machine is dependent on whether you are using Azure as a DR environment for your on‐premise workloads or if the VMs are already hosted on Azure. If you are using Azure as your DR environment, then it should already be clear which tools you use for setting up and executing any failover. The tools are provided here for clarity.
- Azure Backup
- Site Recovery Deployment Planner (SRDP)
- Azure Site Recovery (ASR)
- Recovery Services Vault
When your workloads are already running on Azure, you have an additional option for setting up and maintaining a resilient application. Snapshots are a useful concept, discussed in Chapter 4, that let you not only backup the disks bound to the VM but also use them to build identical replicas. Those additional replicas are helpful for adding redundancies to your Azure workload. A snapshot is, in a majority of scenarios, a copy of the drive which bound to your VM that is running the operating system. That means the snapshot, once bound to a VM, is bootable, which is a similar attribute as an image. You would find the concept of an image with Azure Container Instances (ACI), Azure Kubernetes Services (AKS), and Virtual Machine Scale Sets (VMSS). This is called out specifically because if you navigate to any of those Azure products, i.e., ACI, AKS, or VMSS, in the Azure Portal, you will not find any navigation menu items focused on backup and recovery. The reason for that is that the disk image is what should be protected and stored versus an actual backup of one or more of the machines. Remember in Chapter 4's EXERCISE 4.1 that you created a Docker image. Like the source code, you would want to safely store the scripts and dependent components for that image. If you ever needed to redeploy the image, it could be done by following the instructions provided in EXERCISE 4.4.
Two more items to call out in this section, the Disaster Recovery navigation menu item on the Azure VM blade and partially restoring files from a backup. The Disaster Recovery navigation menu item is visible in a previous image, Figure 9.27. Clicking that navigation menu item opens the Replicated Items blade, which is identical to the one you would see if you navigated to it from the Recovery Services Vault blade, as shown in Figure 9.36.
You would notice that you also have the capability from that blade to execute a test failover or perform an actual BCDR failover plan if required. On a side note, if you find features duplicated in multiple locations, you can be certain they all call the same Resource Manager REST API on the backend. Therefore, use the approach and procedures for their use that are easiest and most logical for your specific scenario. Let's move on to the next topic of restoring only a portion of a VM. There may be a scenario where you only need a file or folder from a backup and not the entire thing. In that case, by using the blade shown in Figure 9.27, click the ellipsis dots, and you will see Restore VM and File Recovery contained within the pop‐up menu. Click File Recovery, and you are prompted to download and run an executable named
IaaSVMILRExeForWindows.exe
, which will connect to a snapshot of the disk. Figure 9.37 shows the output of the executable.

FIGURE 9.36 Azure virtual machine disaster recovery

FIGURE 9.37 Azure virtual machine file recovery
The executable mounts the disks from the recovery point as local drives. Notice in Figure 9.37 that there is a
D:
drive and an
E:
drive, which allows you to navigate through the content and copy the files or directories that you want to retrieve. On the same blade that provided you with the ability to mount the drive, there also exists an Unmount Disks button. Click that button when you have completed your recovery, and the drive will remain mounted for 12 hours and unmount automatically, in case you forget.
Recovering Azure App Services
This one is pretty well covered; you need to remember that when running on a PaaS cloud hosting model, the provider owns the operating system. The primary focus for you is to make sure your application code is secure and that you have a document that contains the configurations you made to the application after deploying it to PaaS, i.e., an Azure App Service. Although the configuration is stored safely and securely, it makes sense to have a document that describes any custom configuration in your possession. Azure App Services do provide the feature to perform and recover from backups; see Figure 9.30 as a reminder about what that looks like. Also, take a look back over Figure 9.35, which discusses ATM as a recovery option for responding to incidents that may require the execution of a BCDR plan.
Recovering Azure Data Services
Azure data services consist within two primary groups, data stores that are databases and data storage that concern files or documents. The data stores that have been focused on in this book and likely on the exam are Azure SQL and Azure Cosmos DB. The data storage products are those that exist within an Azure Storage account, specifically, Azure Blobs, Azure Tables, and Azure Files. Azure queues also reside within an Azure Storage account; however, Azure Queues are there for legacy reasons more than anything else. Let's make sure you know as much as possible about the backup, recovery, and redundancy capabilities available for each of these Azure products. Note that much of this content has already been covered in Chapter 5; the content here is just to close out any possible loose ends.
- Azure SQL, SQL managed instances, and SQL virtual machines
- Azure Cosmos DB
- Azure Storage
From a data recovery perspective, an important concept is data retention. This is the amount of time that you plan on keeping the copy of the backup. You have learned concepts such as LTR and PITR that dictate the frequency of a backup and for how long the backup will be stored; the maximum is 10 years. By default, Azure SQL databases are backed up every 12 hours, and transaction logs are taken every 5 to 10 minutes. Recall from FIGURE 5.48 where you will see a custom configuration of the database backup schedule. If you ever want to restore one of those backups, you would find a Restore menu item on the Azure SQL or SQL managed instance's Overview blade in the Azure Portal, as illustrated with Figure 9.38. After clicking Restore, you are provided the options to select the most recent PITR backup or LTR backup.

FIGURE 9.38 Azure SQL or Azure managed instance restore
When you select LTR, you are provided with a drop‐down list that allows you to select the specific backup you would like, based on date. From a SQL virtual machine perspective, you know this already, but a backup of the database is performed along with the backup of the Azure VM on which it runs. Azure Backup and Azure Site Recovery Services (ASR) are the tools that do this on VMs and have just recently been covered. From an Azure Cosmos DB perspective, take a look at FIGURE 5.41, which shows the Replicate Data Globally blade for an Azure Cosmos DB. Once you enable replication, the Manual Failover menu item would become enabled. If you were to identify any issue on your primary Azure Cosmos DB instance, you can use the Manual Failover menu to make another instance the primary one. Or, consider enabling Automatic Failover, which will monitor the DB in that region, and, if it is determined to be unhealthy, the platform will perform the failover to another region for you. When configuring Automatic Failover, you will identify which region is preferred as the failover instance. Azure Cosmos DB databases are backed up automatically by the platform every four hours. If you ever get into a situation where you must restore your database from a backup, you will need to contact Microsoft Support. There is currently no online functionality to support this scenario.
When your Azure Storage account is running in the GRS or RA‐GRS service tier, you can configure georeplication, as shown in Figure 9.39. As you can see, the primary Azure Storage account is in West Europe (AM2) with the secondary in North Europe (DB3).
If your primary Azure Storage account, which includes blobs, tables, and files, begins to experience problems or there is an outage, click the Prepare For Failover button to begin the failover procedure. The procedure would simply make the storage in North Europe the primary and redirect all the storage endpoints to the instance in that new region. Remember that your Azure Storage endpoints resemble the following:
- Blob:
https://*.blob.core.windows.net - Files:
https://*.file.core.windows.net - Queue:
https://*.queue.core.windows.net - Tables:
https://*.table.core.windows.net - Static Website:
https://*.z6.web.core.windows.net

FIGURE 9.39 Azure Storage account georeplication
You can also perform the failover of a storage account using the following Azure CLI command:
az storage account show --name <accountName> --expand geoReplicationStatsaz storage account failover --name <accountName>
Replace
<accountName>
with your Azure Storage account name. The first command will display the primary and secondary information as you saw previously in Figure 9.39. The second command will perform the actual failover process.
Recovering Azure Messaging Services
There was not a lot about backup and recovery in Chapter 6 where the Azure Messaging services were covered in detail. From a conceptual perspective, in many ways the need for taking a backup doesn't make a lot of sense. It doesn't make a lot of sense because the data that is present in the queues wouldn't remain there for long. The purpose of messaging services is to store a piece of information and to notify a consumer that information is present for processing. Once the message is processed, it is removed from the messaging service queue. Therefore, your primary consideration from a recovery perspective in the context of messaging should focus on redundancies. Meaning, if you have an outage in a region, make sure you can quickly divert producers and consumers to an available endpoint in a different region.
From an Azure Storage Queue perspective, the redundancy approach was just provided in the previous section. Azure Queue Storage is contained within an Azure Storage account, so if you need to perform a failover, you have that feature after enabling georeplication, which requires GRS or RA‐GRS. With regard to both an Azure Service Bus and an Event Hub, you can choose to make them zone redundant during their initial provisioning only. Zone redundancy, as you recall, means that the product is deployed into all data centers within a region; the typical number of data centers per region is three. All regions do not support availability zones; you can find an up‐to‐date list of which Azure regions support Availability Zones here:
docs.microsoft.com/en-us/azure/availability-zones/az-overview
Georeplication for an Azure Service Bus is available only when using the premium pricing tier. For an Event Hub, the pricing tier required for georeplication is standard. The reason these two messaging services are lumped together is because the process and georeplication Azure Portal blade are extremely similar to each other. Both Azure Service Bus and Event Hub have a georeplication blade similar to that shown in Figure 9.40. You will certainly see the resemblance between Figure 9.39 and Figure 9.40 as well, which makes sense, as the goal for this feature is the same, i.e., redundancy.
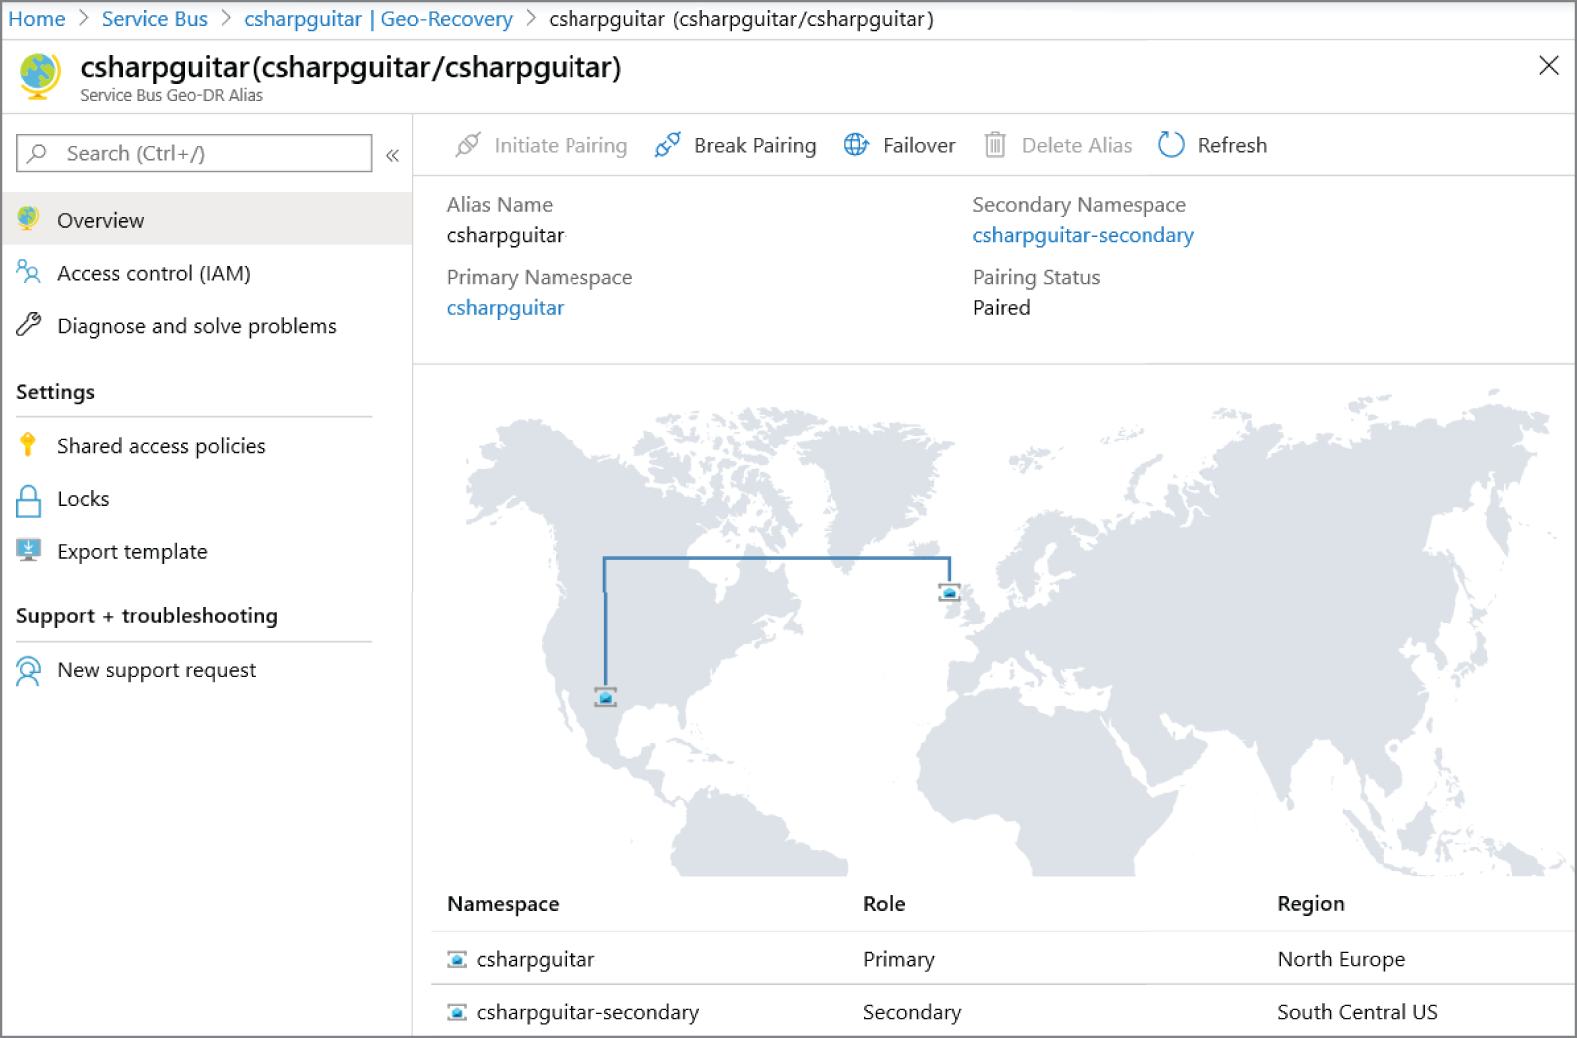
FIGURE 9.40 Azure Service Bus georeplication
The last messaging service is Event Grid, which has built‐in redundancy. A failover happens automatically when the Event Grid endpoint becomes unavailable in a region. For an Event Grid, remember that it doesn't actually store any messages; instead, it sends an event notification to its subscribers. That notification can inform a consumer that there is a message in an Event Hub ready for processing, for example. In the Event Grid scenario, you can therefore build redundancies into the producers that are monitored by Event Grid by provisioning an identical endpoint in two or more different regions. The producers can then attempt to notify the Event Grid endpoint in the primary region. If that fails, the code would attempt to use the secondary region. Ensuring both endpoints are configured the same, no notifications would be lost.
Summary
In this chapter, you learned about Azure Monitor, which consists of two Azure tools, Application Insights and Log Analytics. Application Insights is targeted toward the application and can be embedded into the application code. Log Analytics is platform‐focused but is useful for monitoring the state of almost all Azure products and features. The monitor data can be visualized using the Azure Monitor blade in the Azure Portal, or you can use KUSTO queries (KQL) to query the data via Azure Data Explorer (ADX). The other portion of the chapter covered backup and recovery tools and concepts. Azure Backup is the tool used for backing up Azure virtual machines and SQL virtual machines. You also learned that Azure Backup is useful for on‐premise virtualized or physical servers running Linux or Windows on VMware or Hyper‐V. Lastly, you learned about Azure Site Recovery and how it can be used to take a backup and use it to recover the VM into another region as part of a BCDR plan.
Going forward, if you want to keep up with all the changes and plans for future Azure products and features, read the page azure.microsoft.com/en-us/updates regularly. I learned a lot while writing this book. I actually passed the AZ‐300 and AZ‐301 exams without any kind of preparation. This is a benefit I got by working with the technology every day for some years. I am confident that if you have read all the pages and worked all the exercises that you too will be able to clear this exam. If you made it all the way through this book, you deserve recognition and the Azure Solutions Architect Expert is exactly the recognition you deserve. I wish you success, and I am hopeful that this book will not only help you clear the exam, but also make you a great Azure Solutions Architect Expert.
In each chapter, I provided a quote from a famous person that I found somewhat relevant to the content of the chapter or section. I asked my son to provide the final quote for me. His quote was simple, clear, and direct: Noa Perkins said, “The End.”
Exam Essentials
- Understand Azure Monitor. This is a tool that collects, analyzes, and provides insights into the performance and availability aspect of your cloud and on‐premise workloads. Azure Monitor can proactively identify issues with your provisioned Azure products and resources, as well as those they depend on.
- Understand Log Analytics. This product is merged into Azure Monitor and is the location where your telemetric data is stored. Using KUSTO Queries (KQL) and Azure Data Explorer (ADX), you can extract data in the exact format you require. The data stored in this repository is focused on the platform and IaaS cloud offerings. Some key metrics are CPU utilization, memory, and IOPS.
- Understand Application Insights. This is another logging, analyzing, and reporting Azure product that is useful for capturing performance and availability metrics. This product, as its name implies, is focused a bit more on the application and PaaS cloud offerings. This feature also has an SDK so that you can embed it directly into your application code, which will provide greater insights into the behaviors of your solution.
- Understand business continuity and disaster recovery (BCDR). A BCDR plan is focused on what actions you will take if there is an outage that renders your workloads inaccessible. Business continuity is focused on keeping the business moving forward in scenarios when the computer systems are not available such as taking orders by phone and writing them down on paper until the systems come back online. The disaster recovery portion is focused on the computer systems running your database, compute, and/or messaging services. Having your backups taken and your recovery plan created in advance will help you perform failovers to other Azure regions or from on‐premise to Azure, when there is a requirement to do so.
- Understand Azure Backup. Like the name suggests, this feature is what performs the backup of your provisioned workloads. What the name does not imply is that it performs recoveries as well. This is the go‐to tool for scheduling, performing, and managing your backup and recovery needs in Azure and on‐premise.
- Understand Azure Site Recovery (ASR). This product is not only helpful in migration scenarios but is the backbone for the execution of the DR part of your BCDR plan. With the help of a Recovery Services vault, you can create and replicate backups of your Azure and on‐premise workloads. Additionally, you can use this product to test failover scenarios, execute a real failover, and, once the incident is resolved, use it to fail back to your actual production environment.
Review Questions
- Azure Service Health monitors all Azure products' performance and availability in all regions globally.
- True
- False
- Activity logs that are accessible via the portal or Azure PowerShell provide what kind of information? (Choose all that apply.)
- Deployment to an Azure App Service
- A login attempt on an Azure VM
- Removal of Azure resources via the portal
- An access to a Key Vault Key
- Which of the following is true about Log Analytics? (Choose all that apply.)
- Supports custom querying using KUSTO queries (KQL)
- Supports custom querying using GUSTO queries (GQL)
- Provides insights into application code exceptions and memory consumption
- Is queryable from Azure Data Explorer (ADX)
- Which metric would you not expect to see when analyzing Application Insights logs?
- Exceptions
- ETWEvent
- Requests
- Syslog
- To use Azure Automation runbooks in the context of monitoring, only PowerShell scripting can be used.
- True
- False
- Which of the following backup/restore scenarios are not supported by Azure Backup?
- Azure to Azure
- Azure to on‐premise
- On‐premise to Azure
- On‐premise to on‐premise
- Which of the following does Azure Backup support when backing up VMs or physical machines running Linux by default? (Choose all that apply.)
- 32‐bit operating system
- Application‐consistent backups
- 64‐bit operating system
- File‐system‐consistent backups
- Which of the following backup status is most desired?
- Application consistent
- Crash consistent
- File system consistent
- Azure Site Recovery (ASR) is useful in the following scenarios? (Choose all that apply.)
- Monitoring
- Migration from on‐premise to Azure
- Migration between Azure regions
- Testing and executing BCDR plans
- Which of the following products support georeplication? (Choose all that apply.)
- Azure Cosmos DB
- Azure Service Bus
- Azure Storage Account
- Event Hub