Chapter 4
Azure Monitor
Overview
Microsoft released Application Insights in public preview in April 2015 to provide clients deploying applications in Azure with deeper insights into each application’s performance. In September 2016, Microsoft released Azure Monitor in public preview. At the start, Azure Monitor included capabilities to gather, monitor (using shared dashboards), analyze, and alert on activity logs, resource metrics, and diagnostic logs.
Over time, Microsoft has consolidated Application Insights, Log Insights, and Azure resource monitoring into Azure Monitor. Microsoft has also extended Azure Monitor’s capabilities, third-party integrations, and available metrics and integrations across Azure resources.
Key benefits
Azure Monitor enables you to monitor all your Azure applications, virtual machines (VMs), and other deployed services. It offers a number of key benefits, as follows:
Automated log collection and monitoring of Azure resources
Deeper insights into application performance for optimization
Automated alerts sent to resource owners for action
DevOps integration for continuous monitoring
Automated action to address critical issues
Pay-as-you-go, requiring no upfront investment
Custom dashboards to meet every requirement
Integration with other Microsoft services, such as Power BI, for centralized dashboards across the organization
Considerable third-party integrations to extend capabilities
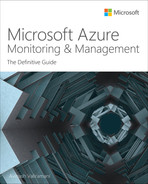
Figure 4-1 provides a high-level overview of the key capabilities of Azure Monitor. As you can see, Azure Monitor supports the integration of various data sources for log, event, and metrics collection. You can gain deeper insights into different Azure resources, create visualizations using various built-in tools and integrated services, analyze data to respond with alerts and automated actions, and export data into other third-party solutions you might have in your environment.
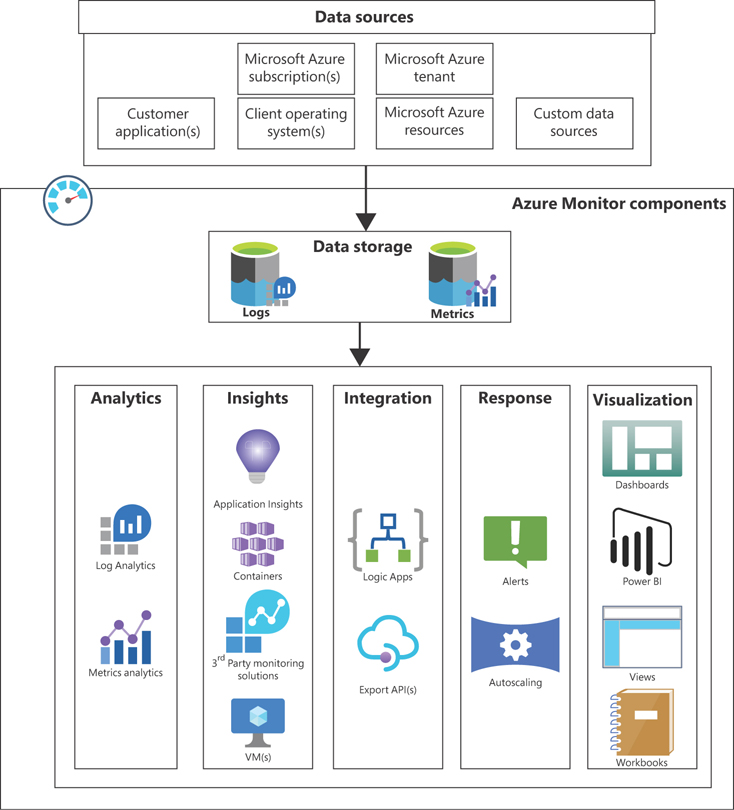
FIGURE 4-1Key capabilities of Azure Monitor.
Concepts and considerations
Now that you have a basic overview of the features and benefits of using Azure Monitor in your environment, let’s discuss the following:
The types of data you can collect using Azure Monitor
How to set up the data-collection process
Available data-visualization options
How alerts and automated actions work
Options to integrate this service to extend its functionality
Data types
Azure Monitor supports three data types, as follows:
Metrics
Log data
Distributed traces
Each data type helps Azure Monitor piece together a picture of the overall health of an Azure environment. Collecting and analyzing these data types is critical to gain deeper insights into the performance and availability of your Azure resources and to proactively take actions to avoid outages.
Metrics
Metrics are resource values collected at particular points in time, indicating system performance for monitored services or events. You define the interval at which these numerical values are captured, along with associated values that include the data and timestamp, the name of the metric, and labels that help define the metric. Metrics help reveal trends that you can analyze to identify performance bottlenecks or areas that require deeper analysis for a resource.
Azure uses a time-series database to store and optimize metrics, as this type of database is best suited to host this kind of data. Once combined with other data types, such as logs, you can better identify root causes of issues. Metrics are lightweight data points and therefore are ideal for use in Dashboards for real-time health monitoring of resources that are critical for your environment. (See Figure 4-2.)
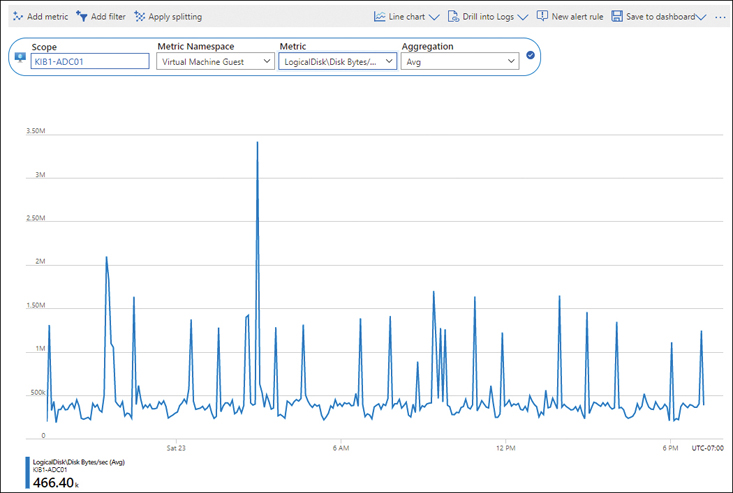
FIGURE 4-2Real-time health monitoring with dashboards using metrics.
Log data
Every system, including VMs, storage, network infrastructure, and other Azure services, generates logs that capture changes, issues, and errors. Logs can contain numerical or text data. In the context of Azure, you can store logs in a Log Analytics workspace (see Figure 4-3) and use Azure Monitor to analyze them for specific events or errors that are of interest. You can also perform queries against log data to identify the root cause of issues or to pre-empt issues for remedial action. Finally, you can set up alerts against logged data that help you proactively respond to issues before users are affected.
NoteLogs are ideal for root cause analysis and error monitoring.
FIGURE 4-3Log Analytics.
Distributed traces
A distributed trace is when a system traces a user request across a distributed environment and is used to identify and analyze any bottlenecks or other issues in your environment. Distributed systems contain a number of individual components; distributed traces help correlate logs generated by these individual components in the application stack. You use the Application Insights SDK to enable distributed tracing and define where to store trace data. You can then analyze trace data, along with other log data, and create dashboards, custom queries, and alerts for monitoring.
Data collection
Now that you have a better understanding of the different data types supported by Azure Monitor, let’s look at the different ways Azure Monitor can collect data. Azure Monitor supports a range of data sources, including the following:
Subscription-level activity and monitoring logsAzure collects subscription-level activity logs that track the creation, modification, and deletion of resources, along with other operational and management activities that you perform on all resources.
Azure service-level monitoring logsThese apply to services such as Azure Active Directory, which are built and managed by Microsoft when you create a new subscription and Azure tenant. These logs help you keep track of the health status of these services.
Resource-level metrics and logsAzure collects metrics and enables you to collect logs for all resources you create in your Azure subscription. These track the performance and health of individual resources created within your Azure subscription.
Azure guest VM OS performance and diagnostic logsYou can use Azure Monitor to collect basic performance logs after you create a VM in Azure. You can even install an Azure Monitor agent on the VM to capture detailed performance metrics, logs, and events to gain deeper insights into the VM.
On-premises VM/server or other cloud-hosted guest VM performance and diagnostic logsAs with Azure VMs, you can install the Azure Monitor agent on VMs or servers hosted on-premises or in other cloud environments to gather performance and diagnostic logs to monitor and manage those resources.
Application performance metrics and diagnostic logsApplication Insights allows you to send extensive performance and logging data to Azure Monitor for monitoring, analysis, and alerting. This includes granular information such as page views, application requests, and application exceptions encountered during runtime.
Custom sourcesAzure Monitor supports data collection from any REST client using the Data Collector API. This allows you to monitor resources that do not support the use of Azure Monitor agents or integration with Application Insights.
Once collected, data from all these sources can be directly written to the Azure Monitor metrics database and/or the Log Analytics workspace database. Alternatively, you can store this data in Azure Storage accounts; Azure Monitor can then ingest it from there.
Azure Monitor supports various methods for data ingestion:
Application InsightsApplication Insights requires you to integrate your application with the service using the Application Insights SDK to gather rich user and application data, logs, and metrics.
Agents on VMs and physical serversYou can deploy the Log Analytics or Azure Monitor agent on VMs or physical servers to gather deeper insights into performance, logs, and events.
Diagnostic settings on Azure ResourcesYou can define diagnostic settings on Azure resources that send logs and metrics to various destinations, such as Azure Storage, a Log Analytics workspace, Azure Event Hubs, or an integrated partner solution.
Data segregation
Azure Monitor can collect many different types of data. But it has to organize all these different types of data into logical structures—not only for easy retrieval but also to maintain data separation between clients, resources, and environments.
The data segregation logic built into the Azure Monitor service ensures that all data is tagged with the associated workspace, and that all tagging is preserved for the entire data lifecycle. Every client tenant has a dedicated database instance in a storage cluster in the Azure region used by the service.
ImportantAzure Monitor complies with international standards such as ISO/IEC 27001, PCI DSS, HIPAA, HITECH, and many others. For an up-to-date list of certifications, see the Microsoft Trust Center. Here, you can determine whether the service adheres to any other specific compliance measures required by your organizations.
Data retention
The Azure Monitor service retains all indexed log data and collected metrics based on the selected pricing tier:
Free tierIn this tier, all collected and indexed data is retained for seven days.
Paid tierIn this tier, all collected and indexed data is retained by default for 31 days. You can extend this to 730 days.
In addition, all data from the previous two weeks is stored in SSD-cache for fast retrieval.
Data redundancy
All data is replicated within the local Azure region using locally redundant storage (LRS), thereby providing some level of redundancy for your environment.
Data security
By default, Azure Monitor collects data from Azure services and resources over TLS 1.2-encrypted connections. Moreover, all data is encrypted at rest, as is all data held in SSD cache. This ensures that data is protected at every stage; there are no vulnerable areas for attack in throughout the entire data lifecycle.
NoteData encrypted at rest uses Microsoft-managed keys, although customers have the ability to use their own keys.
In addition, once data is ingested by the service, it is stored as read-only in the database. Although you can delete data using the Azure Monitor APIs, you cannot alter it. If you don’t want any data to be deleted, you can export it to an Azure Storage account that is set to prevent data deletions.
Data visualization
Azure Monitor provides two types of built-in visualizations, which allow you to monitor various Azure resources at a glance: curated visualizations and insights.
Curated visualization
Curated visualizations are limited in scope to a particular service or set of services. You can use them without having to configure them first. Examples of curated visualizations include the metrics that become visible when you click a specific Azure resource such as a VM (see Figure 4-4) or Azure Storage account (see Figure 4-5).
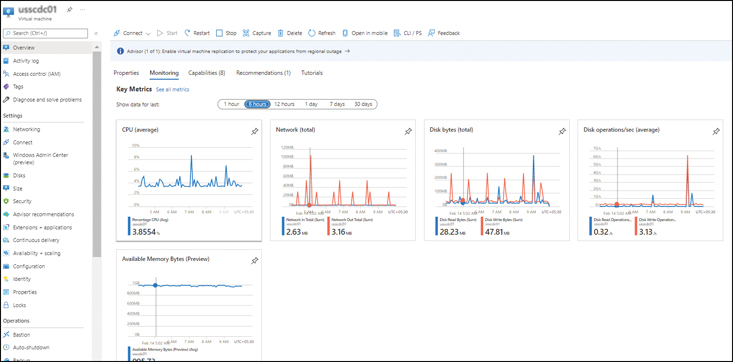
FIGURE 4-4Azure VM metrics.
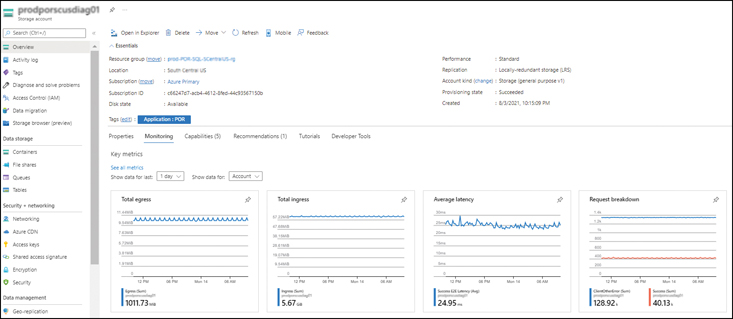
FIGURE 4-5Azure Storage metrics.
Insights
Insights are larger scalable visualizations that focus on specific resources, such as web apps, VMs, and container services. These require integration and customization but provide deeper and richer insights. Microsoft provides several Insights tools, including Application Insights, Container Insights, VM Insights, Network Insights, Storage Insights, and many others. Four Insights that can help you monitor your environment include the following:
Application InsightsApplication Insights provides a deep understanding of an integrated web application’s performance, availability, usage, bottlenecks, and exceptions. The web application can be hosted anywhere, including on-premises and other cloud environments. You use the Application Insights SDK to enable Application Insights configuration for your web applications and configure it to monitor and stream the required parameters to Azure Monitor for analysis. Application Insights integrates with Visual Studio to support DevOps scenarios.
VM InsightsVM Insights enables you to monitor the performance and health of numerous VMs at once and to identify dependencies on external endpoints that impact the performance of a particular VM. You can use VM Insights for VMs hosted in Azure, on-premises, or in other cloud environments.
Network InsightsNetwork Insights (see Figure 4-6) monitors the health of the various network endpoints running in your environment, including VPN gateways, VPN connections, private endpoints, virtual networks, and so on. You can also use Network Insights to monitor connection health and traffic flow logs for the different network security groups (NSGs).
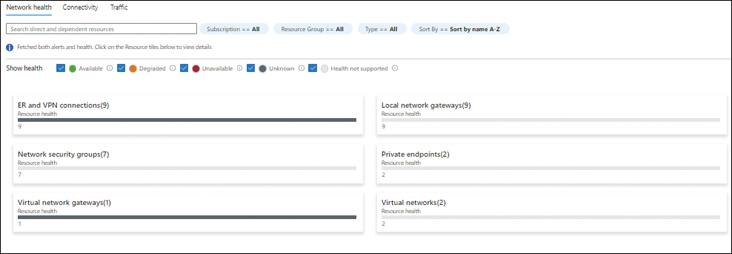
FIGURE 4-6Network Insights.
Storage InsightsStorage Insights monitors the health of the various storage accounts running in your Azure subscriptions. With Storage Insights, you can easily monitor key metrics, such as the following:
Transactions
Transactions Timeline
E2E Latency
Server Latency
Client Errors
You can also monitor the capacity of various storage accounts to proactively identify any that are reaching their maximum thresholds. Figure 4-7 shows a Storage Accounts Insights dashboard.
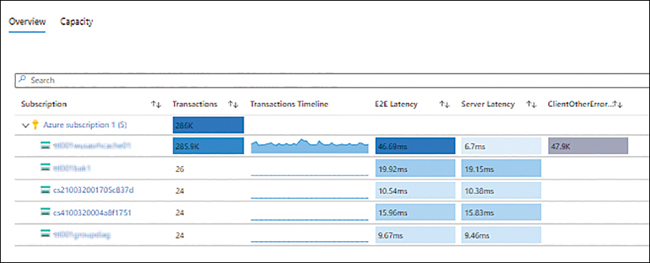
FIGURE 4-7Storage Insights.
Dashboards
Azure enables you to build customized dashboards using different data sources and data types and display them in the Azure Portal for easy viewing. You can also share your custom dashboards with other Azure users, providing a consistent view of critical resources across your IT team. Essentially, when creating a dashboard, you select tiles that contain the different data types from the different data sources for display. You can then size them and align them based on your requirements.
Figure 4-8 shows a sample dashboard that contains the following information:
All the resources present in the tenant
Average CPU credits consumed by some VMs
Average memory available in bytes for those VMs
Average CPU percentage usage for those VMs
User sign-in graph for the past few days
Secure Score metric
Service Health and Marketplace shortcut tiles
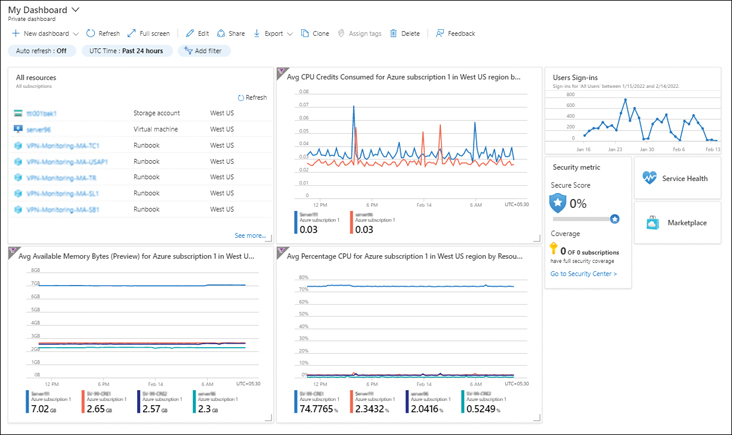
FIGURE 4-8Azure Monitor dashboards.
Workbooks
You can use Azure Workbooks to generate rich and interactive visual reports from multiple data sources. You can base these reports on publicly available templates that have been pre-configured to contain key metrics or start with a blank canvas and create your own. You can customize, save, and reuse templates as necessary. Figure 4-9 shows a list of the templates that are publicly available at the time of this writing, while Figure 4-10 shows the output of the Performance Analysis template.
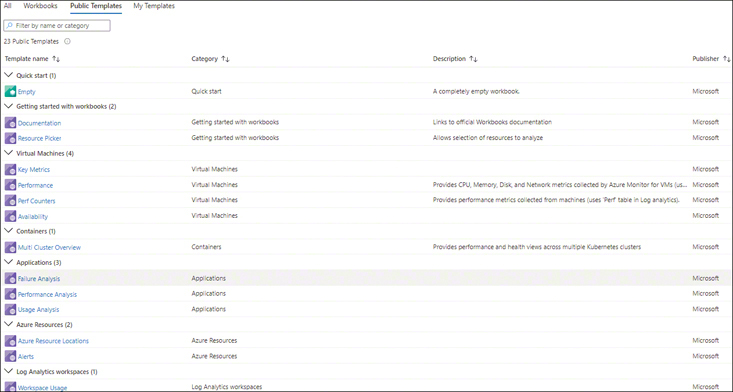
FIGURE 4-9Azure Workbooks templates.
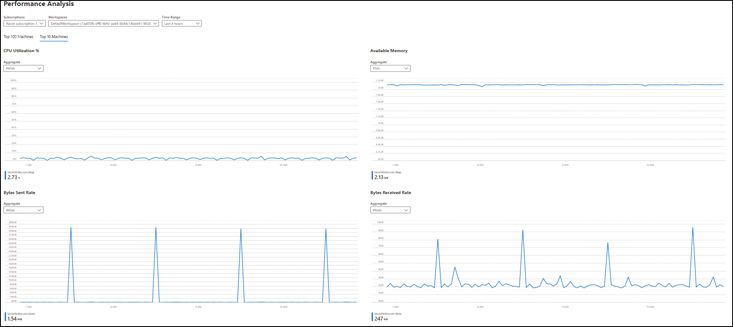
FIGURE 4-10The Azure Workbooks Performance Analysis template.
Power BI
Microsoft has integrated Power BI with Azure Monitor. So, you can easily import logs from Azure Monitor into Power BI to create rich, interactive visualizations. A full-fledged business analytics service, Power BI offers extensive capabilities to create queries, custom dashboards, and reports based on your organizational needs.
Third-party integrations
Azure Monitor integrates with several types of third-party solutions. For example:
IT service-management (ITSM) solutionsYou can connect Azure to your ITSM tool to automatically create tickets and to manage the lifecycle of the ticket. The Microsoft site contains an extensive list of supported ITSM products, which continues to grow as more integrations come online.
Azure Monitor partner integrationsAzure Monitor supports integration with partner solutions to either extend capabilities provided by Azure Monitor or export logs stored in Azure Monitor to their systems.
Data export
Azure Monitor integrates with other Azure services, such as Event Hubs and Logic Apps, to export data to other Azure services or to third-party solutions such as SIEM or monitoring tools. You can also integrate with APIs exposed by the service for direct integration and data export. Here are a few points to keep in mind:
When using Logic Apps with Azure Monitor, you can set up automated tasks and workflows that export data from Azure Monitor and import it into other services or solutions.
When using Azure Event Hubs, you can transform, store, and stream Azure Monitor data to third-party SIEM and monitoring tools.
When leveraging the APIs provided by Azure Monitor, you can read all the captured logs and metrics and alerts generated in Azure Monitor and import them into your existing monitoring solution or SIEM tool for analysis.
Alerts
Alerts are a key feature in any monitoring solution. After you have collected all the required data, identified all the events and metrics you want to monitor, and selected appropriate thresholds to accurately identify issues in your environment, you need some mechanism to inform you when events are triggered and metric thresholds are met. In Azure Monitor, this mechanism is the alert.
With Azure Monitor, you can define alert rules that identify the targeted resources, targeted metrics or events, thresholds, and frequency to determine whether to initiate some action you specify. An action is defined as part of an action group. This can include automated actions to remediate the alert, such as stopping, starting, or restarting the resource; scaling the resource in or out; triggering an automation runbook; or logging tickets in an integrated ITSM tool. Along with these automated actions, you can also define other action groups, such as one to alert responsible administrators, via email, SMS, or voice calls, of the need for manual intervention or monitoring to ensure automated actions have been correctly performed.
Azure Monitor walkthrough
The following sections walk you through the process of using Azure Monitor to create an alert rule to monitor the CPU usage of a VM, create a Log Analytics workspace, configure Azure VM monitoring, set up Azure VM Insights alerts, configure Azure Storage monitoring, and running queries on Azure Storage.
ImportantIf you are following along, you’ll want to select resources and unique resource names based on your environment for each of your deployments.
ImportantIf you are following along, delete any unwanted resources after you have completed testing to reduce charges being levied by Microsoft for these resources.
ImportantBefore you begin, create a VM and let it run for a few hours so you can gather some usage metrics. Also create an Azure Blob Storage account and upload a few test documents before and after setting up monitoring to capture usage logs.
Using The Azure Portal
To set up and use Azure Monitor using the Azure Portal, follow these steps.
Create Metrics Alerts
Log in to the Azure Portal, and browse to the VM you created in your Azure environment for the purposes of this walkthrough.
In the left pane of the VM’s configuration blade, under Monitoring,click Metrics. (See Figure 4-11.)
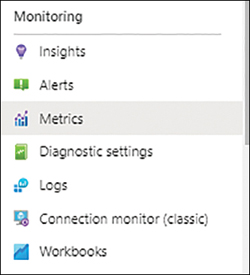
FIGURE 4-11Select Metrics under Monitoring.
A default metrics visualization opens in the right pane. (See Figure 4-12.) This visualization contains the following options:
Add MetricClick this button to add metrics to the visualization.
Line ChartClick this button and choose a different view for the visualization from the drop-down list that appears. The options are Area Chart, Bar Chart, Scatter Chart, and Grid.
Drill Into LogsClick this button to dig deeper into the logs captured for this resource for a better understanding of the metrics that you are viewing. (This feature is currently in preview, so we will not dive into it here, as its functionality is subject to change.)
New Alert RuleClick this button to set up a new alert rule for this metric. You will learn how to do this in a moment.
Save to DashboardClick this button to pin this metric visualization to a dashboard or send it to a workbook.
MetricsClick this to change the metric displayed in the visualization. The metric shown in Figure 4-12 is Source VM CPU Credits Consumed Avg.
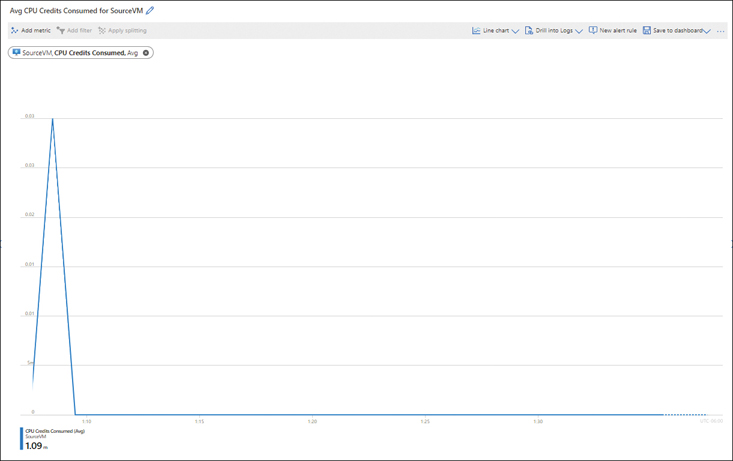
FIGURE 4-12Avg CPU Credits Consumed for Source VM.
Click the New Alert Rule button.
The Create an Alert Rule wizard starts with the Condition tab displayed. (See Figure 4-13.) Depending on your needs, you can do one of the following:
Leave the settings in the Conditiontab as is.
Click the Add Conditionbutton and follow the prompts to add a new condition for the rule to assess along with the current one.
Click the link for the condition in the Condition Namelist to edit the condition.
NoteThe Scope tab is automatically populated with the details of the VM you selected.
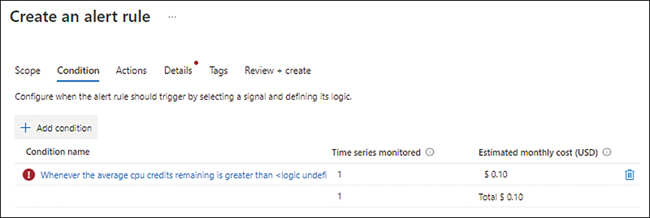
FIGURE 4-13Create an alert rule.
For this exercise, we will edit the condition.
Click the link for the condition in the Condition Name list.
The Alert Logic section of the Configure Signal Logic dialog box offers different options depending on what you select as the Threshold setting. We will explore these different settings now.
In the Alert Logic section, under Threshold, click Static.
You’ll see the settings shown in Figure 4-14. You don’t need to change any of these settings; we are simply going to review them here:
OperatorThe options in this drop-down list are Greater Than, Less Than, Greater Than or Equal To, and Less Than or Equal To.
Aggregation TypeThe options in this drop-down list are Average, Maximum, Minimum, Total, and Count.
Threshold ValueHere, you enter the threshold value to monitor against.
UnitThis is where you select the threshold unit.
Aggregation Granularity (Period)This defines the period over which the aggregation points will be grouped for analysis.
Frequency of EvaluationThis is where you specify how often the rule should be triggered.
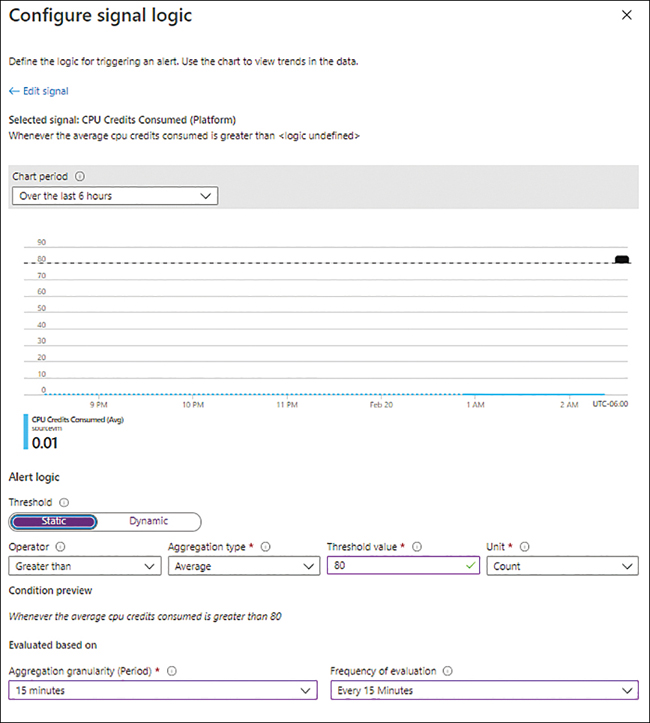
FIGURE 4-14Configure Signal Logic Static Threshold settings.
In the Alert Logic section, under Threshold, click Dynamic.
You’ll see the settings shown in Figure 4-15. For this exercise, we will create a dynamic threshold, so you will change these settings as outlined here.
OperatorThe options in this drop-down list are the same as for the Static Threshold settings. For this example, choose Greater or Less Than.
Aggregation TypeThe options in this drop-down list are the same as for the Static Threshold settings. For this example, choose Average.
Threshold SensitivityThe options in this drop-down list are High, Medium, and Low. For this example, choose Medium.
Aggregation Granularity (Period)This option is the same as for the Static Threshold settings. For this example, choose 5 Minutes.
Frequency of EvaluationThis option is the same as for the Static Threshold settings. For this example, choose Every 5 Minutes.
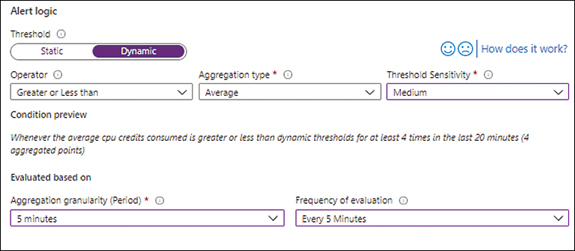
FIGURE 4-15Configure Signal Logic Dynamic Threshold settings.
Click Advanced Settings, enter the following information, and click OK. (See Figure 4-16.)
Number of ViolationsThis number specifies how many violations should occur before the alert is triggered. For this exercise, choose 4.
Evaluation PeriodThis indicates the timeframe during which the specified number of violations must occur to trigger an alert. In this case, choose 20 Minutes.
Ignore Data BeforeTo begin monitoring for the alert conditions at some date and time in the future, select this check box and choose the desired date and time. We’ll leave this unchecked in this case.
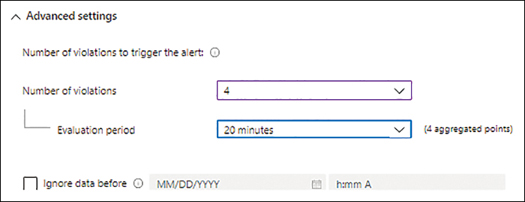
FIGURE 4-16Configure Signal Logic Dynamic Threshold settings.
Back in the Condition tab of the Create an Alert Rule wizard (see Figure 4-17), click Next.
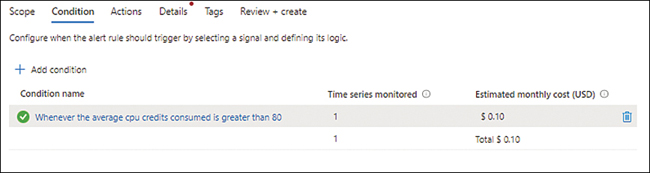
FIGURE 4-17Back to the Condition tab of the Create an Alert Rule wizard.
In the Actions tab of the Create an Alert Rule wizard (see Figure 4-18), you can select an existing action group or create a new one. In our case, we will create a new one.
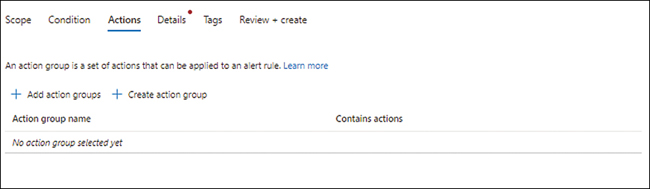
FIGURE 4-18Actions tab.
Click the Create Action Group button.
In the Basics tab of the Create an Action Group wizard (see Figure 4-19), enter the following information. Then click Next.
SubscriptionSelect the subscription you want to use to create the action group.
Resource GroupSelect the resource group you want to use to create the action group. Alternatively, click the Create New link and follow the prompts.
Action Group NameType a unique name for the action group.
Display NameType a unique display name for the action group. This can contain a maximum of 12 characters.
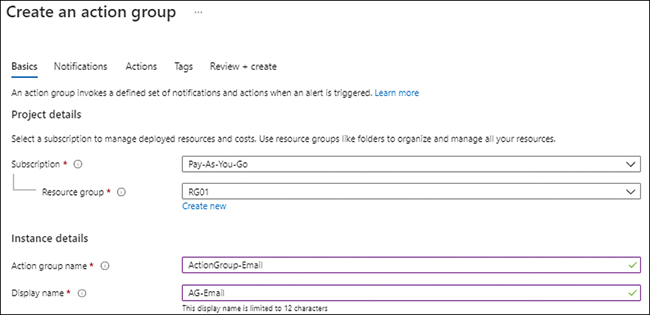
FIGURE 4-19Basics tab in the Create an Action Group wizard.
The Notifications tab opens. (See Figure 4-20.) Here, you select the notification type for any alerts triggered by the role. You can choose to send the notification by email to an Azure resource manager role or to send it by email, SMS message, push, or voice to the recipient(s) of your choosing.
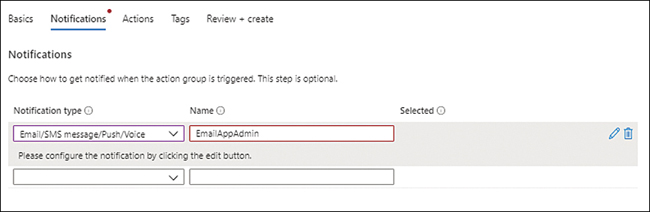
FIGURE 4-20The Notifications tab of the Create an Action Group wizard.
In the Notification Type drop-down list, choose Email/SMS Message/Push/Voice.
In the Email/SMS Message/Push/Voice dialog box (see Figure 4-21), enter the following information. Then click OK.
EmailSelect this check box and enter the email address to send email notifications to when the alert rule is triggered.
NoteYou can only enter one email address in this field. If you want to send the notification to multiple email addresses, use email groups or set up multiple notification types.
SMSSelect this check box and enter a country code and phone number to send SMS notifications to when the alert is triggered.
Azure Mobile App NotificationIn this case, leave this unchecked. You would select this if you wanted to send a notification by way of an Azure mobile app.
VoiceIn this case, leave this unchecked. You would select this if you wanted to send a voice-based notification.
Enable the Common Alert SchemaYou select this option to standardize the alert schema across all the different alerting options. In this case, click No.
In the Notifications tab of the Create an Action Group wizard, click Next.
In the Actions tab, open the Action Type drop-down list and choose what type of action you want to perform when the alert rule is triggered. In this case, choose Automation Runbook. Then enter a name for the action type (here, RestartVM) and click Next. (See Figure 4-22.)
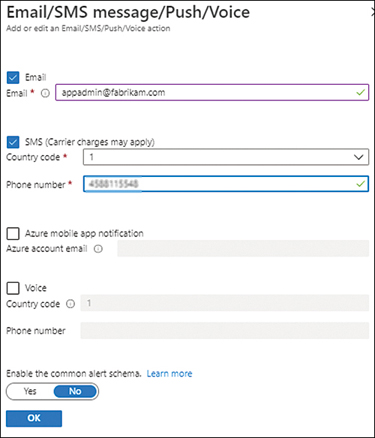
FIGURE 4-21The Email/SMS message/Push/Voice section.
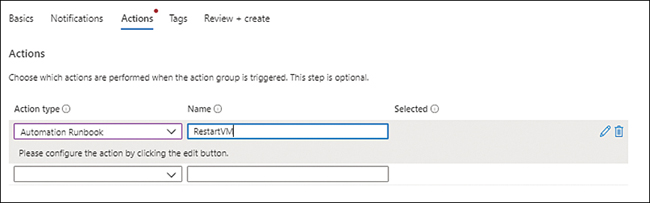
FIGURE 4-22The Actions tab of the Create an Action Group wizard.
In the Configure Runbook dialog box (see Figure 4-23), enter the following information. Then click OK.
Run RunbookClick Enable to specify that the runbook should be run.
Runbook SourceSelect the runbook source. In this case, choose Built-in.
When you choose Built-in as the runbook source, the dialog box displays additional settings. These are also shown in Figure 4-23.
RunbookChoose the built-in runbook you want to use. In our case, we select Restart VM.
SubscriptionChoose the Azure subscription that contains the Azure Automation account you want to use.
Automation AccountSelect the automation account you want to use. Alternatively, click New and follow the prompts.
Enable the Common Alert SchemaFor this example, choose No.
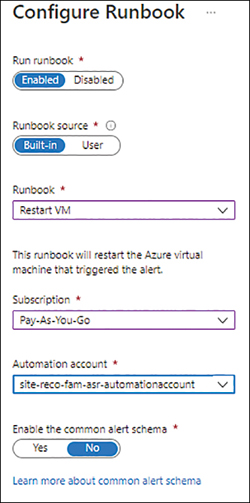
FIGURE 4-23The Configure Runbook dialog box.
In the Actions tab of the Create an Action Group wizard, click Next.
In the Tags tab (see Figure 4-24), enter a name and value for any tags you want to associate with the action group, and click Next.
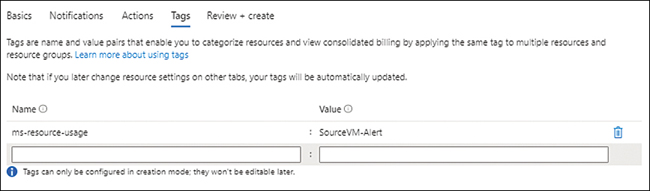
FIGURE 4-24The Tags tab of the Create an Action Group wizard.
In the Review + Create tab (see Figure 4-25), review your settings, and click Review + Create to create the action group.
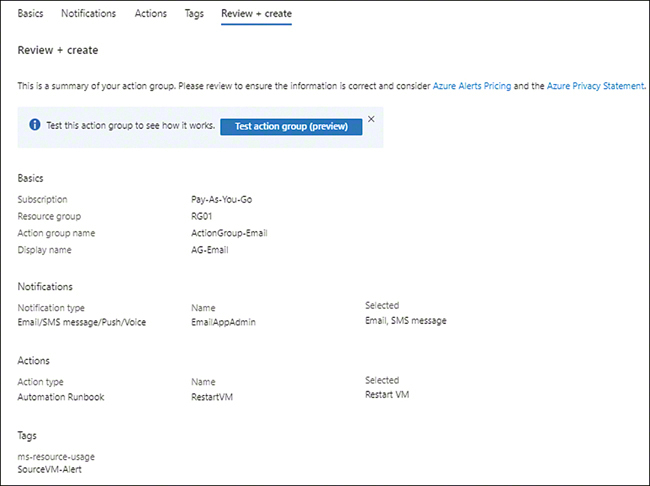
FIGURE 4-25The Review + Create tab of the Create an Action Group wizard.
The action group you just created appears in the Actions tab of the Create a Metric Alert wizard (see Figure 4-26).
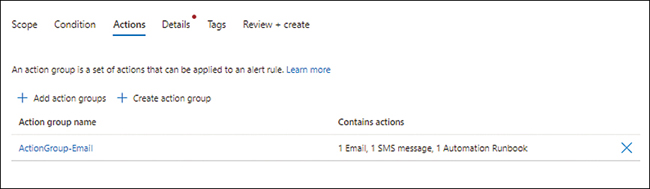
FIGURE 4-26Back in the Actions tab of the Create a Metric Alert wizard.
Optionally, create additional action groups.
Click Next.
In the Details tab of the Create a Metric Alert wizard (see Figure 4-27), enter the following information. Then click Next:
SubscriptionSelect the subscription you want to use to create the metric alert.
Resource GroupSelect the resource group you want to use to create the metric alert. Alternatively, click the Create New link and follow the prompts.
SeverityChoose a severity for the alert when the rule conditions are met. You can select between Critical, Error, Warning, Informational, and Verbose based on your requirements. Here, select 1-Error.
Alert Rule NameType a unique name for the alert rule.
Alert Rule DescriptionType a description of the alert rule.
Enable Upon CreationSelect this check box.
Automatically Resolve AlertsSelect this check box.
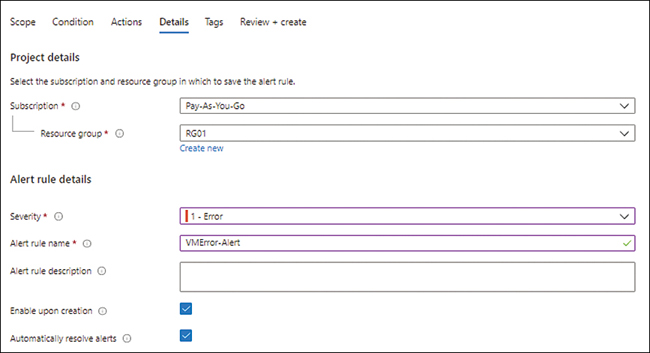
FIGURE 4-27The Details tab of the Create a Metric Alert wizard.
In the Tags tab (see Figure 4-28), enter a name and value for any tags you want to define for the alert rule. Then click Next.
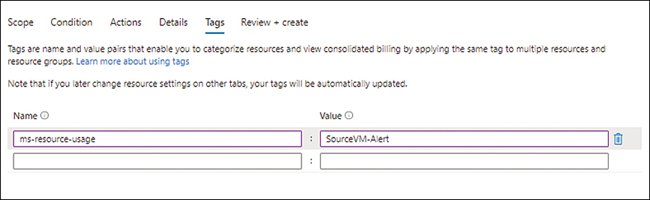
FIGURE 4-28The Tags tab of the Create a Metric Alert wizard.
In the Review + Create tab (see Figure 4-29), review your settings and click Review + Create to create the metric alert.
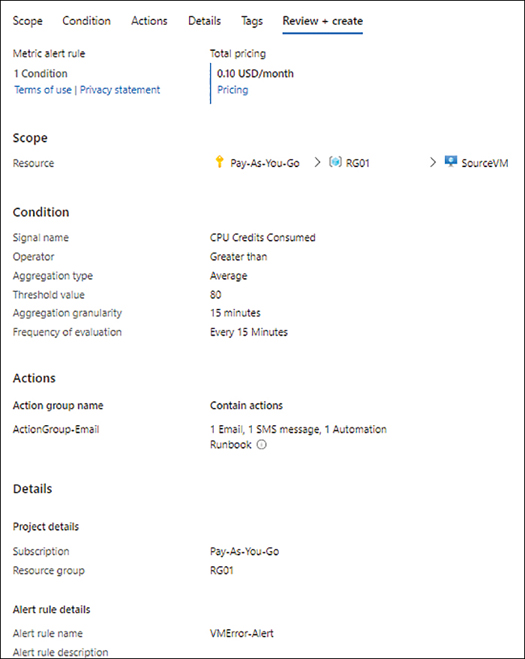
FIGURE 4-29The Review + Create tab of the Create a Metric Alert wizard.
Create Log Analytics Workspace
Next, you need to create a Log Analytics workspace.
Type log analytics workspace in the Azure Portal search box and select it from the list that appears. (See Figure 4-30.)
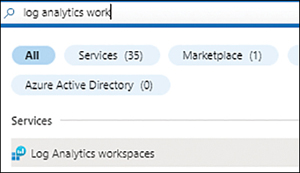
FIGURE 4-30Searching for Log Analytics workspace.
Click the Create Log Analytics Workspace button. (See Figure 4-31.)
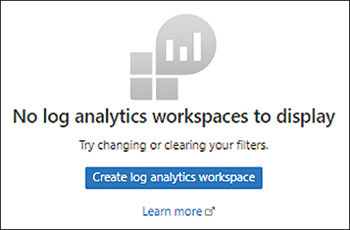
FIGURE 4-31Starting the Create Log Analytics Workspace wizard in Azure Portal.
In the Basic tab of the Create Log Analytics Workspace wizard (see Figure 4-32), enter the following information. Then click Next:
SubscriptionSelect the subscription you want to use to create the workspace.
Resource GroupSelect the resource group you want to use to create the workspace. Alternatively, click the Create New link and follow the prompts.
NameEnter a unique name for the workspace.
RegionSelect the Azure region to host the workspace.
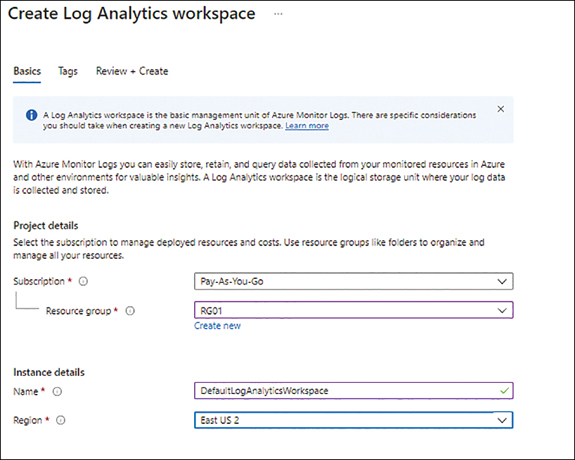
FIGURE 4-32The Basic tab of the Create Log Analytics Workspace wizard.
In the Tags tab (see Figure 4-33), type a name and value for any tags you would like to associate with the workspace, and click Next.
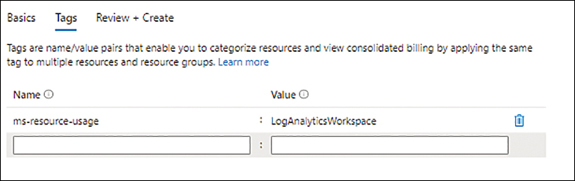
FIGURE 4-33The Tags tab in the Create Log Analytics Workspace wizard.
In the Review + Create tab (see Figure 4-34), review your settings, and click Review + Create to create the workspace.
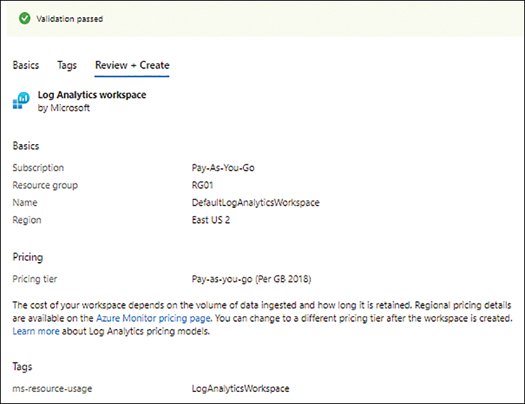
FIGURE 4-34Review + Create tab in the Create Log Analytics Workspace wizard.
Configure Azure VM Monitoring
Now that you have created the Log Analytics workspace, you can set up monitoring for your Azure VM.
In Azure Portal, navigate to the VM for which you want to set up monitoring.
In the left pane of the VM’s configuration blade, under Monitoring, click Metrics. (See Figure 4-35.)
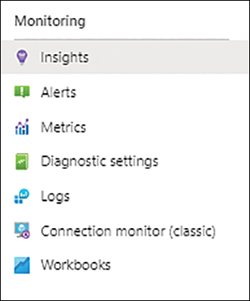
FIGURE 4-35Configure monitoring for the Azure VM.
In the right pane, click the Enable button to enable Insights. (See Figure 4-36.)
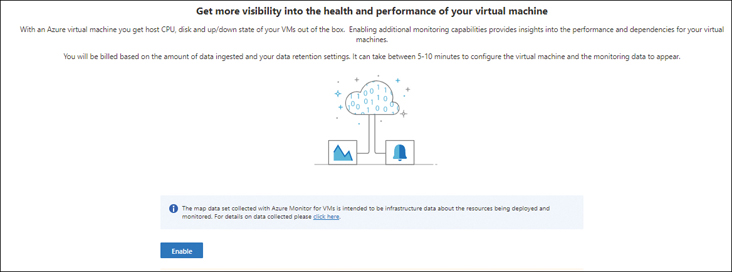
FIGURE 4-36Enable Insights.
Azure Monitor automatically locates an existing Log Analytics workspace and its associated subscription. If it is not the right one for your environment, select the appropriate subscription and Log Analytics workspace. (See Figure 4-37.)
![The figure shows a screenshot of the Azure Monitor with the Workspace Subscription set as Pay-As-You-Go and the Choose a Log Analytics Workspace field set up as DefaultLogAnalyticsWorkspace [eastus2]. Once these have been selected, you can click the Enable button at the bottom left.](https://imgdetail.ebookreading.net/2023/10/9780137571031/9780137571031__9780137571031__files__graphics__04fig37.jpg)
FIGURE 4-37Locating the subscription and workspace.
Click the Enable button.
When the VM’s integration with the Log Analytics workspace is complete, the VM’s Performance tab opens with the Logical Disk Performance view displayed. This view includes the following metrics for VM resources by default (see Figure 4-38):
CPU Utilization %
Available Memory %
Logical Disk IOPS
Logical Disk MB/s
TipYou can scroll through the list of metrics; there are many more available. You can also change the view’s time range. You can also pin key metrics to a dashboard for easy viewing.
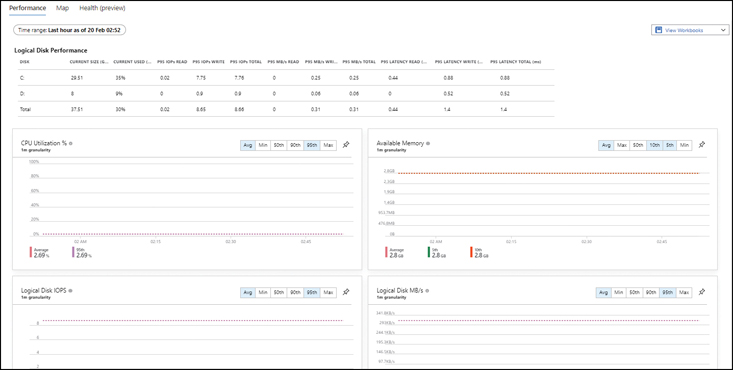
FIGURE 4-38Performance Tab of the Azure VM.
Click the Map tab.
NoteIt might take a few minutes for the map to load, depending on how much time the service has had to analyze your VM.
You will see a map similar to the one shown in Figure 4-39. This map contains all the active ports on the VM and the processes actively using each port.
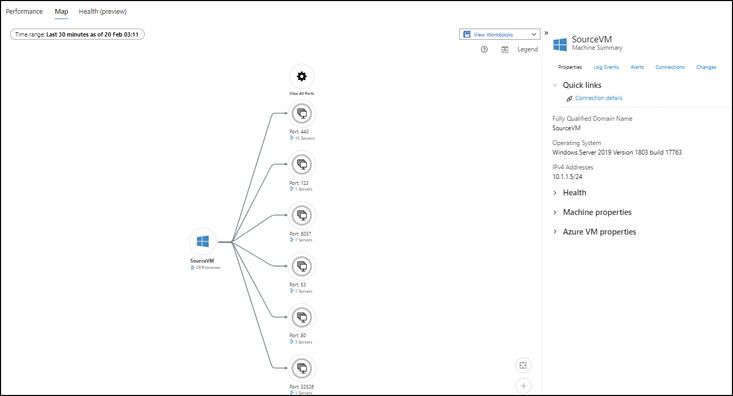
FIGURE 4-39The Azure VM’s Map tab.
Click a port or service to see more information about it. (See Figure 4-40.) This will give you deeper insights into the VM.
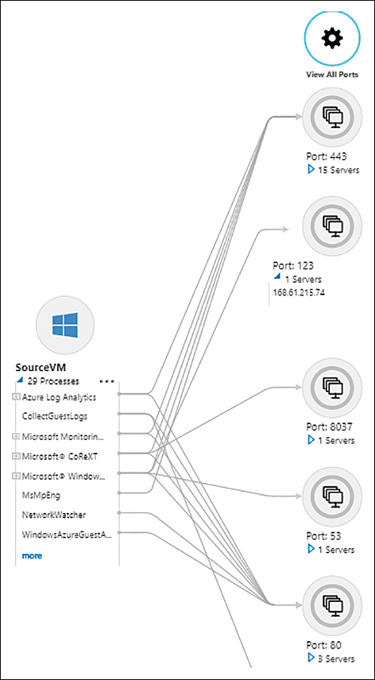
FIGURE 4-40Viewing more information about a service or port.
Set Up Azure VM Insights Alerts
At this point, you’re ready to set up an alert. For this example, you will create an alert for low disk space. Because your test VM likely does not have low disk space at this time, you can either set the monitoring threshold very high or add data to the VM disk to reduce the space below your monitoring threshold. In our case, we will do the former—raise an alert if the C drive goes below 90% free. (In production use, you would generally not set such a high threshold for disk space alerts.)
In the pane to the right of the Map tab, click the Log Events link.
In the Event Type list (see Figure 4-41), click InsightsMetrics.
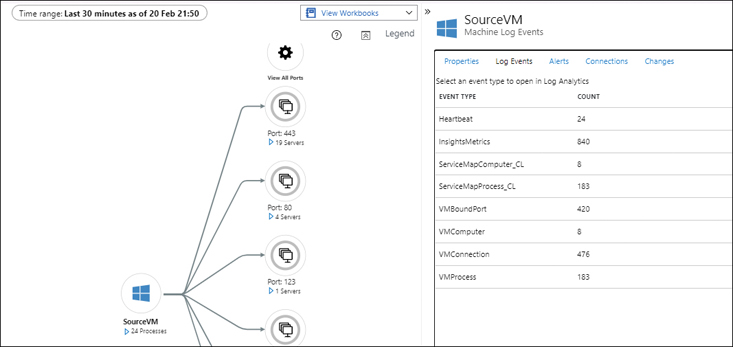
FIGURE 4-41The Insight option in the Map tab of the Azure VM.
The Log Explorer window opens with a pre-defined query that searches for all InsightsMetrics for the VM. (See Figure 4-42.) You will see various metrics, including Network, LogicalDisk, Processor, Memory, and others.
Locate the metric for which you want to set up the alert—in our case, the LogicalDisk FreeSpacePercentage metric.
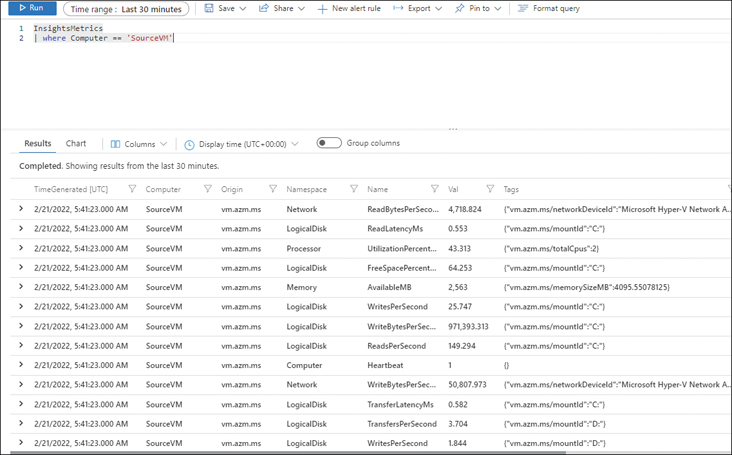
FIGURE 4-42The InsightsMetrics for the Azure VM.
In the pre-populated query at the top of the Log Explorer window, enter the following code after the VM name (‘SourceVM’), as shown in Figure 4-43. Then click Run.
And Namespace == 'LogicalDisk' and Name == 'FreeSpacePercentage'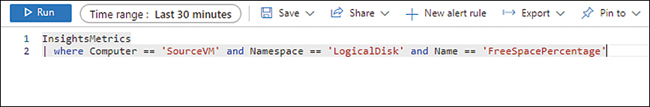
FIGURE 4-43The InsightsMetrics search.
The Log Explorer window returns a list of LogicalDisk FreeSpacePercentage metrics. (See Figure 4-44.)
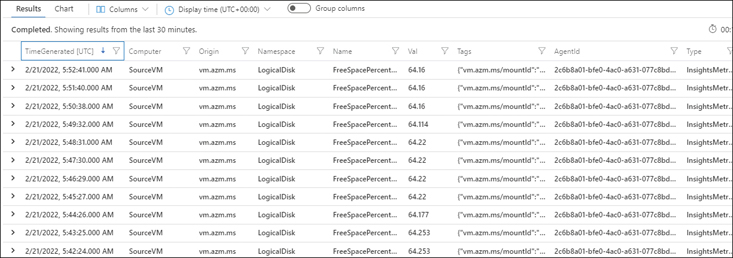
FIGURE 4-44LogicalDisk FreeSpacePercentage metrics for the Azure VM.
Click the New Alert Rule button along the top of the Log Explorer window. (See Figure 4-45.)
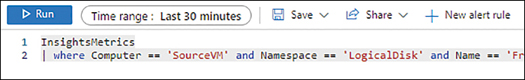
FIGURE 4-45The New Alert Rule button.
In the Condition tab of the Create an Alert Rule wizard, under Measurement, change the following settings (see Figure 4-46):
MeasureChoose Val.
Aggregation TypeSelect Average.
Aggregation GranularityChoose 5 Minutes.
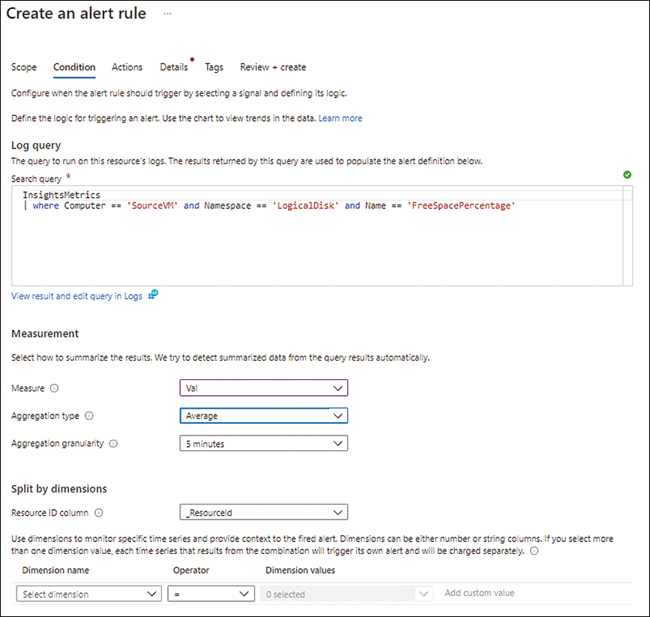
FIGURE 4-46The Condition tab of the Create an Alert Rule wizard.
Leave the settings in the Split by Dimensions section of the Condition tab at their default values.
In the Alert Logic section of the Condition tab (see Figure 4-47), enter the following information. Then click Next:
OperatorSelect Less Than or Equal To.
Threshold ValueType 90. (Remember: You want a high value here to make it easier to trigger the alert, just for the purposes of this exercise.)
Frequency of EvaluationSelect 5 Minutes.

FIGURE 4-47The Alert Logic section of the Condition tab.
In the Actions tab, click Add Action Groups, and select the action group you created earlier. Alternatively, you can click Create Action Group and follow the prompts to create a new one. (See Figure 4-48.) Then click Next.
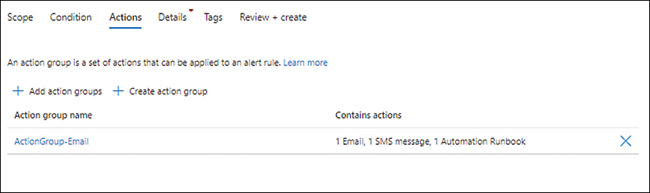
FIGURE 4-48Choose an action group.
In the Details tab (see Figure 4-49), change the following settings (leave the others at their default values). Then click Next:
SubscriptionSelect the subscription you want to use to create the alert rule.
Resource GroupSelect the resource group you want to use to create the alert rule. Alternatively, click the Create New link and follow the prompts.
SeveritySelect 2-Warning.
Alert Rule NameType a unique name for the alert rule.
Alert Rule DescriptionType a description of the alert rule.
RegionSelect the Azure region in which to create the alert rule.
Enable Upon CreationSelect this check box.
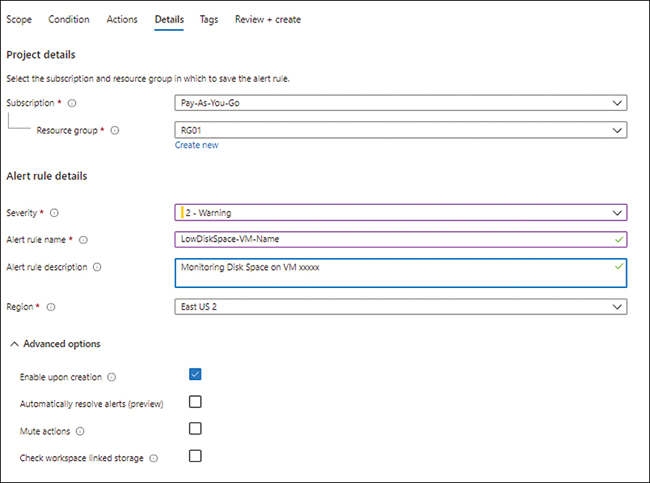
FIGURE 4-49Enter the alert rule details.
In the Tags tab (see Figure 4-50), type a name and value for any tags you want to add for this alert rule, and click Next.
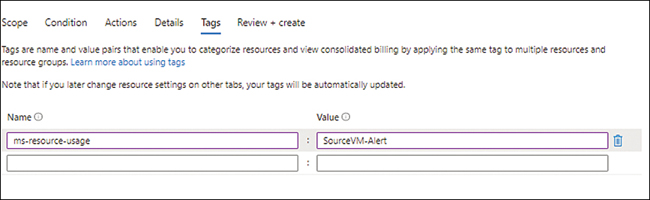
FIGURE 4-50Adding tags to the alert rule.
In the Review + Create tab, review your settings, and click Review + Create to create the alert rule.
After the alert has been created, let your system run for 15 or 20 minutes.
The alert should trigger frequently, indicating low disk space on the test VM. (See Figure 4-51.)
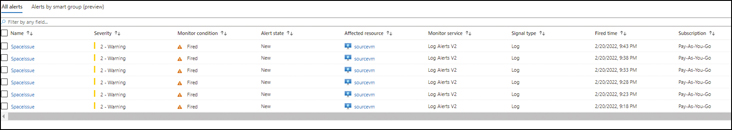
FIGURE 4-51Test VM results.
Configure Azure Storage Monitoring
Finally, you can set up monitoring for an Azure Storage account.
In Azure Portal, navigate to the Azure Storage account for which you would like to set up monitoring.
In the left pane of the Azure Storage account’s configuration blade, under Monitoring, click Diagnostic Settings. (See Figure 4-52.)
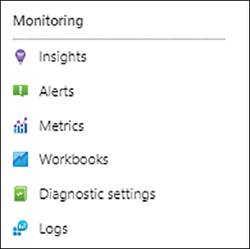
FIGURE 4-52Setting up an Azure Storage account for monitoring.
The pane on the right shows the current diagnostic status of the various storage types. (See Figure 4-53.)
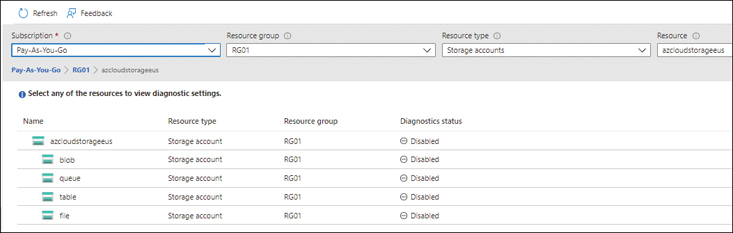
FIGURE 4-53Azure Storage account diagnostic status.
Click the blob entry in the Name list.
Azure displays the blob’s diagnostic configuration. As shown in Figure 4-54, the blob’s diagnostic settings are currently not configured.
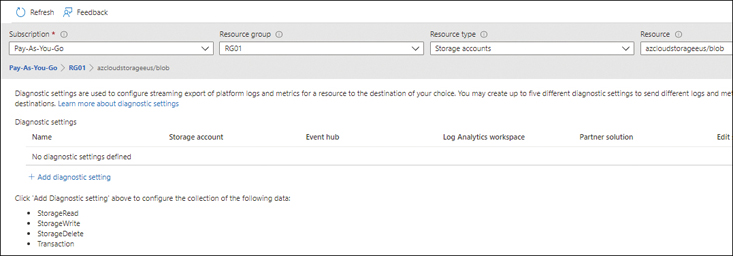
FIGURE 4-54Blob diagnostic status.
Click the Add Diagnostic Setting link.
In the Diagnostic Setting dialog box (see Figure 4-55), change the following settings. (Leave any other settings at their default value.) Then click Save.
Diagnostic Setting NameType a name for the diagnostic setting.
Logs/CategoriesSelect the check box next to each log category you want to collect—in this case, StorageRead, StorageWrite, and StorageDelete.
MetricsSelect the check box next to each metric you want to collect—here, Transaction.
Send Log to Analytics WorkspaceSelect this check box. Then enter the details for the workspace in the settings that appear, including the workspace’s subscription and name. In this case, select the workspace you created earlier.
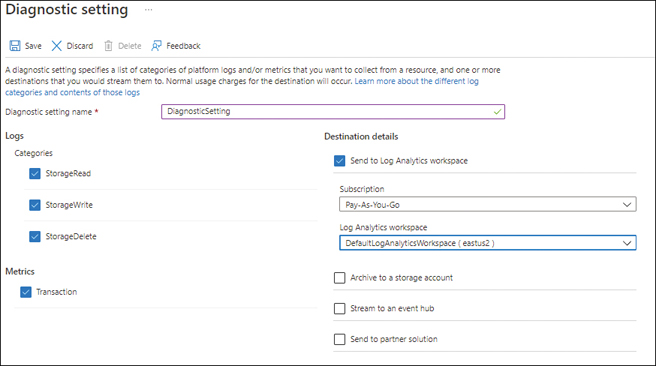
FIGURE 4-55The Diagnostic Setting dialog box for the Azure Storage account.
You can set up the diagnostic settings for any other storage resource type by following these same steps. (See Figure 4-56.) You can apply the same settings as you did for blob or different settings based on the storage type. You can also set up diagnostic settings on the storage account level to apply the same settings across the entire account.
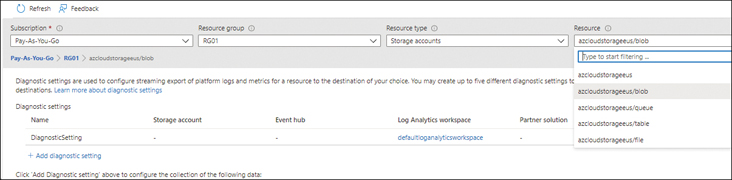
FIGURE 4-56Azure Storage account diagnostic status.
Run Queries On Azure Storage
Now that you’ve configured the diagnostic settings for log collection for your storage account, run a few queries in the Azure Portal to monitor the output and set up alerts if needed.
In the left pane of the configuration blade for the Azure Storage account for which you configured the diagnostic settings, under Monitoring, click Logs. (See Figure 4-57.)
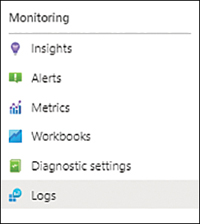
FIGURE 4-57Azure Storage account logs monitoring.
A query explorer opens, with a set of pre-defined queries for you to run. These include frequently used queries for auditing, performance monitoring, error tracking, and alerting purposes. (See Figure 4-58.)
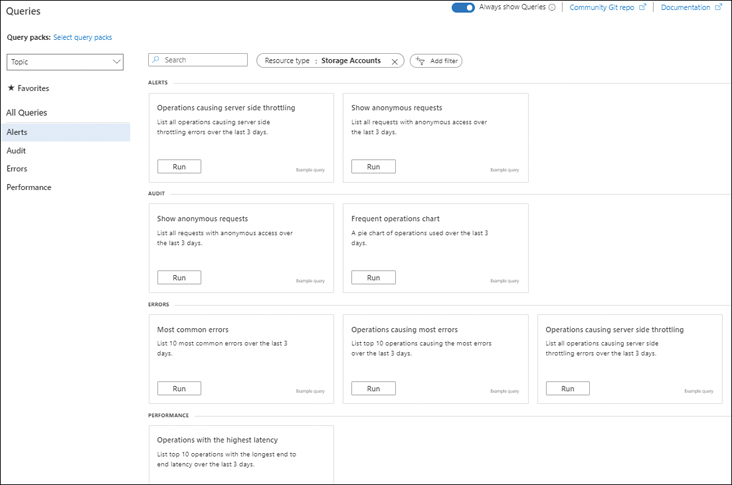
FIGURE 4-58The Azure Storage query explorer.
Because you most likely would not have any errors or performance bottlenecks in your test storage, you need to select a query that might show some output, such as one that generates a Frequent Operations chart.
Click the Run button in the Frequent Operations tile of the query explorer.
The system displays a pie chart showing the frequency of all operations performed on this test storage account. (See Figure 4-59.)
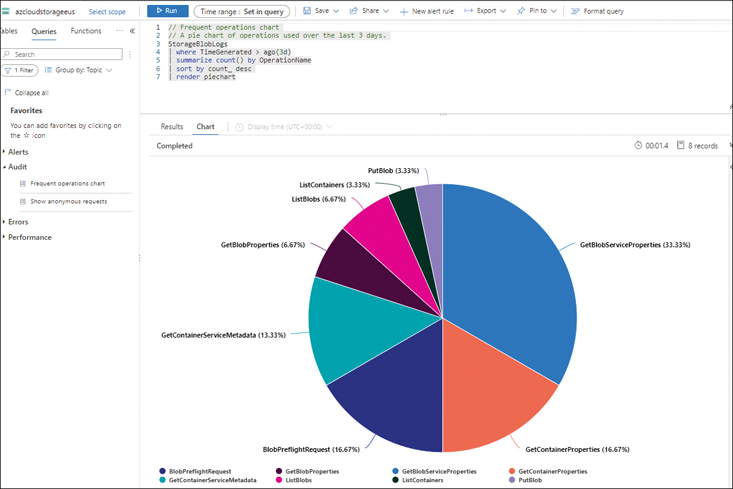
FIGURE 4-59The frequent operations chart on Azure Storage.
NoteAfter you have used this storage account for a period, you can employ one of the other queries or create your own custom query (as you did earlier for the VM) and set up alerts to monitor on a regular basis.
Best practices
Following are some general best practices regarding using the Azure Monitor service based on real-world deployments that can help you optimize your configuration or deployment.
Deploy or migrate to Azure Monitor agentsUse the Azure Monitor agent on Windows and Linux VMs instead of the legacy Log Analytics agent. The Log Analytics agent will be retired in August 2024. Still, it is recommended to migrate to the newer agent as soon as possible. First, though, evaluate all the monitor solutions you are currently using. If they are compatible, you can migrate to the new agent gracefully, as Microsoft will make all new Azure Monitor functionality and capabilities available to new agent installs. The agent already supports newer functionality such as filtering, scoping, and multi-homing of data. The Azure Monitor agent also uses system-managed identities instead of the legacy workspace keys required by Log Analytics agents. This makes larger deployments of agents easier and more secure.
Use Application Insights for better application monitoringApplication Insights can provide you with deeper insights into user behavior, application behavior, application performance, and so on. This will help you resolve critical issues more quickly. It also provides actionable insights to optimize your product and improve responsiveness. Finally, you can use Application Insights proactively to identify and address potential issues with your application.
Use Private Link for private connectivity to Azure MonitorThe Private Link service allows you to connect to Azure Monitor over a private network using Azure ExpressRoute. As a result, all your logging traffic will be transmitted and accessible only over a private network. This can be advantageous in environments with compliance requirements that prohibit the transmission of such logs over public networks.
Use keys to encrypt Azure Storage accounts used by Log AnalyticsYou can use Microsoft-managed keys to encrypt this storage, or you can use your own keys integrated with Azure Key Vault to achieve this encryption. If there are compliance reasons for your environment to use your own customer-managed keys, Azure Monitor does support this, and you can use this capability if the need arises.
Use AutoScale when possibleAzure Monitor supports the use of monitoring rules to trigger autoscaling for various Azure workloads, such as Azure VM scale sets, Azure API Management services, Azure App Services, and Azure Cloud Services. So, you can build logic within your application to automatically scale up or down based on user load, which improves application response times and optimizes costs. This is a great feature to use, provided your application supports it.
Automatically enable monitoring for new Azure resourcesAzure Monitor allows you to automatically enable monitoring for new resources added into your environment to ensure they are actively observed from the start. Continuous monitoring using DevOps integration is also supported, so new application resources are automatically brought under the purview of Azure Monitor. It is a good practice to set up these capabilities so you can easily identify root causes for any issues in your environment without having to constantly intervene manually to ensure workloads are being monitored.
Set up actionable alertsSometimes it’s not enough to receive an alert. You need an alert that can perform some type of pre-defined action to mitigate whatever condition triggered the alert. These are called actionable alerts. Examples of actionable alerts include autoscaling workloads based on resource utilization, triggering Azure Automation runbooks based on resource metrics, and triggering webhooks to activate external resources based on pre-defined criteria or log events. Automatically sending email messages, SMS messages, or voice calls to relevant administrators of a resource are also classified as actionable alerts. However, when possible, it’s preferable to configure automated actions that will alleviate or resolve the issue without manual intervention to minimize downtimes.
Use dynamic thresholds when possibleUnlike static thresholds, dynamic thresholds enable Azure Monitor to develop monitoring baselines based on observed usage of a resource. This can in turn reduce the number of false positive alerts. Use dynamic thresholds for resources that do not have consistent usage and can have temporary fluctuations in performance that might trigger false positives.
Share dashboards between teams to ensure consistent monitoringAzure Monitor allows you to share dashboards so that different team members or inter-dependent teams monitor the same resource metrics and events. This ensures a timely response when issues arise. It is a good practice to develop these dashboards in collaboration with the different team members and interconnected teams to identify and track the correct key performance indicators (KPIs) for each application or service they are monitoring.
Review your monitoring thresholds and KPIs on a regular basisIt is a good practice, especially in large organizations, to conduct regular collaborative reviews of the monitoring setup and update thresholds and KPIs based on ongoing developments, internal feedback, historical performance metrics, and other relevant criteria. This will help ensure that your monitoring solution is up to date and provides relevant alerts.