Chapter 5
Azure Network Watcher
Overview
Azure provides a suite of tools under the Azure Network Watcher service that you can use to monitor and troubleshoot network issues for IaaS resources such as virtual machines (VMs), virtual private network (VPN) gateways, ExpressRoute connections, virtual networks, application gateways, and so on. These tools can perform point-in-time checks to analyze and troubleshoot ongoing issues, or monitor, analyze, and show availability and latency trends over time to optimize performance.
The tools have evolved over time to cover different networking scenarios encountered in the Azure IaaS environment that require constant monitoring or troubleshooting on an ongoing basis. Some of these scenarios include the following:
Analyzing and troubleshooting inbound and outbound network traffic filtering for VMs.
Analyzing and troubleshooting network routing issues affecting IaaS workloads.
Monitoring traffic between IaaS endpoints or IaaS and non-Azure endpoints for latency, availability, and diagnostics.
Performing IP flow log analysis to improve network performance.
Troubleshooting issues with VPN connectivity to Azure gateways.
To achieve each of these objectives, Network Watcher provides a toolset that includes monitoring, diagnostic, and logging tools such as the following:
Connection Monitor
Topology Monitor
IP Flow Verify
NSG Diagnostic
Security Rules Analyzer
VPN Troubleshooter
Packet Capture Tool
Connection Troubleshooter Tool
NSG Flow Logs Capture
Enabling Azure Network Watcher
Before you can use these tools, you must enable the Azure Network Watcher service. The following steps show you how:
Log in to the Azure Portal, type network watcherin the search box, and select it from the list that appears. (See Figure 5-1.)

FIGURE 5-1Search for the Network Watcher service.
In the Overview tab of the Network Watcher page, click the Add button. (See Figure 5-2.)
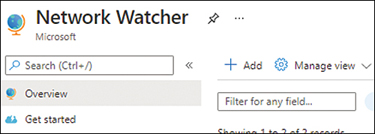
FIGURE 5-2Click Add in the Overview tab.
On the Add Network Watcher page (see Figure 5-3), select the subscription and regions in which you want to enable Network Watcher, and click Add.

FIGURE 5-3Add Network Watcher page.
Azure will enable support for Network Watcher in the selected regions in a matter of minutes.
Key features
This section covers each of the tools listed in the chapter overview to provide you with a better understanding of how each one can be set up and used to address networking issues in any Azure environment.
Connection Monitor
Connection Monitor enables you to regularly monitor communications between Azure IaaS VMs and other Azure IaaS workloads or endpoints and non-Azure endpoints to detect and diagnose availability, latency, and performance issues. The non-Azure workloads can include the following:
Servers on which the Microsoft Log Analytics agent has been deployed
Fully qualified domain names (FQDNs) such as portal.office.com
Uniform resource locators (URLs) such as https://portal.azure.com
IPv4 addresses such as 23.11.197.159 (resolves to www.microsoft.com)
By monitoring on a regular time interval, Connection Monitor can issue an alert when workloads or services have gone offline or are unreachable. Connection Monitor also gathers latency information from different regions to identify bottlenecks and issue alerts. This can help with future planning for workload hosting or migration.
Connection Monitor walkthrough
The following sections walk you through the process of creating a Connection Monitor instance with the Azure Portal.
ImportantIf you are following along, you’ll want to select resources and unique resource names based on your environment for each of your deployments.
ImportantIf you are following along, delete any unwanted resources after you have completed testing to reduce charges being levied by Microsoft for these resources.
Using The Azure Portal
To create a Connection Monitor instance using the Azure Portal, follow these steps:
Log in to the Azure Portal, type network watcherin the search box, and select it from the list that appears.
In the left pane of the Network Watcher configuration blade, under Monitoring, click Connection Monitor. (See Figure 5-4.)

FIGURE 5-4Click Connection Monitor.
On the Connection Monitor page, click the Create button. (See Figure 5-5.)

FIGURE 5-5Connection Monitor – Create Connection Monitor wizard.
In the Basics tab of the Create Connection Monitor wizard (see Figure 5-6), enter the following information and click Next:
Connection Monitor NameEnter a unique name for this Connection Monitor instance.
SubscriptionSelect the subscription you want to use.
RegionSelect the region for the Connection Monitor instance. This should match the region hosting the workload you want to monitor.
Workspace ConfigurationSelect an existing Log Analytics workspace or let the wizard create one for you.
In the Test Groups tab (see Figure 5-7), click Add Test Group to define the source, destination, and testing configurations.

FIGURE 5-6The Basics tab of the Create Connection Monitor wizard.

FIGURE 5-7The Test Groups tab of the Create Connection Monitor wizard.
On the Add Test Group Details page (see Figure 5-8), type a name for the test group in the Test Group Name box.

FIGURE 5-8Add Test Group Details page.
Click the Add Sources button in the Sources section of the Add Test Group Details page.
Use the tabs in the Add Sources dialog box to add the Azure and non-Azure endpoints you want to use to monitor the connection. (See Figure 5-9.) Then click Add Endpoints.
NoteYou can select multiple Azure and non-Azure endpoints as sources, depending on your needs.

FIGURE 5-9Create Connection Monitor – Add Sources.
Back in the Add Test Group Details page, under Test Configurations, click the Add Test Configuration button. (See Figure 5-10.)

FIGURE 5-10Create Connection Monitor – Add Test Configuration.
In the New Configuration tab of the Add Test Configuration page (see Figure 5-11), enter the following information. Then click the Add Test Configuration button:
Test Configuration NameEnter a unique name for the test configuration.
ProtocolSelect HTTP, TCP, or ICMP. In this case, I selected ICMP.
NoteDifferent options will appear below the Protocol setting, depending on which protocol you choose. The options shown in Figure 5-11 are what you’ll see if you choose ICMP, as I did.
Disable TracerouteLeave this check box checked (the default).
Test FrequencySpecify how often you would like to perform testing.
Checks Failed (%)Specify what percentage of failure is acceptable.
Round Trip Time (ms)Enter the round-trip time (in milliseconds) deemed acceptable.
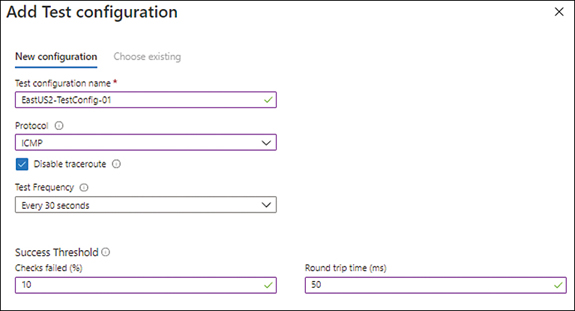
FIGURE 5-11The Add Test Configuration page.
Back in the Add Test Group Details page, under Destinations, click the Add Destinations button. (See Figure 5-12.)

FIGURE 5-12Click Add Destinations.
Use the tabs in the Add Destinations dialog box to add the Azure endpoints, non-Azure endpoints, and external addresses you want to use as destinations for testing. (See Figure 5-13.) Then click Add Endpoints.

FIGURE 5-13The Add Destinations dialog box.
NoteYou can select a combination of Azure endpoints, non-Azure endpoints, and external addresses as your destinations, depending on your needs.
If you click the External Addresses tab, you’ll see that Azure provides addresses for known Microsoft Online services by default. (See Figure 5-14.) To add your own custom URLs, click Add Endpoint and follow the prompts.

FIGURE 5-14Add Destinations – External Addresses.
Back in the Add Test Group Details page (see Figure 5-15), verify your settings. Then click Add Test Group.

FIGURE 5-15Check your settings and create the test group.
The new test group appears in the Test Groups tab of the Create Connection Monitor wizard. (See Figure 5-16.)

FIGURE 5-16The Test Groups tab with the new test group listed.
Optionally, repeat steps 5–14 to create more test groups.
After you’ve created all the test groups you need, click the Create Alert tab.
In the Create Alert tab (see Figure 5-17), under Action Group, click the Action Group button to create or select an action group.
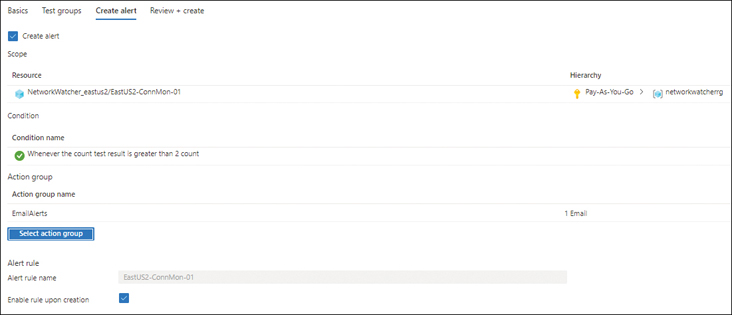
FIGURE 5-17Create Alert.
Select the Enable Rule Upon Creation check box.
Click the Review + Create button.
In the Review + Create tab (See Figure 5-18), verify your settings. Then click the Create button.

FIGURE 5-18The Review + Create tab of the Create Connection Monitor wizard.
Azure creates the Connection Monitor instance and displays its Overview tab. At first, the instance’s alert status will appear as Indeterminate. (See Figure 5-19.) It will need some time to run tests and gather data to generate output.

FIGURE 5-19The Connection Monitor Overview tab, with indeterminate status.
After you give Connection Monitor some time to run tests and gather data, refresh the Overview tab. Connection Monitor will provide an updated status that shows you that all the tests are succeeding (see Figure 5-20) or that some are failing (see Figure 5-21).

FIGURE 5-20All tests are succeeding.

FIGURE 5-21Some tests are failing.
Topology Monitor
Topology Monitor enables you to generate a visual representation of the interconnectivity between different network components in a virtual network. This can help you better understand how the different services are connected on the network layer. You can easily download this topology for editing and sharing purposes in SVG format.
The topology diagram in Figure 5-22, generated using Topology Monitor, shows a virtual network, VNET-01, that contains three subnets (default, SrcSubnet, and DestSubnet), each with one VM with a single network interface card (NIC), and a single network security group (NSG) attached to each.

FIGURE 5-22Topology diagram generated using Topology Monitor.
Topology Monitor walkthrough
The following sections walk you through the process of using Topology Monitor to create a topology diagram using the Azure Portal.
Using The Azure Portal
To use Topology Monitor to create a topology diagram using the Azure Portal, follow these steps:
Log in to the Azure Portal, type network watcher in the search box, and select it from the list that appears.
In the left pane of the Network Watcher configuration blade, under Monitoring, click Topology. (See Figure 5-23.)

FIGURE 5-23Click Topology.
In the Topology page (see Figure 5-24), enter the following information:
SubscriptionChoose the subscription that contains the network for which you want to generate a topology diagram.
Resource GroupChoose the resource group containing the components you want to include in the topology diagram.
Virtual NetworkChoose any virtual networks you want to include in the topology diagram.

FIGURE 5-24Generating a topology diagram.
Topology Monitor automatically generates the topology diagram based on your inputs in the bottom pane of the Topology page. (See Figure 5-25.)
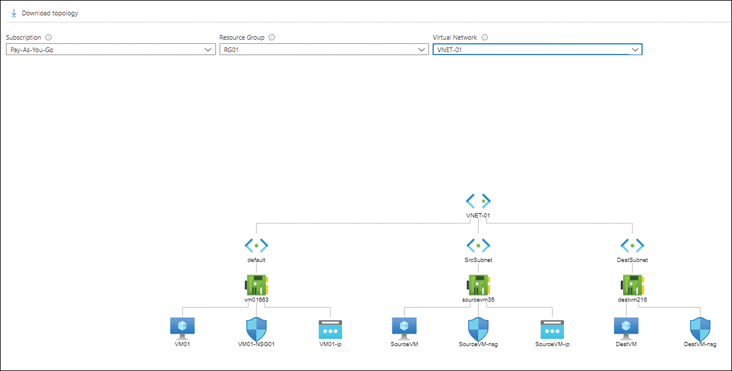
FIGURE 5-25Topology Monitor generates a topology diagram based on your inputs.
To download the topology diagram, click the Download Topology link at the top of the page.
Open the downloaded file in the viewer available on your device.
IP Flow Verify
You can use IP Flow Verify to diagnose traffic restrictions to or from an Azure VM. To use this tool to analyze traffic flow and identify restrictions, you must provide six parameters:
ProtocolThis will be TCP or UDP.
Direction of trafficThis will be inbound or outbound.
Local IP addressThis will be the local IPv4 or IPv6 address to use as the source for inbound testing or destination for outbound testing.
Local portThis will range from 0 to 65535. A single integer value is required.
Remote IP addressThis will be the remote IPv4 or IPv6 address to use as the destination for inbound testing or source for outbound testing.
Remote portThis will range between 0 and 65535. A single integer value is required.
After you provide all these parameters, IP Flow Verify tests the traffic flow, identifies any blocks, analyzes those blocks, and provides details for the security rule causing the traffic restriction.
IP Flow Verify walkthrough
The following sections walk you through the process of using IP Flow Verify to diagnose traffic flow restrictions to or from an Azure VM using the Azure Portal.
Using The Azure Portal
To use IP Flow Verify to diagnose traffic restrictions, follow these steps:
Log in to the Azure Portal, type network watcher in the search box, and select it from the list that appears.
In the left pane of the Network Watcher configuration blade, under Network Diagnostic Tools, click IP Flow Verify. (See Figure 5-26.)

FIGURE 5-26Click IP Flow Verify.
Enter the following information in the right pane (see Figure 5-27). Then click the Check button:
SubscriptionSelect the subscription for the source VM—that is, the VM whose traffic you want to analyze.
Resource GroupSelect the resource group containing the source VM.
Virtual MachineSelect the source VM.
Network InterfaceSelect the NIC on the source VM to use for the test.
ProtocolSelect the TCP or UDP option button.
DirectionSelect the Inbound or Outbound option button.
Local IP AddressEnter the local IP address to test from.
Local PortEnter the local port to use.
Remote IP AddressEnter the remote IP address to test to.
Remote PortEnter the remote port to use.

FIGURE 5-27IP Flow Verify options.
IP Flow Verify diagnoses the flow of traffic. (This takes a few seconds.) It then returns an Access Allowed message (see Figure 5-28) or an Access Denied message (see Figure 5-29). In both cases, IP Flow Verify lists the security rule that is allowing or denying the traffic, so you can take further action if necessary.

FIGURE 5-28IP Flow Verify – Access Allowed.

FIGURE 5-29IP Flow Verify – Access Denied.
NSG Diagnostic
The NSG Diagnostic tool can be used to diagnose security configuration issues for VMs, VMSS, or Application gateways on your Azure network. The tool requires a set of parameters, such as the protocol, traffic direction, source and destination IP, and port details, which it uses to evaluate all the NSG rules that traffic between VMs would encounter.
It also provides a detailed analysis of these rules, including the result of each rule and whether the traffic will be allowed or denied. This can help you troubleshoot issues with traffic traversing between two endpoints and speed up resolution.
NSG Diagnostic walkthrough
The following sections walk you through the process of using NSG Diagnostic to diagnose security configuration issues in your Azure network using the Azure Portal.
Using The Azure Portal
To use the NSG Diagnostic tool to diagnose security configuration issues for a VM in your Azure network, follow these steps:
Log in to the Azure Portal, type network watcher in the search box, and select it from the list that appears.
In the left pane of the Network Watcher configuration blade, under Network Diagnostic Tools, click NSG Diagnostic. (See Figure 5-30.)
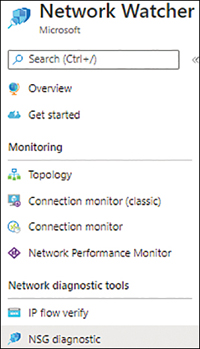
FIGURE 5-30Click NSG Diagnostic.
Enter the following information in the right pane (see Figure 5-31). Then click the Check button:
SubscriptionSelect the subscription containing the source VM—that is, the VM whose security configuration you want to evaluate.
Resource GroupSelect the resource group containing the source VM.
Supported Resource TypesSelect the resource type for analysis.
ResourceSelect the specific VM whose security configuration you want to evaluate.
ProtocolSelect the protocol to analyze, such as TCP, UDP, or ICMP. Alternatively, choose Any to test all protocols.
DirectionSpecify whether you want to evaluate security rules that pertain to inbound traffic or outbound traffic.
Source TypeChoose IPv4 address/CIDR.
IPv4 Address/CIDREnter the source IP address.
Destination IP AddressEnter the destination IP address.
Destination PortEnter the destination port.

FIGURE 5-31Configuring the NSG Diagnostic tool.
NSG Diagnostic analyzes the security configuration to confirm that traffic is allowed (see Figure 5-32) or denied (see Figure 5-33).

FIGURE 5-32Traffic status: Allowed.
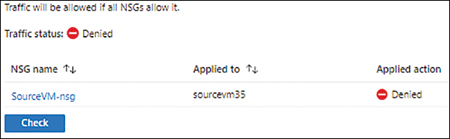
FIGURE 5-33Traffic status: Denied.
Click the NSG name shown in the output to view a detailed log of the traffic flow across all the rules, and the result of each. (See Figure 5-34.)
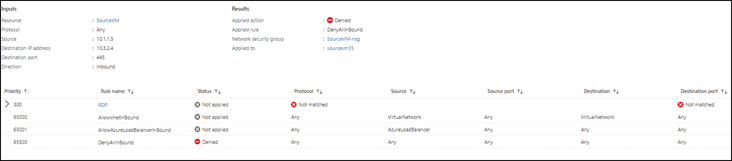
FIGURE 5-34Detailed log showing traffic flow across all the rules and the results of each.
Next Hop
Next Hop identifies the traffic route to a destination endpoint. This can help you pinpoint any traffic-routing issues if, for example, you want traffic to be routed via a virtual network gateway or an appliance instead of being routed incorrectly to the internet gateway.
Next Hop also identifies the route table associated with the endpoint; this route table contains route details regarding a system route or a specific user-defined route.
Next Hop walkthrough
The following sections walk you through the process of using Next Hop to identify the traffic route to a destination endpoint using the Azure Portal.
Using The Azure Portal
To use Next Hop to identify the traffic route to a destination endpoint using the Azure Portal, follow these steps:
Log in to the Azure Portal, type network watcher in the search box, and select it from the list that appears.
In the left pane of the Network Watcher configuration blade, under Network Diagnostic Tools, click Next Hop. (See Figure 5-35.)
Next, in the right pane (see Figure 5-36), enter the following information. Then click Next Hop:
SubscriptionSelect the subscription containing the source VM—that is, the VM that represents the beginning of the traffic route.
Resource GroupSelect the resource group containing the source VM.
Virtual MachineSelect the source VM.
Network InterfaceSelect the network interface on the source VM.
Source IP AddressEnter the source IP address.
Destination IP AddressEnter the destination IP address.
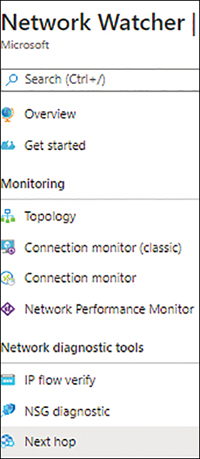
FIGURE 5-35Click Next Hop.
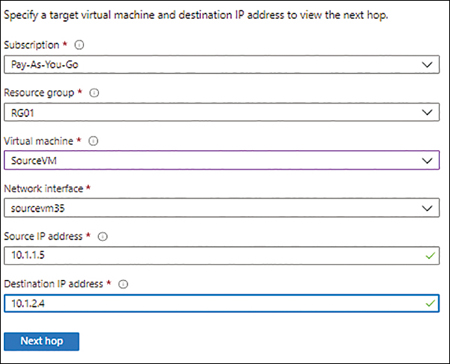
FIGURE 5-36Configuring the Next Hop tool.
Next Hop identifies the traffic route to the destination endpoint and displays the next hop type and the route table that will be applied. (See Figure 5-37.) Note that the next hop type may change, depending on the destination IP address. (See Figure 5-38.)
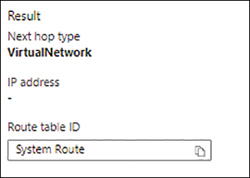
FIGURE 5-37Next Hop output, with the next hop type displayed.
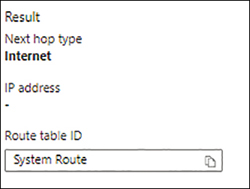
FIGURE 5-38The next hop type may change, depending on the destination address.
Effective Security Rules
You can apply NSGs on the subnet level and the network interface card (NIC) level. When you do, however, security rules can sometimes conflict, causing unwanted traffic restrictions. The Effective Security Rules tool can help you identify all the security rules across all associated NSGs for a specific VM. This can help you identify and address conflicting rules as needed. For each traffic rule identified by Effective Security Rules, you can drill down to clearly identify affected source and destination IP ranges.
Effective Security Rules tool walkthrough
The following sections walk you through the process of using Effective Security Rules to identify conflicting rules using the Azure Portal.
Using The Azure Portal
To use Effective Security Rules to identify conflicting rules, follow these steps:
Log in to the Azure Portal, type network watcher in the search box, and select it from the list that appears.
In the left pane of the Network Watcher configuration blade, under Network Diagnostic Tools, click Effective Security Rules. (See Figure 5-39.)
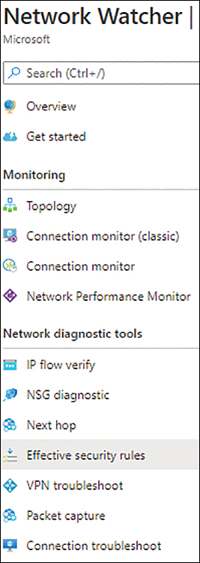
FIGURE 5-39Click Effective Security Rules.
In the right pane (see Figure 5-40), enter the following information. Then click Check:
SubscriptionSelect the subscription containing the source VM—that is, the VM for which you want to check rules across associated NSGs.
Resource GroupSelect the resource group containing the source VM.
Virtual MachineSelect the source VM.
Network InterfaceSelect the NIC for the VM that you want to analyze.

FIGURE 5-40Configuring the Effective Security Rules tool.
Effective Security Rules lists the security rules associated with the NIC. (See Figure 5-41.)

FIGURE 5-41List of NSGs associated with the NIC.
If there are multiple NSGs associated with the NIC, there will be multiple tabs to review. (See Figure 5-42.)
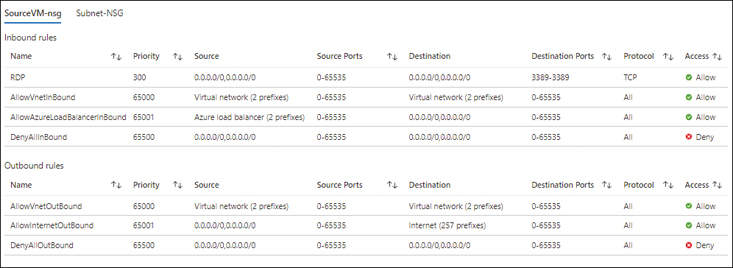
FIGURE 5-42Tabs for each NSG associated with the NIC.
VPN Troubleshoot
You can deploy VPN gateways to connect an Azure environment with an on-premises environment or an external environment hosted in another cloud or another Azure classic subscription. The VPN Troubleshoot enables you to test VPN connections you have established using a VPN gateway in your Azure environment to identify broken or failed connections. For VPN Troubleshoot to work, you must define a storage account in which to store logs for each connection. You can then download the logs from the storage account to analyze the entire traffic exchange and identify the root cause of communication failures.
NoteAt this time, Azure limits you to running only one troubleshooting operation at a time for a single subscription.
VPN Troubleshoot walkthrough
The following sections walk you through the process of using VPN Troubleshoot using the Azure Portal.
Using The Azure Portal
To use VPN Troubleshoot to identify broken or failed VPN connections, follow these steps:
Log in to the Azure Portal, type network watcher in the search box, and select it from the list that appears.
In the left pane of the Network Watcher configuration blade, under Network Diagnostic Tools, click VPN Troubleshoot. (See Figure 5-43.)

FIGURE 5-43Click VPN Troubleshoot.
In the right pane (see Figure 5-44), enter the following information. Then click Check:
SubscriptionSelect the subscription containing the target VPN gateway—that is, the VPN gateway whose connections you want to analyze.
Resource GroupSelect the resource group containing the target VPN gateway.
LocationSelect the location containing the target VPN gateway.

FIGURE 5-44Configuring VPN Troubleshoot.
VPN Troubleshoot detects any VPN gateways in the selected resource group and location shows all the connections for each VPN gateway. (See Figure 5-45.)

FIGURE 5-45List of VPN gateways detected.
Select the VPN gateway whose connections you want to test and click Start Troubleshooting.
When testing is complete, VPN Troubleshoot lists each connection’s status as Healthy or Unhealthy. (See Figure 5-46.) Depending on the connection’s status, you may also see a detailed report explaining the reasons for any issues. (See Figure 5-47.)
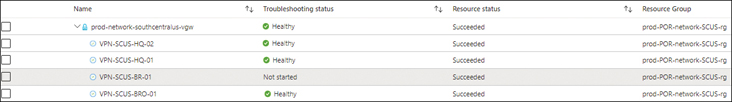
FIGURE 5-46Results of the VPN Troubleshoot test.

FIGURE 5-47Explanation of status.
Packet Capture
There are times when you need to capture traffic requests, or packets—either all packets or specific ones—to and from a VM to analyze traffic patterns, gather network statistics, identify network intrusions, address network communication anomalies or problems, and so on. Packet Capture captures the packets you specify and saves them in an Azure Storage account or your local device for analysis using a SIEM or log-monitoring tool. Packet Capture requires you to define certain parameters to identify the packets that you want to log. These include the following:
The target VM
The log storage location
Maximum bytes per packet
Maximum bytes per session
Time limit (in seconds)
NotePacket Capture requires a VM extension, AzureNetworkWatcherExtension, on both Windows and Linux VMs. You can deploy the extension using Azure PowerShell, the Azure CLI, and JSON templates.
Packet Capture walkthrough
The following sections walk you through the process of using the Packet Capture tool to capture packets using the Azure Portal.
Using The Azure Portal
To use Packet Capture to capture packets using the Azure Portal, follow these steps:
Log in to the Azure Portal, type network watcherin the search box, and select it from the list that appears.
In the left pane of the Network Watcher configuration blade, under Network Diagnostic Tools, click Packet Capture. (See Figure 5-48.)
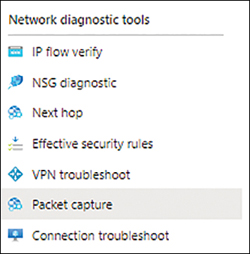
FIGURE 5-48Click Packet Capture.
On the Packet Capture page, click Add. (See Figure 5-49.)
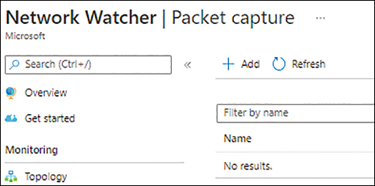
FIGURE 5-49Add a Packet Capture.
On the Add Packet Capture page (see Figure 5-50), enter the following information. Then click Create:
SubscriptionSelect the subscription containing the target VM—that is, the VM whose packets you want to capture.
Resource GroupSelect the resource group containing the target VM.
Target Virtual MachineSelect the target VM.
Packet Capture NameEnter a unique name for the packet-capture operation.
Capture ConfigurationSelect the location to store the output file.
Storage AccountsSelect a storage account to store the output file.
Maximum Bytes Per PacketEnter the maximum bytes size for each packet. In this case, enter 0 to capture all packets.
Maximum Bytes Per SessionEnter the maximum bytes per session that you want to capture. For now, leave this set to the default.
Time LimitSet the time limit in seconds to run the packet-capture operation.
After you create the Packet Capture operation, it will take a few minutes to start running. (See Figure 5-51.)
After the Packet Capture operation has run for some time or is complete, switch to the Azure Portal page for the Azure Storage account where the logs are saved and download them for analysis. (See Figure 5-52.)

FIGURE 5-50Configuring Packet Capture.

FIGURE 5-51Packet Capture creation.
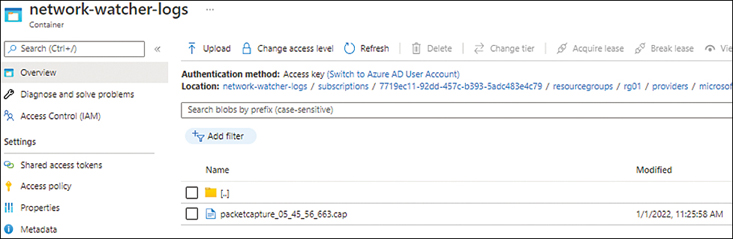
FIGURE 5-52Packet Capture results.
Click the log file you want to download and click the Download option.
Connection Troubleshoot
You can use Connection Troubleshoot to test direct TCP or ICMP connections from an Azure VM, application gateway, or Bastion host to another Azure VM, FQDN, URI, or IPv4 endpoint. In addition to analyzing connections, Connection Troubleshoot provides specific fault information after analysis, such as the following:
High CPU utilization
High memory utilization
Traffic blocked due to incorrect guest VM firewall configuration
DNS name-resolution issues
Traffic blocked due to an NSG rule, along with the rule name
Traffic dropped due to system-defined (the default) or user-defined routing
By providing clarity on the root cause of connection issues, Connection Troubleshoot enables you to address issues more quickly.
Unlike Connection Monitor, Connection Troubleshoot provides point-in-time information about ongoing issues, and should be used in such scenarios rather than for historical tracking.
NoteWhen the source is an Azure VM, whether on Windows or Linux, you must deploy the AzureNetworkWatcherExtension Virtual Machine extension to allow Connection Troubleshoot to access the VM for testing.
Connection Troubleshoot walkthrough
The following sections walk you through the process of running Connection Troubleshoot to test connections using the Azure Portal.
Using The Azure Portal
To use Connection Troubleshoot to test connections using the Azure Portal, follow these steps:
Log in to the Azure Portal, type network watcherin the search box, and select it from the list that appears.
In the left pane of the Network Watcher configuration blade, under Network Diagnostic Tools, click Connection Troubleshoot. (See Figure 5-53.)

FIGURE 5-53Click Connection Troubleshoot.
In the right pane (see Figure 5-54), enter the following information. Then click Check:
SubscriptionSelect the subscription containing the source resource—that is, the resource whose outgoing connections you want to analyze.
Resource GroupSelect the resource group containing the source resource.
Source TypeSelect the source type—in this example, Virtual Machine.
Virtual MachineSelect the VM whose outgoing connections you want to analyze.
DestinationSelect the Select a Virtual Machine option button or the Specify Manually option button. In this case, choose Select a Virtual Machine.
This enables you to specify a VM (rather than an FQDN, URI, or IPv4) endpoint as the connection destination. The options change based on the destination resource type that you select.
Resource GroupSelect the resource group containing the destination VM.
Virtual MachineSelect the destination VM.
Probe Settings: Preferred IP VersionChoose from IPv4, IPv6, or Both.
ProtocolSelect TCP or ICMP.
Destination PortEnter the destination port to use for testing.

FIGURE 5-54Configuring Connection Troubleshoot.
When Connection Troubleshoot finishes analyzing the connection, it displays the results, indicating whether the destination is reachable (see Figure 5-55) or unreachable (see Figure 5-56). Depending on the result, you might see the next hop address, topology view, or failure details to pinpoint the reasons for any failures.
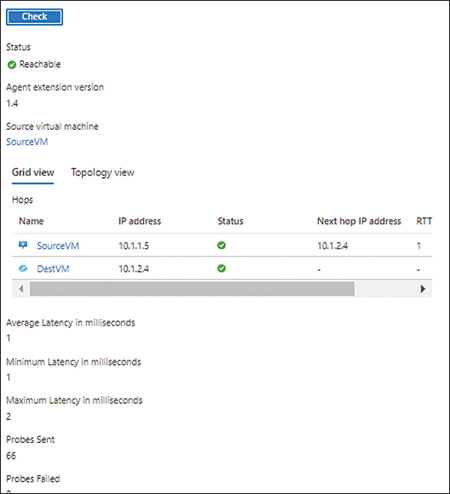
FIGURE 5-55The destination VM is reachable.

FIGURE 5-56The destination VM is unreachable.
NSG Flow Logs
Companies must be aware of ongoing intrusions, compromised security backdoors, and network-performance bottlenecks that could seriously hamper their environment and performance. Being able to address these issues in a competent manner, whether proactively or reactively, is critical.
Azure Network Watcher includes NSG Flow Logs, which record information about network traffic flowing through a subnet or all NSGs within an environment. You can analyze this log data using visualization tools (like Power BI), SIEM tools, or IDS to identify performance bottlenecks, intrusions, and compromised systems.
NoteNSG Flow Logs are important for compliance reasons. They can help you verify that traffic within a network is isolated as needed and adheres to your enterprise’s compliance policies and guidelines.
NSG Flow Logs work on the Transport layer of the OSI model to collect logs at 1-minute intervals. These logs contain detailed information about traffic passing through targeted NSGs, including the protocol, source IP, source port, destination IP, destination port, NIC details, traffic decisions to allow or deny packets, and throughput information. You can retain these logs for up to one year using Azure General Purpose v2 storage accounts.
It is highly recommended to enable NSG Flow Logs on all NSGs applied to subnets or VMs that host critical workloads. NSG Flow Logs do not affect the network performance of your workload because they gather logging information from the Azure platform without directly interacting with the traffic going to your workload.
NoteNSG Flow Logs truncate long filenames, which makes it hard to correlate events because the log information does not exactly match your environment. To prevent this, keep NSG names to fewer than 80 characters.
NSG Flow Logs walkthrough
The following sections walk you through the process of using NSG Flow Logs to record network traffic flowing through a subnet or NSG using the Azure Portal.
Using The Azure Portal
To use NSG Flow Logs to record network traffic using the Azure Portal, follow these steps:
Log in to the Azure Portal, type network watcher in the search box, and select it from the list that appears.
In the left pane of the Network Watcher configuration blade, under Logs, click NSG Flow Logs. (See Figure 5-57.)
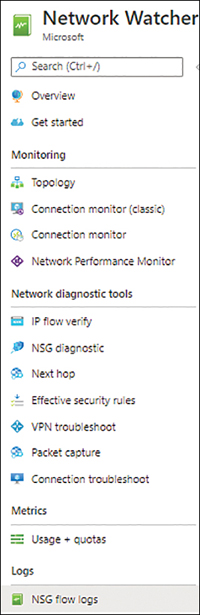
FIGURE 5-57Click NSG Flow Logs.
Click the Create button above the pane on the right. (See Figure 5-58.)
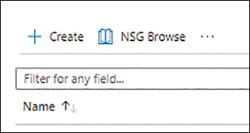
FIGURE 5-58Create a Flow Log.
In the Basics tab of the Create a Flow Log wizard (see Figure 5-59), enter the following information and click Next:
SubscriptionSelect the subscription containing the NSG whose traffic you want to monitor.
Network Security GroupSelect the NSG to whose traffic you want to monitor.
Flow Log NameEnter a unique name for the Flow Log.
Select Storage Account LocationSelect the location for the storage account where you will store the Flow Log.
SubscriptionSelect the subscription for the storage account.
Storage AccountsSelect the storage account you want to use to store the Flow Log.
RetentionSpecify how long the Flow Log should be retained. The maximum retention is 365 days.

FIGURE 5-59The Basics tab of the Create a Flow Log wizard.
In the Configuration tab (see Figure 5-60), leave the default settings as is, and click Next.
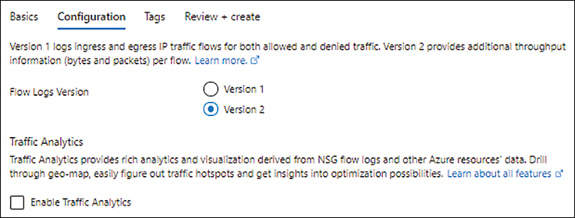
FIGURE 5-60The Configuration tab of the Create a Flow Log wizard.
In the Tags tab (see Figure 5-61), add any tags you want to apply to the Flow Log. Then click Next.

FIGURE 5-61The Tags tab of the Create a Flow Log wizard.
In the Review + Create tab (see Figure 5-62), check your settings. Then click Create.

FIGURE 5-62The Review + Create tab of the Create a Flow Log wizard.
When the Flow Log has been created, you’ll see it listed, with a status of Enabled. (See Figure 5-63.)

FIGURE 5-63Flow Log status.
After giving the Flow Log a chance to monitor traffic for some time, open the page for the Azure Storage account where you saved the Flow Log. (See Figure 5-64.) From there, you can download the Flow Log for further analysis.

FIGURE 5-64Download the Flow Log for analysis.
Diagnostic Logs
The Diagnostic Logs tool provides a single pane of glass for you to easily enable or disable diagnostic logging on all network resources within a subscription, including VM NICs, application gateways, NSGs, and so on. You can store the resulting logs in an Azure Storage account, stream it to an Event hub, or send it to a Log Analytics workspace for deeper analysis. You can use tools such as Power BI to analyze logs stored in an Azure storage account.
Diagnostic Logs walkthrough
The following sections walk you through the process of using the Diagnostic Logs tool, which you can use to enable or disable diagnostic logging on network resources using the Azure Portal.
Using The Azure Portal
To use the Diagnostic Logs tool to enable or disable diagnostic logging on network resources using the Azure Portal, follow these steps:
Log in to the Azure Portal, type network watcher in the search box, and select it from the list that appears.
In the left pane of the Network Watcher configuration blade, under Logs, click Diagnostic Logs. (See Figure 5-65.)

FIGURE 5-65Diagnostic logs in Network Watcher service.
Using the drop-down lists in the right pane (see Figure 5-66), enter the following information to filter down to the required resources:
SubscriptionSelect the subscription containing the network resource for which you want to generate diagnostic logs.
Resource GroupSelect the resource group containing the network resource for which you want to generate diagnostic logs.
Resource TypeSelect the type of resource for which you want to generate diagnostic logs.
ResourceSelect the resource for which you want to generate diagnostic logs.

FIGURE 5-66Configuring the Diagnostic Log tool.
The page refreshes and shows a list of all the NICs, NSGs, and public IP addresses it finds. (See Figure 5-67.) In this case, diagnostics are disabled for each resource.

FIGURE 5-67Lists of all NICs, NSGs, and public IP addresses.
To enable diagnostic logging for a resource, click the resource in the list.
In the Diagnostic Settings page for the resource you selected, click the Add Diagnostic Setting link. (See Figure 5-68.)
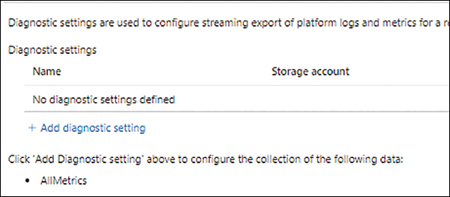
FIGURE 5-68Add diagnostic setting.
In the Diagnostic Setting dialog box (see Figure 5-69), enter the following information. Then click Save:
Diagnostic Setting NameEnter a unique name for the diagnostic setting.
MetricsTo log all metrics for the resource, select the All Metrics check box. Alternatively, you can choose specific metrics as needed.
RetentionEnter a retention period. For permanent retention, enter 0.
Destination DetailsSelect a destination option—in this case, Archive to a Storage Account. (Notice that when you choose this option, additional settings appear, enabling you to choose the storage account and subscription.)
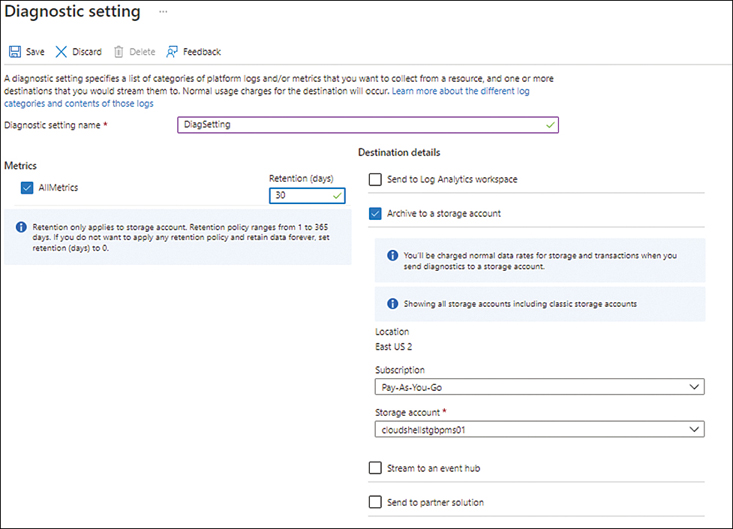
FIGURE 5-69Configuring the Diagnostic Logs tool.
Switch back to the list of diagnostic settings and notice that the status for the resource you just changed is listed as Enabled. (See Figure 5-70.)
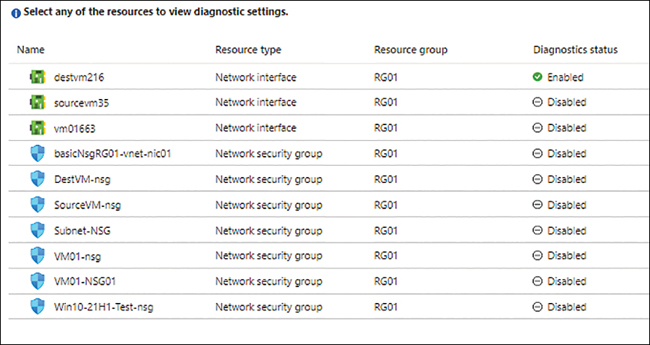
FIGURE 5-70Diagnostics for the resource are enabled.
Optionally, repeat this walkthrough to enable diagnostics for other resources as required.