Chapter 2 Introduction to Azure Security Center
Given the threat landscape presented in Chapter 1, it is clear that there is a need for a system that can both unify security management and provide advanced threat protection for workloads running in Azure, on-premises, and on other cloud providers.
Azure Security Center gives organizations complete visibility and control over the security of hybrid cloud workloads, including compute, network, storage, and application workloads. By actively monitoring these workloads, Security Center reduces the exposure of resources to threats. Security Center also uses intelligent threat detection to assist you in protecting your environment from rapidly evolving cyberattacks.
Security Center does more than detect threats. It also assesses the security of your hybrid cloud workload and provides recommendations to mitigate threats. And it provides centralized policy management to ensure compliance with company or regulatory security requirements.
In this chapter, you will learn how you can use Security Center in your security operations, key considerations for adoption, and how to onboard resources.
Understanding Security Center
Because Security Center is an Azure service, you must have an Azure subscription to use it—even if it’s just a trial subscription.
Having an Azure subscription automatically enables the free tier of Security Center. This free tier monitors compute, network, storage, and application resources in Azure. It also provides security policy, security assessment, security recommendations, and the ability to connect with other security partner solutions. Organizations that are getting started with Infrastructure as a Service (IaaS) in Azure can benefit even from this free service because it will improve their security posture.
In addition to the free tier, Security Center offers a fee-based standard tier. This tier offers a complete set of security capabilities for organizations that need more control. Specifically, migrating your Security Center subscription from the free tier to the standard tier enables the following features:
![]() Security event collection and advanced search
Security event collection and advanced search
![]() Just-in-time VM access
Just-in-time VM access
![]() Adaptive application controls (application whitelisting)
Adaptive application controls (application whitelisting)
![]() Built-in and custom alerts
Built-in and custom alerts
![]() Threat intelligence
Threat intelligence
Another advantage of the standard tier is that it enables you to monitor on-premises resources, VMs hosted by other cloud providers, and even nested VMs running in Azure. You achieve this by manually installing the Security Center agent in the target machine. (This is covered in more detail later in this chapter.)
When you upgrade to the standard tier, you can use it free for 60 days. This is a good opportunity to evaluate these features, see how your current environment will benefit from them, and decide whether they’re worth the investment. For the latest information about Azure Security Center pricing, visit http://aka.ms/ascpricing.
NOTE
From here on out, this book assumes you are using the standard tier of Security Center.
Security Center architecture
When you use Security Center to monitor resources in Azure, on-premises, and hosted by other cloud providers (such as Amazon AWS), the architecture looks similar to Figure 2-1.
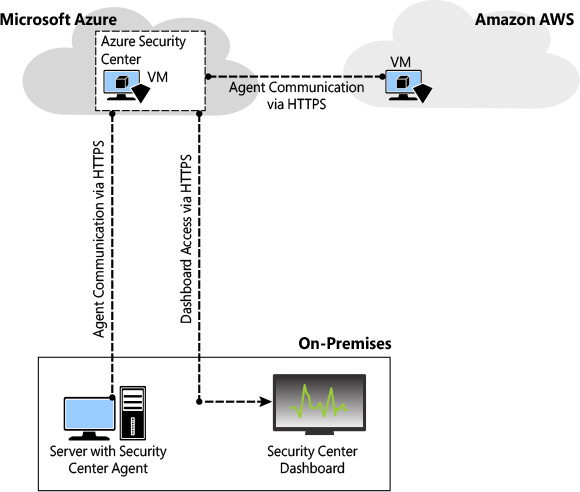
Security Center uses the Microsoft Monitoring Agent, which is the same agent used by Operations Management Suite and the Log Analytics service. In Windows systems, Security Center installs the Microsoft Monitoring Agent (HealthService.exe). In Linux systems, Security Center creates the omsagent daemon, which runs under the omsagent account. This account is automatically created during agent installation.
Microsoft Monitoring Agent scans for various security-related configurations and events in Event Tracing for Windows (ETW) traces. In addition, this agent collects the following:
![]() Operating system logs, such as Windows events
Operating system logs, such as Windows events
![]() Operating system type and version
Operating system type and version
![]() Running processes
Running processes
![]() Machine name
Machine name
![]() IP addresses
IP addresses
![]() Logged-in user (username)
Logged-in user (username)
![]() Tenant ID
Tenant ID
![]() User mode crash dump created by Windows Error Reporting (WER)
User mode crash dump created by Windows Error Reporting (WER)
This information is sent to your workspace, which is an Azure resource used as a container to store your data. A workspace provides a geographic location for data storage, granularity for billing, and data isolation, and it helps you to better scope the configuration.
If you are using Azure Log Analytics, you already have a workspace. This workspace will be used by Security Center to store data coming from the agent. If you are not using Azure Log Analytics, a new workspace will be automatically created when you start using Security Center. The location of the workspace created by Security Center is based on the location of the VM, as follows:
![]() For VMs in the United States, Brazil, and Canada, the workspace location is the United States.
For VMs in the United States, Brazil, and Canada, the workspace location is the United States.
![]() For VMs in Europe and the United Kingdom, the workspace location is Europe.
For VMs in Europe and the United Kingdom, the workspace location is Europe.
![]() For VMs in the Asia-Pacific region, Japan, and India, the workspace location is Asia Pacific.
For VMs in the Asia-Pacific region, Japan, and India, the workspace location is Asia Pacific.
![]() For VMs in Australia, the workspace location is Australia.
For VMs in Australia, the workspace location is Australia.
If you are a global company and you need to store data in specific regions for data sovereignty or compliance reasons, you might consider creating multiple workspaces. Another scenario that might call for multiple workspaces is if you want to isolate various users. For example, you might want each customer, department, or business group to see their own data but not the data for others.
TIP
You need use Log Analytics to create multiple workspaces. For help performing this operation, read this article: https://aka.ms/ascworkspaces.
Figure 2-2 shows the core Security Center architecture and how these pieces come together and communicate. In this example, non-Azure machines and Azure VMs send data collected by the agent to the workspace. Security Center uses this data for advanced threat detection analysis and generates recommendations that fit within the prevention module or issues alerts that are part of the detection module. Security Center employs advanced security analytics, a method that is far more powerful than the traditional signature-based approach.
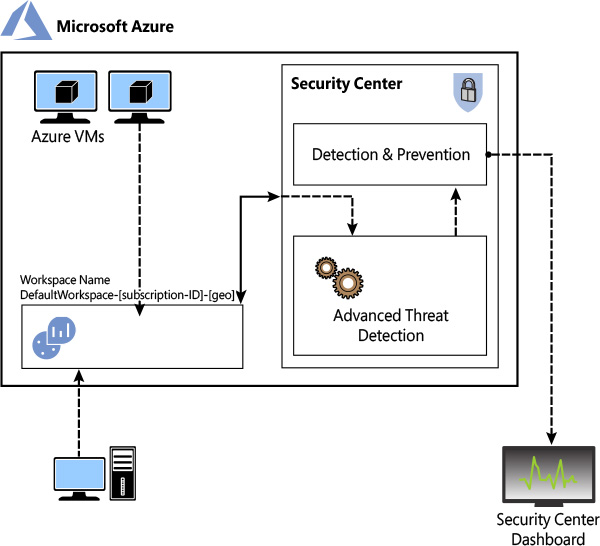
Security Center uses machine-learning technologies to evaluate all relevant events across the entire cloud fabric. By using this approach, Security Center can detect threats that would be impossible to identify using manual approaches and can predict the evolution of attacks. Security Center uses the following analytics:
![]() Integrated threat intelligence This leverages global threat intelligence from Microsoft to look for known bad actors. (You will learn more about this in Chapter 9.)
Integrated threat intelligence This leverages global threat intelligence from Microsoft to look for known bad actors. (You will learn more about this in Chapter 9.)
![]() Behavioral analytics This looks for known patterns and malicious behaviors—for example, a process executed in a suspicious manner, hidden malware, an exploitation attempt, or the execution of a malicious PowerShell script.
Behavioral analytics This looks for known patterns and malicious behaviors—for example, a process executed in a suspicious manner, hidden malware, an exploitation attempt, or the execution of a malicious PowerShell script.
![]() Anomaly detection This uses statistical profiling to build a historical baseline and triggers an alert based on deviations from this baseline. An example of this is would be a VM that normally receives remote desktop connections five times a day but suddenly receives 100 connection attempts. This deviation would trigger an alert.
Anomaly detection This uses statistical profiling to build a historical baseline and triggers an alert based on deviations from this baseline. An example of this is would be a VM that normally receives remote desktop connections five times a day but suddenly receives 100 connection attempts. This deviation would trigger an alert.
TIP
Read more about Security Center detection capabilities and other relevant sce-narios at https://aka.ms/ascdetections.
Security Center dashboard
To access the Security Center dashboard, sign in to Azure Portal (https://portal.azure.com) and click Security Center in the left pane. What happens the first time you open the Security Center dashboard may vary. For the purposes of this example, the dashboard is fully populated with resources, recommendations, and alerts, as shown in Figure 2-3.
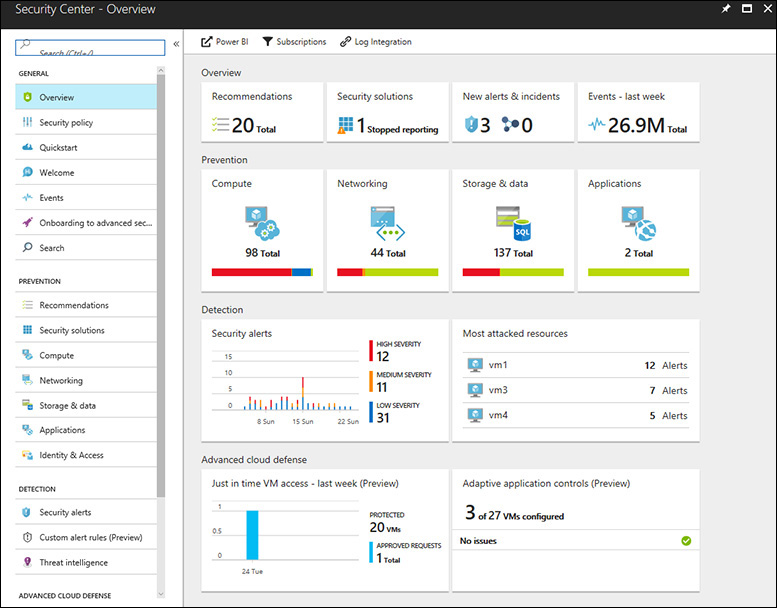
As shown in Figure 2-3, the left side of the Security Center dashboard offers access to four main groups of data relating to your workspace:
![]() General You use the links in the General group to see information about your daily activities, to onboard non-Azure machines, and to search for alerts or events.
General You use the links in the General group to see information about your daily activities, to onboard non-Azure machines, and to search for alerts or events.
![]() Prevention The links in this group offer access options to enhance your security posture. You can view a security assessment of your resources, connect with security solutions, and monitor your identity access activities.
Prevention The links in this group offer access options to enhance your security posture. You can view a security assessment of your resources, connect with security solutions, and monitor your identity access activities.
![]() Detection You use these options to investigate security issues and for incident-response purposes. You can also access tools for creating custom alerts and view threat-intelligence information relevant to your environment.
Detection You use these options to investigate security issues and for incident-response purposes. You can also access tools for creating custom alerts and view threat-intelligence information relevant to your environment.
![]() Advanced Cloud Defense The links in this group provide access to tools that enable you to further protect your VMs and whitelist your applications.
Advanced Cloud Defense The links in this group provide access to tools that enable you to further protect your VMs and whitelist your applications.
TIP
All these options will be covered throughout this book. For now, just browse through them to familiarize yourself with them.
Considerations before adoption
As you plan your adoption of Security Center, you’ll want to address the following:
![]() Role-based access control (RBAC)
Role-based access control (RBAC)
![]() Security policy
Security policy
![]() Storage
Storage
![]() Recommendations
Recommendations
Role-based access control
One consideration you should consider before adoption is who should have access to the tool. Depending on the size and structure of your organization, multiple individuals and teams may use Security Center to perform different security-related tasks. Security Center uses role-based access control (RBAC) to determine who can do what.
By default, Security Center offers two roles:
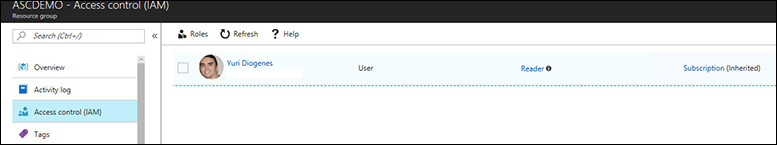
![]() Security reader This role is for all users who need read access only to the dashboard—for example, security operations personnel who need to monitor and respond to security alerts. You assign this role at the Azure level, in the resource group that Security Center is monitoring, via the Access Control (IAM) screen shown in Figure 2-4.
Security reader This role is for all users who need read access only to the dashboard—for example, security operations personnel who need to monitor and respond to security alerts. You assign this role at the Azure level, in the resource group that Security Center is monitoring, via the Access Control (IAM) screen shown in Figure 2-4.
![]() Security admin This role is for workload owners who manage the workload of a particular cloud and its related resources and who are responsible for implementing and maintaining protections in accordance with company security policy.
Security admin This role is for workload owners who manage the workload of a particular cloud and its related resources and who are responsible for implementing and maintaining protections in accordance with company security policy.
IMPORTANT
Only subscription owners or contributors and security admins can edit a security policy. Only subscription and resource group owners and contributors can apply security recommendations for a resource. For more on RBAC in Azure, see http://aka.ms/azurerbac.
Security policy
Security Center uses security policies to define the configuration of your workloads. This helps to ensure compliance with company security requirements, regulatory security requirements, or both. You can define policies for your Azure subscriptions that can be personalized to the type of workload or the level of data sensitivity. As you plan your adoption of Security Center, you must identify what needs to be monitored and determine whether the default policy provided by Security Center will be adequate or if you need to create new definitions. Chapter 3 discusses security policies in more detail.
Storage
You’ll need to consider your storage needs before adopting Security Center. As noted, the agent collects information and sends it to the workspace. If you are using the standard tier, you have as much as 500 MB of storage space per day across all nodes. For example, if you are monitoring five VMs in Azure and five computers on-premises, 500 MB per day will be spread across all ten of these resources. If the uploaded data surpasses 500 MB per day, additional charges will apply.
IMPORTANT
Workspaces created by Security Center retain data for 30 days. For existing workspaces, retention is based on the workspace pricing tier.
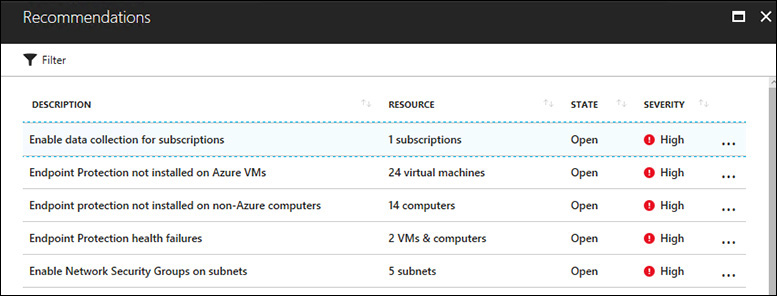
Recommendations
Security Center identifies compute, network, storage, and application resources with security issues and offers recommendations to fix them. To view a list of all security recommendations, click the Overview link on the left side of the Security Center dashboard and click the Recommendations option on the Overview screen. This opens the Recommendations screen, shown in Figure 2-5. Alternatively, you can view recommendations individually by category. You can use Security Center’s severity rating to decide which recommendations to address first. Before you adopt Security Center, you should fully address all existing recommendations. Although this is not a prerequisite, it is a good practice.
Incorporating Security Center into your security operations
It’s critical that your IT security and IT operations departments constantly collaborate to provide better protection, detection, and response. Security operations (SecOps) describes this support function. Many organizations already have a SecOps team dedicated to maintaining the security operations of company assets.
Before using Security Center to monitor resources, you must review your organization’s SecOps process and identify how you can incorporate Security Center into your routine. Figure 2-6 shows the tasks performed by a typical security operations center (SOC) and which Security Center features can be used to assist with these tasks.
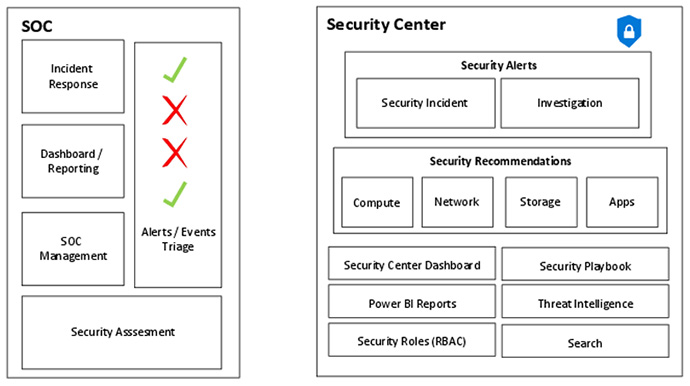
Here are a few key points for incorporating Security Center into your security operations:
![]() Security Center will continuously evaluate compute, network, storage, and application resources for compliance. The team responsible for ongoing security assessment should track and apply recommendations issued by Security Center on an ongoing basis.
Security Center will continuously evaluate compute, network, storage, and application resources for compliance. The team responsible for ongoing security assessment should track and apply recommendations issued by Security Center on an ongoing basis.
![]() The security roles available in Security Center, along with Azure’s RBAC capability, can help SOC management control who has access to what.
The security roles available in Security Center, along with Azure’s RBAC capability, can help SOC management control who has access to what.
![]() Security Center can integrate with Power BI to create reports and graphs when more detailed analysis is needed.
Security Center can integrate with Power BI to create reports and graphs when more detailed analysis is needed.
![]() The incident response (IR) team can use security alerts and incident features during the detection and triage phases of an attack to conduct early assessments of the incident. If more in-depth research on an attack is needed, the team can use Security Center’s investigation and search features. Finally, when the team is ready to respond, it can use the Security Playbook feature to customize a response to a certain alert.
The incident response (IR) team can use security alerts and incident features during the detection and triage phases of an attack to conduct early assessments of the incident. If more in-depth research on an attack is needed, the team can use Security Center’s investigation and search features. Finally, when the team is ready to respond, it can use the Security Playbook feature to customize a response to a certain alert.
IMPORTANT
A security assessment conducted on VMs will also look for the presence of a security configuration based on Common Configuration Enumeration (CCE) rules. To download these rules, visit https://aka.ms/ascccerules.
Onboarding resources
Now that you have learned how Security Center works and identified your needs, it’s time to onboard resources. As explained, VMs located in Azure will be provisioned automatically. That is, the monitoring agent will be installed by default. To onboard non-Azure computers or VMs, follow these steps:
Open Azure Portal and sign in as a user who has Security Admin privileges.
In the left pane, click Security Center. The Security Center dashboard opens.
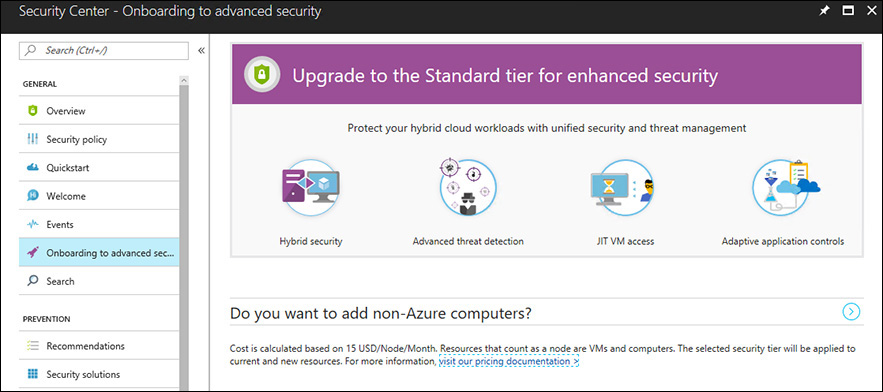
In the left pane of the dashboard, under General, click Onboarding to Advanced Security. A screen like the one in Figure 2-7 appears.
Next to the Do You Want to Add Non-Azure Computers? text, click the right arrow. The Add New Non-Azure Computers page appears. (See Figure 2-8.)
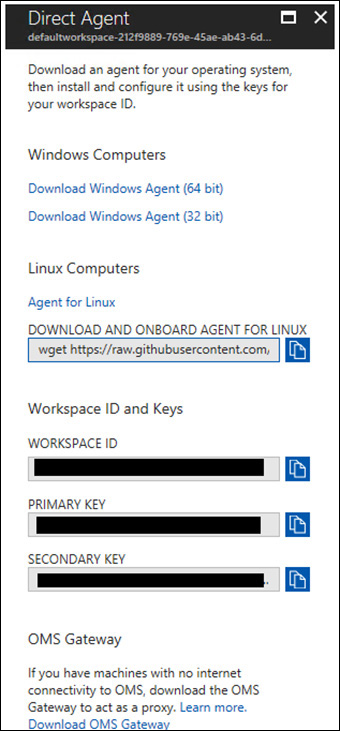
If you have multiple workspaces, click the +Add Computers button next to the workspace to which you want to bind your non-Azure computer. The Direct Agent blade opens. (See Figure 2-9.)
In the Direct Agent blade, click the link for the appropriate Windows agent (64-bit or 32-bit).
IMPORTANT
If you are installing Security Center on a Linux operating system, click the Agent for Linux link. See https://aka.ms/ASCLinuxAgent for more on installing Linux agents.
Copy the workspace ID and primary key values to the clipboard. You will need these values when you install the agent in the target system.
When the download is complete, close the Security Center dashboard (that is, close your browser).
Copy the agent installation file to a shared network location where the client can access it.
For this example, the agent will be installed on a Windows Server 2012 R2 computer located on-premises. However, the same procedures apply to a non-Azure VM located in the cloud.
Log on to the target system.
Double click the MMASetup-AMD64.exe file.
If the Open File–Security Warning dialog box appears, click Run.
If the User Access Control dialog box appears, click Yes.
In the Welcome to the Microsoft Monitoring Agent Setup Wizard page, click Next.
Read the Microsoft license terms and click I Agree.
In the Destination Folder page of the setup wizard, leave the default selection and click Next. The Agent Setup Options page appears. (See Figure 2-10.)
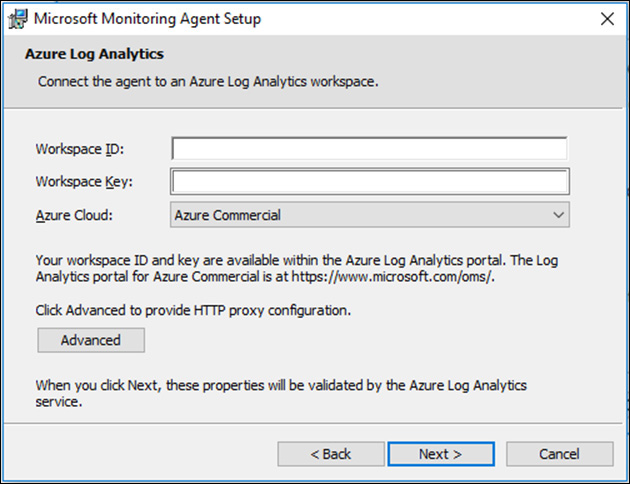
Select the Connect the Agent to Azure Log Analytics (OMS) check box, as shown in Figure 2-10, and click Next. The Azure Log Analytics page opens. (See Figure 2-11.)
Enter the workspace ID you copied in step 7 in the Workspace ID box.
Enter the primary key you copied in step 7 in the Workspace Key box.
If this computer is behind a proxy server, click the Advanced button and provide the proxy URL and authentication in the dialog box that appears. Then click OK.
Back in the Azure Log Analytics page, click Next. The Microsoft Update page opens.
Select Use Microsoft Update for Updates (Recommended) and click Next.
In the Ready to Install page, review the summary field and click Install. The Installing the Microsoft Monitoring Agent page shows the progress of the installation.
When the installation is finished, the Microsoft Monitoring Agent Configuration Completed Successfully page opens. Click Finish.


You can also perform this installation using the command-line interface (CLI) as follows:
MMASetup-AMD64.exe /Q:A /R:N /C:"setup.exe /qn ADD_OPINSIGHTS_WORKSPACE=1 OPINSIGHTS_WORKSPACE_AZURE_CLOUD_TYPE=0 OPINSIGHTS_WORKSPACE_ID=<yourworkspaceID> OPINSIGHTS_WORKSPACE_KEY=<yourworkspaceprimarykey> AcceptEndUserLicenseAgreement=1"
IMPORTANT
The /C switch in this example uses IExpress as its self-extractor. For more information about IExpress, see https://support.microsoft.com/en-us/help/262841/command-line-switches-for-windows-software-update-packages.
Most of the parameters in the agent installation are self-explanatory. The only one that may not fully resonate at first sight is OPINSIGHTS_WORKSPACE_AZURE_CLOUD_TYPE. This is the cloud environment specification. The default is 0, which represents the Azure commercial cloud. Set this to 1 only if you are installing the agent in an Azure Government cloud.
IMPORTANT
For help performing the agent installation using Azure Automation and PowerShell, see https://aka.ms/ASCWindowsAgent.
It can take some time for this new non-Azure computer to appear in Security Center. Still, you can validate the connectivity between this computer and the workspace by using the TestCloudConnection tool. Here’s how:
On the target computer, open the command prompt and navigate to the Program FilesMicrosoft Monitoring AgentAgent folder.
Run the
TestCloudConnection.execommand. If connectivity is working properly, you should see all tests followed by this message:Connectivity test passed for all hosts for workspace id <workspace id>
Initial assessment
Chapter 4 covers the full spectrum of compute recommendations. Until then, you can follow these steps to view the initial security assessment for this new computer:
Open Azure Portal and sign in as a user with security admin privileges.
In the left pane, click Security Center. The Security Center dashboard opens.
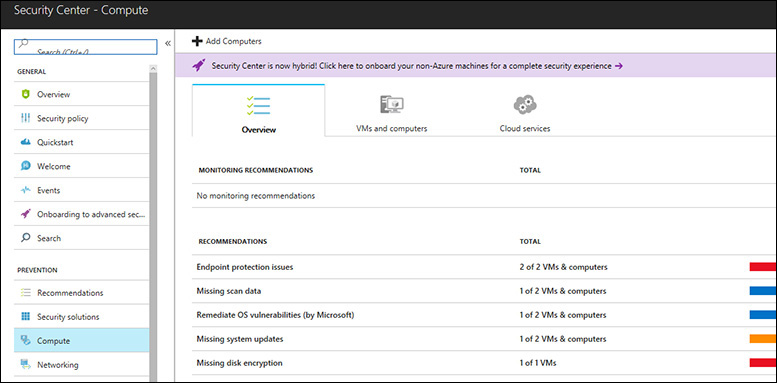
In the left pane of the dashboard, under Prevention, click Compute. A page like the one in Figure 2-12 appears.
The Overview tab summarizes the current recommendations for VMs and computers, notes the number of VMs and computers to which each recommendation applies, and notes the severity of the issues that have prompted the recommendations.
Click the VM and Computers tab to see a list of individual computers and VMs and their status with regard to recommendations. (See Figure 2-13.) This list-color codes the status of each VM or machine as follows:
 Green This means no action is needed. Yellow This indicates a medium-priority recommendation. Red This denotes a high-priority recommendation, which must be addressed as soon as possible. Blue This is informational only.
Notice, too, that the computer icons to the left feature different colors. The purple computer (ARGOS) is a non-Azure computer, while the blue computer (ASCDEMOVM) is an Azure VM.
After you review this initial assessment, close the dashboard.