
8
Track progress: Basic techniques
In this chapter
Up to this point, you have focused on project planning—developing and communicating the details of a plan before actual work begins. When work begins, so does the next phase of project management: tracking progress. Tracking means recording details such as who did what work, when the work was done, and what the cost was. These details are often called actuals. As you start tracking actuals on tasks, several things happen. As you record progress on a task, Project Online desktop client calculates actual and remaining cost, work, and duration values. These updated values are rolled up to their summary tasks. Such changes result from Project dynamically recalculating the plan.
This chapter guides you through procedures related to saving a baseline of your plan, tracking a plan as scheduled, entering a task’s completion percentage, and entering actual values for tasks.
Understand progress tracking
Tracking actuals is essential to properly managing a project, which goes beyond just planning it. The project manager must know how well the team is performing and when to take corrective action. When you properly track project performance and compare it with the original plan (as saved in a baseline), you can answer such questions as the following:
Are tasks starting and finishing as planned? If not, what is the impact on the project’s finish date?
Are resources spending more or less time than planned to complete tasks?
Are higher-than-anticipated task costs driving up the overall cost of the project?
When planning similar projects in the future, will you be able to determine how good your (or the team’s) estimating skills were in earlier projects?
Project supports several ways to track progress. When you choose a tracking method, think about the level of detail or control you, your project sponsor, and other stakeholders require. Tracking the fine details of a project requires additional work from you and possibly also the resources working on the project. Therefore, before you begin tracking progress, you’ll want to determine the level of detail you need.
Project offers the following levels of tracking detail, ordered from simplest to most comprehensive:
Record project work as scheduled. This level works best if everything in the project occurs exactly as planned.
Record each task’s percentage of completion, either at precise values or at preset increments, such as 25, 50, 75, and 100 percent.
Record the actual start and finish dates and the actual and remaining work and duration values for each task or assignment.
Track assignment-level work by time period. This is the most detailed level of tracking. Here you record actual work values per day, per week, or at some other interval. (Chapter 14, “Track progress: Detailed techniques,” addresses this level of detail.)
Because different portions of a project sometimes have different tracking needs, you might need to apply a combination of these approaches within a single plan. For example, you might want to track high-risk tasks more closely than low-risk tasks.
Save a baseline of your plan
After you develop a plan, one of your most important activities as a project manager is to record actuals and evaluate project performance. As you record actuals or update your plan, the scheduled plan will likely change. Keeping track of the plan in its original state becomes more difficult.
A task’s start, finish, and duration values describe the current “as scheduled” state of that task. As you enter Actual Start and Actual Finish dates, the Start, Finish, and Duration fields update to reflect the current state of that task.
To judge project performance properly, compare the performance with your original plan, called the baseline plan (or just the baseline). Saving a baseline captures the original scheduled start, finish, and duration values in addition to the work and cost values per task, resource, and assignment. The baseline also includes the work and cost values distributed over time (called timephased values, which you’ll work with in Chapter 14). Use the baseline for later comparison when you look at what you thought would happen and what actually happened.
When you save a baseline, Project takes a snapshot of the existing values and saves it in your plan for future comparison. You’ll want to save a baseline in these situations:
You have developed the plan as fully as possible. (You can still add tasks, resources, or assignments to the plan after work has started—this is often unavoidable.)
You have not yet started entering actual values, such as a task’s percentage of completion.
You want to save a subsequent baseline (up to 11 per plan).
The specific values saved in a baseline include several task, resource, and assignment fields, in addition to timephased fields.
Task Fields | Resource Fields | Assignment Fields |
|---|---|---|
Start | Work and timephased work | Start |
Finish | Cost and timephased cost | Finish |
Duration |
| Work and timephased work |
Work and timephased work |
| Cost and timephased cost |
Cost and timephased cost |
|
|
Project supports up to 11 baselines in a single plan. The first one is called Baseline, and the rest are Baseline 1 through Baseline 10. Saving multiple baselines can be useful for projects with especially long planning phases, when you might want to compare different sets of baseline values. For example, you might want to save and compare the baseline plans every month as the planning details change, or you might want to save a new baseline at various points during project execution. For example, you might save Baseline before work starts, save Baseline 1 six months after work starts, save Baseline 2 twelve months after work starts, and so on. You can then view the various baselines and compare them to the actual schedule throughout the project’s duration.
One great way to see tasks’ scheduled and baseline values side by side for easy comparison is in the Variance table, as shown in Figure 8-1.

FIGURE 8-1 Displaying the Variance table is a great way to compare tasks’ scheduled and baseline values.
For example, consider a plan in which the Start and Finish dates are the “as scheduled” dates. These might differ from the Baseline Start and Finish dates either because of the variance caused by actuals that did not match the baseline dates or because of other schedule adjustments that the project manager made.
Project includes several built-in views that compare the current schedule to the baseline—notably, the Tracking Gantt view, which Chapter 14 describes. You can also modify the Gantt Chart view to include baseline Gantt bars. A baseline Gantt bar represents a task’s baseline start, finish, and duration values on the chart portion of a Gantt chart view.
To save a baseline
On the Project tab, in the Schedule group, select Set Baseline and then select Set Baseline.
As Figure 8-2 shows, the Set Baseline dialog opens.
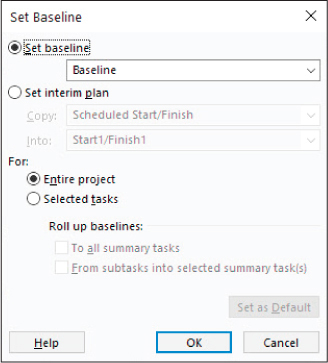
FIGURE 8-2 In the Set Baseline dialog, you can save or update up to 11 baselines per plan.
 Tip
TipWhen working with a plan that includes a saved baseline, you can see when the baseline was saved in the Set Baseline dialog. The date the baseline was saved appears after the baseline name in the Set Baseline field.
To save the plan’s initial baseline, select Set Baseline and then select Baseline from the list.
Or
To save a subsequent baseline, select Set Baseline and then select the baseline number you want.
TipInterim plans are similar to baselines. You will work with interim plans and the other options in the Set Baseline dialog in Chapter 14.
Select OK.
Project saves the baseline, even though the Gantt Chart view gives no indication that anything has changed.
To clear a previously saved baseline
On the Project tab, in the Schedule group, select Set Baseline and then select Clear Baseline.
In the Clear Baseline dialog, select the options you want and select OK.
To display baseline Gantt bars in a Gantt chart view
In a Gantt chart view, on the Gantt Chart Format tab, in the Bar Styles group, select Baseline and then select the baseline (Baseline or Baseline 1 through Baseline 10) that you want to display.
Project draws baseline Gantt bars for the baseline you choose.
To display scheduled and baseline values by using the Variance table
On the View tab, in the Task Views group, select Other Views and then select Task Sheet.
The Task Sheet view appears. Because this is a tabular view, it does not include a Gantt chart, so more room is available to see the fields in the table.
On the View tab, in the Data group, select Tables.
Select Variance.
![]() Tip
Tip
You also can right-click or long-press (tap and hold) the Select All button in the upper-left corner of the active table to switch to a different table.
Track a plan as scheduled
The simplest approach to tracking progress is to report that the actual work is proceeding exactly as planned. For example, if the first week of a 5-week project has elapsed and all its tasks have started and finished as scheduled, you can quickly record this in the Update Project dialog displayed in Figure 8-3.
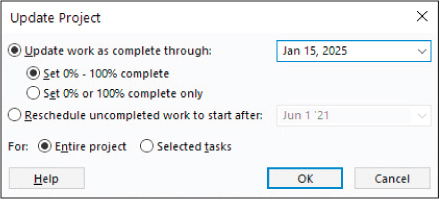
FIGURE 8-3 The Update Project dialog gives you options for basic tracking.
When you record progress on tasks, Project displays that progress by drawing progress bars within the Gantt bars for those tasks, as illustrated in Figure 8-4.
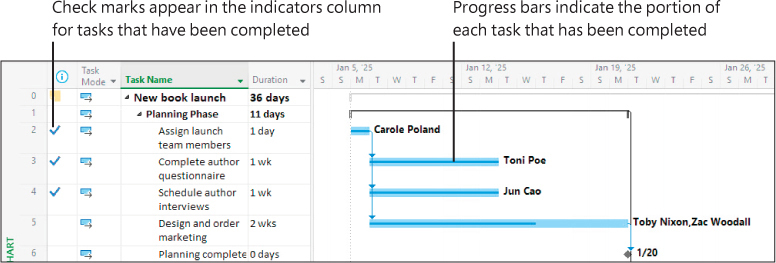
FIGURE 8-4 Visual indicators of task progress in a Gantt chart view include the task completion check marks in the Indicators column and the progress bars inside the Gantt bars.
In the chart portion of the Gantt Chart view, the progress bar shows how much of each task has been completed. For example, consider a Gantt chart view in which tasks 2, 3, and 4 have been completed. A check mark appears in the Indicators column for those tasks, and the progress bars extend through the full length of those tasks’ Gantt bars. For the partially completed Task 5, a partial progress bar is shown in its Gantt bar.
When you record progress through a specific date, Project calculates the actual duration, the remaining duration, actual costs, and other values up to the date you entered. This approach might be fine even if the actual work and cost values Project generates don’t exactly match what happened in the real world but are close enough for your schedule tracking purposes. This is a judgment call that you, as a project manager (in consultation with your project sponsors and other stakeholders), can consider.
To record work as scheduled through a specific date
On the Project tab, in the Status group, select Update Project.
The Update Project dialog opens.
Make sure Update work as complete through is selected. In the adjacent date box, enter or select the date through which you want to record work completed as scheduled.
Select OK.
To record work as scheduled through the current date or status date
Select the task or tasks whose work you want to record.
On the Task tab, in the Schedule group, select Mark on Track.
This command applies only to the selected tasks, and it sets them as complete through the current date or the status date. (To learn about the status date, see Chapter 15, “View and report project status.”)
Enter a task’s completion percentage
After work begins on a task, you can quickly record its progress as a percentage. When you enter a completion percentage greater than 0, Project sets the task’s actual start date to match its scheduled start date. Project then calculates the actual duration, the remaining duration, actual costs, and other values based on the percentage you enter. For example, if you specify that a 4-day task is 25 percent complete, Project calculates that it has had 1 day of actual duration and has 3 days of remaining duration.
You can enter completion percentages in these ways:
Use the preset increment buttons 0%, 25%, 50%, 75%, and 100% Complete in the Schedule group of the Task tab.
Add the percent complete column (labeled % Complete in the interface) to a table in a task view, and enter the value you want.
Enter any percentage value you want in the Task Information dialog.
Use the mouse to set progress on Gantt bars.
Consider some additional tips and suggestions for entering task completion percentages:
You can use a simple tracking technique for projects with many short-duration, “to-do list” types of tasks that don’t require detailed tracking: Use just the 0%, 50%, and 100% Complete values. A 0% value means work on the task has not yet started, 50% means work has started, and 100% means the task is complete. If you need to know only what’s in progress and what has been done, this is the simplest form of tracking that you can apply.
If you can collect the actual start date of a task, it’s a good practice to record the actual start date (described in the next section) and then record a completion percentage.
By default, Project shows Gantt bars in front of nonworking time (such as weekends), as you see in the figures in this chapter. However, Project can show nonworking time in front of task bars, visually indicating that no work on the task will occur during the nonworking time. If you prefer this type of presentation, right-click any empty chart portion of the Gantt Chart view and select Nonworking Time in the shortcut menu. In the Timescale dialog, select the Non-working time tab. Next to Draw, select In front of task bars.
To record a task’s percent complete value in preset increments
In the Task Name column, select the task for which you want to record a percent complete value.
On the Task tab, in the Schedule group, select the 25%, 50%, 75%, or 100% Complete button.
To record a task’s percent complete value
In the Task Name column, select the task for which you want to record a percent complete value.
On the Task tab, in the Properties group, select Information.
The Task Information dialog opens.
TipYou can also double-click a task name to open its Task Information dialog.
On the General tab of the dialog, enter the Percent complete value you want.
To use the % Complete column in a table
Right-click any column heading in a task table.
In the shortcut menu that appears, select Insert Column.
A list of fields appears.
Enter or select % Complete.
Record the percent complete values you want for any tasks in the table.
To use the mouse to set or extend progress on Gantt bars
Point to the left side of a Gantt bar (or progress bar within a Gantt bar).
When the mouse pointer changes to a percent symbol and right arrow, drag the mouse pointer from left to right within the Gantt bar. As you do so, note the CompleteThrough date value that appears in a ScreenTip, as shown in Figure 8-5.
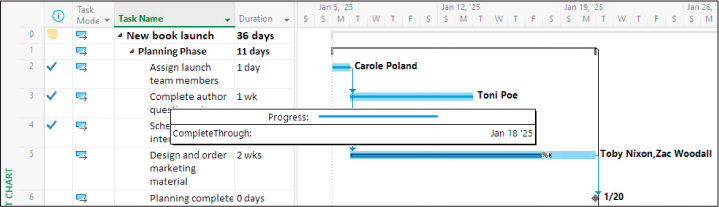
FIGURE 8-5 Drag the mouse pointer within a task’s Gantt bar to record progress.
To see a task’s progress details, point to the progress bar inside the Gantt bar, as Figure 8-6 shows.
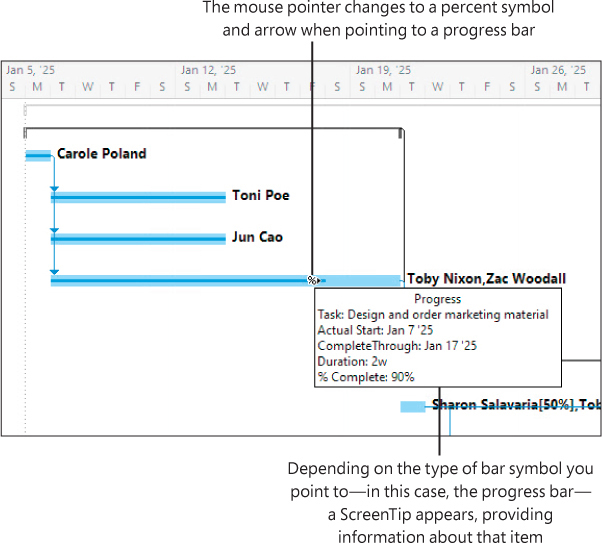
FIGURE 8-6 Point to any Gantt bar to see the task’s key progress values.
Enter actual values for tasks
A more detailed way to keep your schedule up to date is to record what actually happened for each task in your plan. You can record each task’s actual start, finish, work, or duration values. For example, when you enter 3 days of actual duration on a task with 5 days of scheduled duration and 40 hours of work, Project calculates the actual work to be 24 hours, the percent complete to be 60%, and the remaining duration to be 2 days. You can see in Figure 8-7 when you record actual duration, Project recalculates the task’s essential schedule values, such as percent complete and remaining duration.
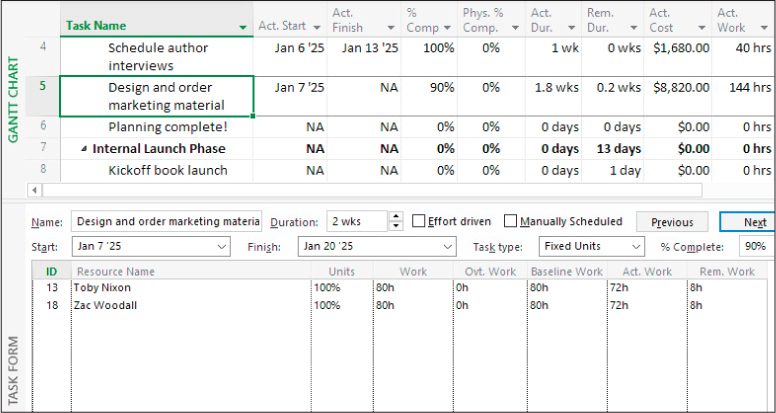
FIGURE 8-7 The combination of the Tracking table in a Gantt chart view and the Task Form shows how actual duration affects the task’s schedule values.
When you enter various actual values, Project uses the following rules to update the plan:
When you enter a task’s actual start date, Project moves the scheduled start date to match the actual start date.
When you enter a task’s actual finish date, Project moves the scheduled finish date to match the actual finish date and sets the task to 100 percent complete.
When you enter a task’s actual work value, Project recalculates the task’s remaining work value, if any.
When you enter a task’s actual duration, if it is less than the scheduled duration, Project subtracts the actual duration from the scheduled duration to determine the remaining duration.
When you enter a task’s actual duration, if it is equal to the scheduled duration, Project sets the task to 100 percent complete.
When you enter a task’s actual duration, if it is longer than the scheduled duration, Project adjusts the scheduled duration to match the actual duration and sets the task to 100 percent complete.
Because your plan is updated with actuals, your plan as scheduled will likely change. However, the original plan as saved in a baseline is not altered.
Project supports multiple ways of recording actuals. This chapter explores two methods:
Recording actuals in the Tracking table This works well when you want to update actuals and see remaining duration and cost values in a single table.
Recording actuals in the Update Tasks dialog This works well when you want to focus on a single task or want to update tasks in views that don’t support tables, such as the Network Diagram view. Figure 8-8 shows the Update Tasks dialog.
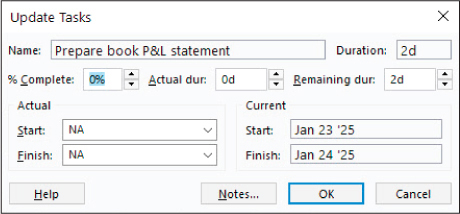
FIGURE 8-8 Use the Update Tasks dialog to record a task’s actual duration, start, and other tracking values.
Pay attention to the Update Tasks dialog. When you enter a percent complete, actual duration, or remaining duration value, the other values are not dynamically updated in the dialog—they are recalculated after you select OK. If you then return to the dialog, you can see the updated values.
Let’s look at an example of how the Update Tasks dialog handles values. If you enter an initial actual duration of 2 days on a 4-day task, the remaining duration field still shows 4 days. When you select OK and then open the Update Tasks dialog again, the remaining duration field now shows 2 days of remaining duration. If you had entered 2 days of actual duration and 4 days of remaining duration, Project would have recorded the task as having 4 days of remaining duration left and an overall duration of 6 days instead of the original 4 days.
![]() Tip
Tip
You can also apply all the tracking methods in this chapter to manually scheduled tasks. Additionally, you can record an actual start, actual finish, or remaining duration value for a manually scheduled task.
To record a task’s actual values in the Tracking table
On the View tab, in the Data group, select Tables and then select Tracking.
The Tracking table appears.
Enter the actual values for the task.
![]() Tip
Tip
You can display the table that is most relevant to the details you’re focused on while tracking progress in a plan. Useful tables include the Work table, which focuses on work values, and the Cost table, which focuses on cost values.
To record a task’s actual values in the Update Tasks dialog
In the Task Name column, select the task for which you want to record actual values.
On the Task tab, in the Schedule group, select the arrow to the right of Mark on Track, and then select Update Tasks.
In the Update Tasks dialog, enter the task’s actual values (actual duration, remaining duration, actual start, or actual finish).
Skills review
In this chapter, you learned how to
Understand progress tracking
Save a baseline of your plan
Track a plan as scheduled
Enter a task’s completion percentage
Enter actual values for tasks

Practice tasks
The practice files for these tasks are located in the ProjectDesktopSBSCh08 folder. For practice file download instructions, see the introduction to this book.
![]() Important
Important
If you’re running Project Online desktop client or Project Professional, make sure that Project is not connected to Project Web App and is instead set to Computer mode. For more information, see Appendix C, “Integration with Microsoft 365 solutions for collaboration.”
Save a baseline of your plan
The scenario: at Lucerne Publishing, the new book launch plan is now fully developed. Actual work on the project will soon begin. You want to be able to compare the actual work and the current schedule with the original plan, so you first want to save a baseline. Open SimpleTrackBaseline and perform the following tasks:
Save the baseline for the entire plan, using the default baseline settings.
Switch to the Task Sheet view.
Display the Variance table to see scheduled and baseline values, as Figure 8-9 shows.
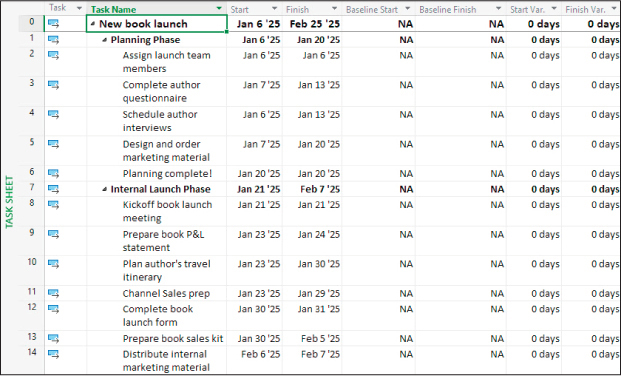
FIGURE 8-9 The scheduled dates in this plan match its baseline dates, so the variance values are zero.
Track a plan as scheduled
The scenario: some time has passed since you saved the baseline in the new book launch plan. Work has been completed through the first week and a half, as planned. You need to account for the completed work in the plan. Open the SimpleTrackActuals plan and perform the following task:
Use the options in the Update Project dialog to record that work has been completed as scheduled through January 15, 2025.
Project records the completion percentage for the tasks that were scheduled to start by January 15. It displays that progress by drawing progress bars in the Gantt bars for those tasks, as shown in Figure 8-10.
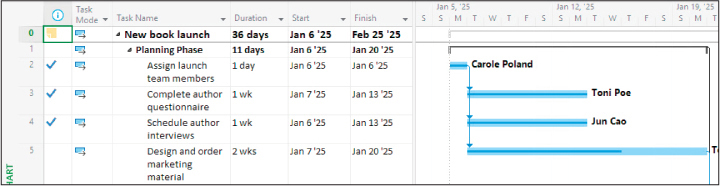
FIGURE 8-10 After you record progress through a specific date, Project displays the progress bars and, for completed tasks, the completion check marks in the Gantt Chart view.
In the chart portion of the Gantt Chart view, the progress bar shows how much of each task has been completed. Because tasks 2, 3, and 4 have been completed, a check mark appears in the Indicators column for those tasks, and the progress bars extend through the full length of those tasks’ Gantt bars. Task 5 is only partially completed.
Enter a task’s completion percentage
The scenario: work continues on the new book launch. You have additional progress to record in the plan as percent complete values. Continuing in the SimpleTrackActuals plan, perform the following tasks:
Set the following tasks to 100 percent complete:
5, Design and order marketing material
6, Planning complete!
8, Kickoff book launch meeting
Project records the actual work for the tasks as scheduled and extends progress bars through the length of the Gantt bars, as shown in Figure 8-11.
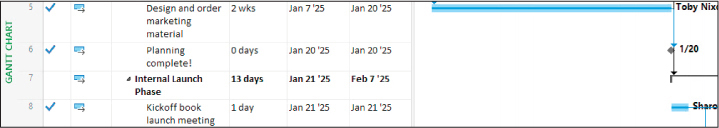
FIGURE 8-11 Recording 100 percent complete is a quick checklist way of recording that a task was completed as scheduled, with no variance.
Because task 6 is a milestone task with no duration, its symbol in the chart portion of the Gantt Chart view does not change (you can see that tasks 5 and 8 did change). However, the completion check marks for all three tasks appear in the Indicators column.
Set task 9, Prepare book P&L statement, to 50 percent complete and then point to its progress bar. You can see the task’s ScreenTip in Figure 8-12.
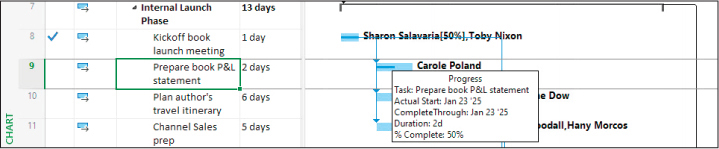
FIGURE 8-12 Point to the progress bar in the partially completed task’s Gantt bar to see its key progress indicators in a ScreenTip.
Note that task 9 did not start until January 23, which is 1 day past the finish of the previous task. This is because of an exception in the calendar, “Staff at morale event,” on January 22, which is a nonworking day.
Enter actual values for tasks
The scenario: a few more days have passed, and work on the new book launch has progressed. Resources performing the work have given you actual progress that differs somewhat from the plan, and you want to record these actuals and observe the effect on the overall plan. Continuing in the SimpleTrackActuals plan, perform the following tasks:
Use the Tracking table to record that task 9, Prepare book P&L statement, required a total of 24 hours of actual work to complete.
Because 24 hours is greater than its original duration of 16 hours, Project marks the task as completed and extends the Gantt bar of the task to indicate its longer duration. You can see the results of this by viewing change highlighting, as Figure 8-13 shows.
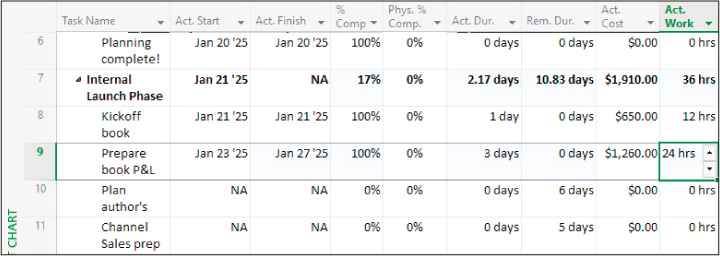
FIGURE 8-13 When you record actual duration, the change highlighting is a great way to see what other changes in the plan the actuals introduced.
Use the options in the Update Tasks dialog displayed in Figure 8-14 to record that task 10, Plan author’s travel itinerary, started 1 working day behind schedule (January 24) and required a total of 7 days to complete.
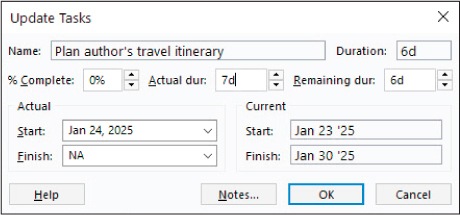
FIGURE 8-14 When recording actual duration, you should also record the actual start date if it differs from the scheduled start date.
Select OK.
Project records the actual values for the task and marks it as complete. The updated values roll up to the Internal Launch Phase summary task (task 7) and the project summary task (task 0), as indicated by the change highlighting shown in Figure 8-15.
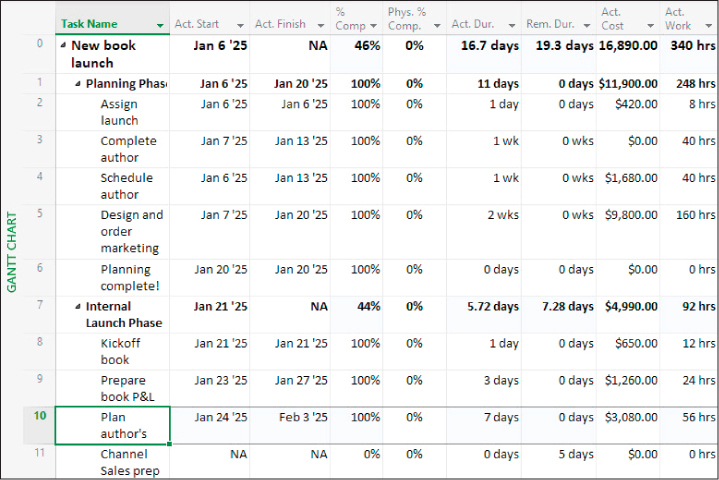
FIGURE 8-15 Actual values that you record at the task level roll up to the task’s summary task and to the project summary task.
Use the options in the Update Tasks dialog for task 11, Channel Sales prep. This task started on time and has 3 days of actual duration, but it will still require 5 days of remaining duration to complete. (Remember to enter the new remaining duration value after entering the actual duration value.)
As Figure 8-16 shows, this gives the task a new total duration of 8 days: 3 days of actual duration plus 5 days of remaining duration.
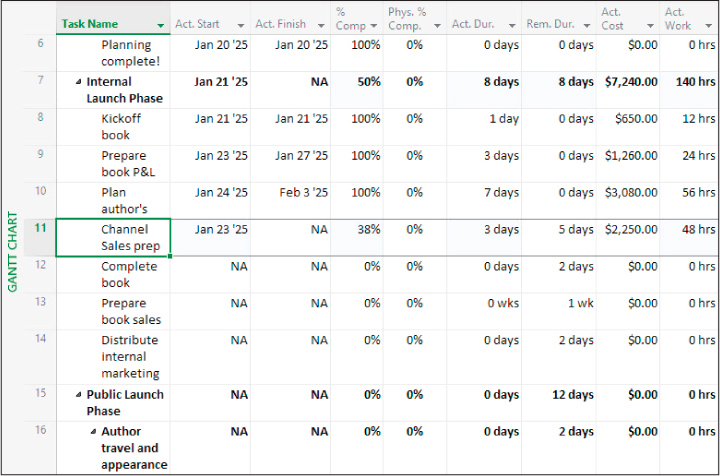
FIGURE 8-16 Unless you record an actual start date, Project assumes that the task started as scheduled.
Because you did not specify an actual start date, Project assumes that the task started as scheduled. However, the actual duration and updated remaining duration value you entered caused Project to calculate a new total duration and will recalculate the task’s scheduled finish date.