
15
View and report project status
In this chapter
Communicating project status to key stakeholders is an important function of a project manager. Although the perfect flow of communications cannot guarantee a project’s success, a project with poor communications flow is almost guaranteed to fail.
A key to properly communicating project status is knowing the answers to the following questions: Who needs to know the project’s status and for what purpose? What format or level of detail do these people need?
The time to answer these questions is in the initial planning phase of the project. When work on the project is underway, you can respond to those questions by reporting project status. This takes several forms:
Status reports that describe where the project is in terms of cost, scope, and schedule (the three sides of the project triangle, as described in Appendix A, “A short course in project management”)
Progress reports that document the specific accomplishments of the project team
Forecasts that predict future project performance
This chapter guides you through procedures related to examining a plan’s variance, identifying tasks that have slipped, examining task costs, and examining resource costs.
Examine a plan’s variance
After a plan’s baseline has been set and work has begun, the focus of the project manager shifts from planning to collecting, analyzing, and sharing performance details. For most plans, three primary questions can help with analyzing project performance details:
At the rate work is being completed, is the plan on track to finish when you expect it to?
How has the plan’s duration, work, or cost changed?
What has work on the plan cost so far, and what costs are projected for remaining work?
Comparing the answers to these questions against the baseline gives the project manager and other stakeholders a good way to measure progress and determine when corrective action might be necessary.
Where the scheduled or actual performance differs from the baseline plan, you have variance. Variance is usually measured as time, such as days behind schedule, or as cost, such as dollars over budget. When initial planning is complete, many project managers spend most of their time identifying, investigating, and responding to variance. Before you can respond to variance, you must identify it.
In this topic, you examine some useful Project features that can help you understand and share project status. We focus on status reporting features (especially reports) that are likely to be useful across a wide range of project types and sizes, as well as across different industries.
To start, for a quick “status-at-a-glance” snapshot, use the Project Statistics dialog, as shown in Figure 15-1.
In this dialog, you can see (among other details) the plan’s finish date and variance. Keep in mind that this variance is the scheduled finish date compared to the baseline finish date; without a saved baseline, there is no tracked variance. If you need a refresher on baselines, see Chapter 14, “Track progress: Detailed techniques.”
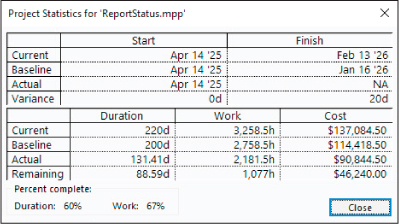
FIGURE 15-1 This example shows the 20 days of variance between the baseline finish date and the finish date as currently scheduled.
![]() Tip
Tip
To see overall project-wide values, display the project summary task by selecting Project Summary Task on the <View Name> Format tab, in the Show/Hide group. You can also apply useful tables, including the Cost and Variance tables in tabular views such as Gantt chart and usage views. Later task- and resource-specific topics in this chapter describe these tables.
For broad schedule and cost variance analysis and reporting, use the Project dashboard reports. We begin with the Project Overview report, which is shown in Figure 15-2.
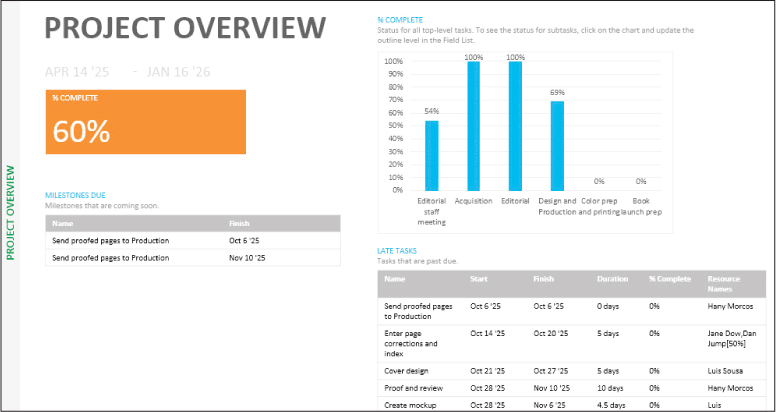
FIGURE 15-2 The Project Overview report prominently displays the plan’s overall percent completed (60%, in this example), percent complete by summary task, and more.
This report focuses on overall progress of summary tasks and milestones. This is a good report to share with project stakeholders who need big-picture status.
As Figure 15-3 shows, for cost-centric reports, you can start with the Cost Overview report. This report conveys the plan’s overall scheduled cost and cost status.
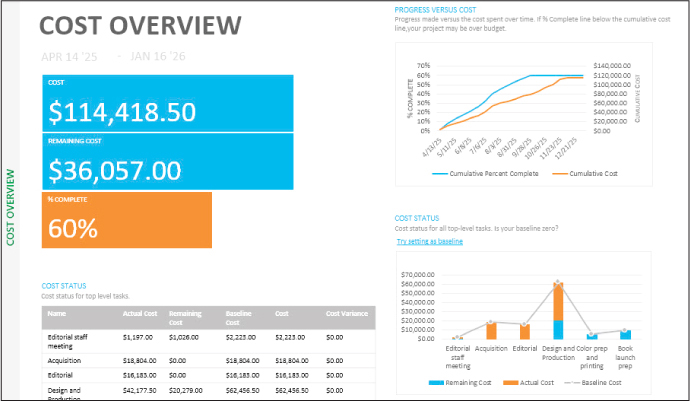
FIGURE 15-3 The Cost Overview report conveys total and remaining costs, in addition to historical and future cost trends for the plan.
You can see in Figure 15-4 that another cost report that’s useful for big-picture cost reporting is the Burndown report.
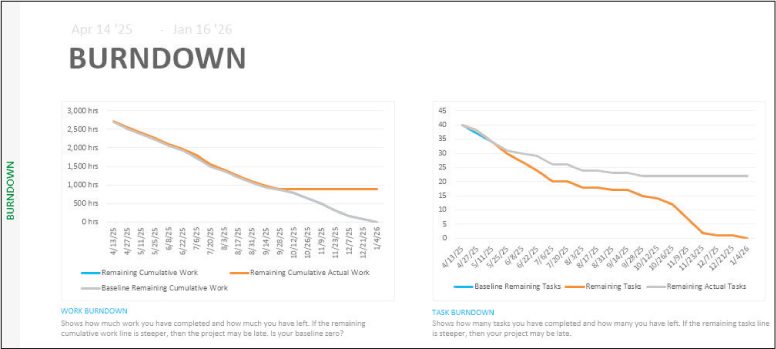
FIGURE 15-4 The Burndown report helps you answer the question, “At the rate we are working, when will we complete the project?”
This report helps you see, at a broad level, how much work has been completed, how much work remains, and the predicted rate at which remaining work will be completed.
To open the Project Statistics dialog
Select the File tab to display the Backstage view and then select the Info tab.
On the Info page of the Backstage view, select Project Information and then select Project Statistics.
To display a Dashboard report
On the Report tab, in the View Reports group, select Dashboards.
Select the Dashboard report you want.
Identify tasks that have slipped
When tasks start or finish earlier or later than planned, schedule variance is the result. One cause of schedule variance is delays in starting or finishing tasks. You certainly want to know about tasks that started late or future tasks that might not start as scheduled. Let’s look at various ways of spotting task variance.
As Figure 15-5 shows, the Tracking Gantt view is a handy view in which to see task variance graphically represented. This view graphically illustrates the difference among scheduled, actual, and baseline performance. The Tracking Gantt view uses the color red to distinguish the tasks on the critical path. To improve the view for colorblind readers, insert the column Critical, which displays Yes for critical (red) tasks. This is especially important when looking at variance because variance on critical tasks directly affects the plan’s finish date.
![]() Tip
Tip
To see details about any bar or other item in a Gantt chart view, point to it; a ScreenTip appears with details.
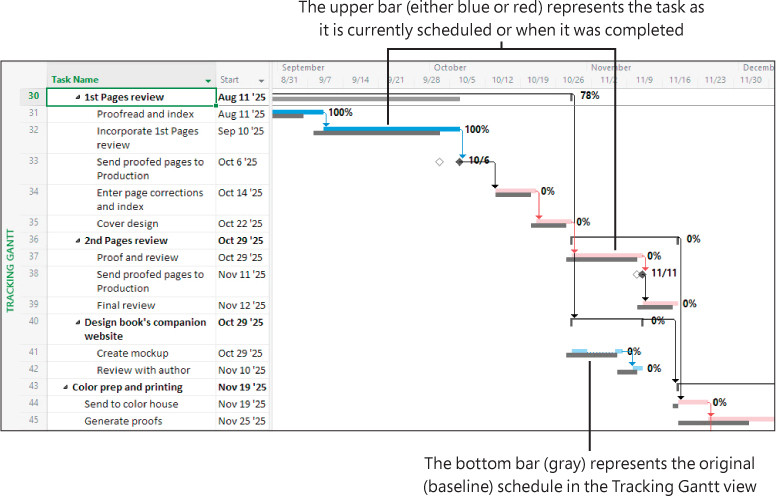
FIGURE 15-5 By comparing the currently scheduled Gantt bars with the baseline Gantt bars, you can see what tasks have slipped from their original baseline schedule.
The Variance table in the Task Sheet (see Figure 15-6) or any task-centric tabular view is especially useful for identifying variance from the baseline.
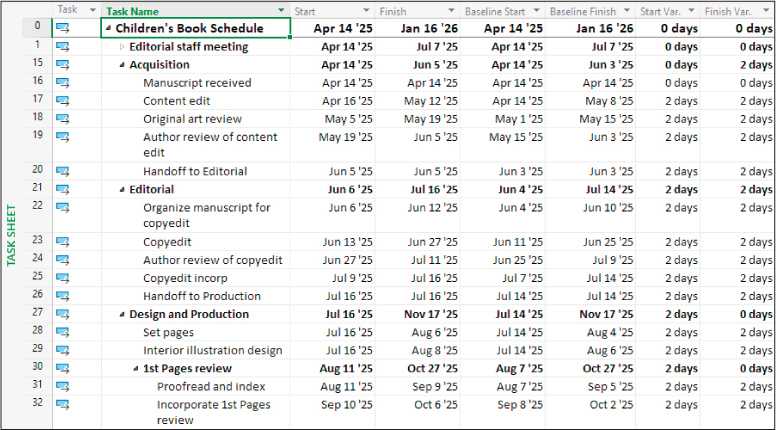
FIGURE 15-6 The Variance table shows the number of days of variance for each task’s start and finish dates.
![]() Tip
Tip
To focus on only tasks that have variance, you can apply the Slipping Tasks filter to the task list. This filter shows only uncompleted tasks that, as currently scheduled, have slipped from their baseline schedule. In this context, “slipping” means “slipping from baseline.” Other useful filters include the Slipped/Late Progress and Late Tasks filters.
Two useful reports that cover task variance are the Late Tasks (see Figure 15-7) and Slipping Tasks (see Figure 15-8) reports. The Late Tasks report focuses on the status date—the current date, unless you set a different status date.
![]() Tip
Tip
Changing the status date provides more accurate reports if the progress entered on the plan is current only through a past date. The status date also replaces the current date when using features that track a plan as scheduled or that reschedule a plan after a date. To review progress tracking, refer to Chapter 8, “Track progress: Basic techniques.” To change the status date, select Project Information on the Project tab, in the Properties group.
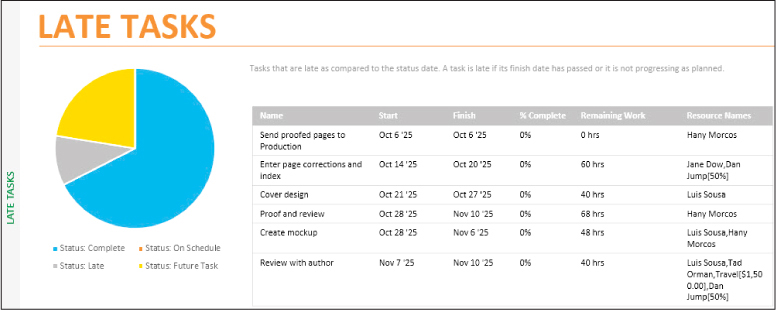
FIGURE 15-7 Use the Late Tasks report to focus on tasks that finished or will finish later than planned.
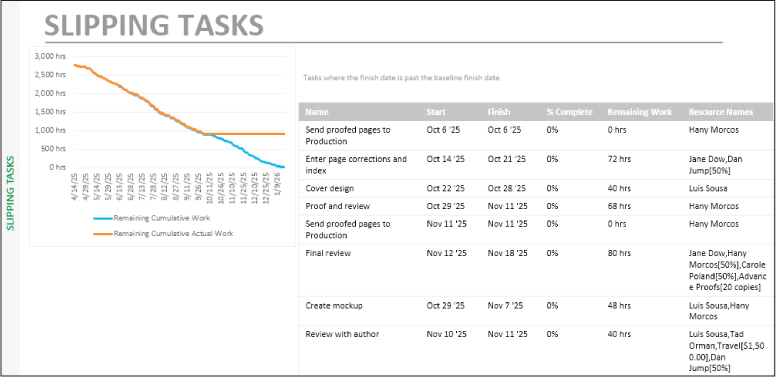
FIGURE 15-8 When a plan includes a baseline, the Slipping Tasks report helps you identify tasks that have slipped from the baseline.
The Slipping Tasks report focuses on task status in relation to the tasks’ baseline finish dates.
To display the Variance table in the Task Sheet view
You can also add the Variance table to any task-centric tabular view.
On the View tab, in the Task Views group, select Other Views and then select Task Sheet to display the Task Sheet view.
On the View tab, in the Data group, select Tables and then select Variance.
To display the Tracking Gantt view
On the View tab, in the Task Views group, select the Gantt Chart arrow and then select Tracking Gantt.
To display the Late Tasks or Slipping Tasks report
On the Report tab, in the View Reports group, select In Progress.
Select the report you want.
Examine task costs
Measuring the schedule’s status (that is, determining which tasks start and finish on time), although critical to nearly all projects, is only one indicator of overall project health. For projects that include cost information, another critical indicator is cost variance—are tasks running over or under budget?
Task costs in Project include the following:
Fixed costs applied directly to tasks
Resource costs derived from assignments
When tasks cost more or less than planned to complete, cost variance is the result. Evaluating cost variance enables you to make incremental budget adjustments for individual tasks to avoid exceeding your overall budget.
Although tasks and resources (and their costs) are directly related, it’s informative to evaluate each individually. This topic focuses on the views, reports, and other features that help you identify and communicate task costs. The next topic does the same for resource costs.
A great place to start is to show the Cost table in any task-centric tabular view, such as the Task Sheet (see Figure 15-9).
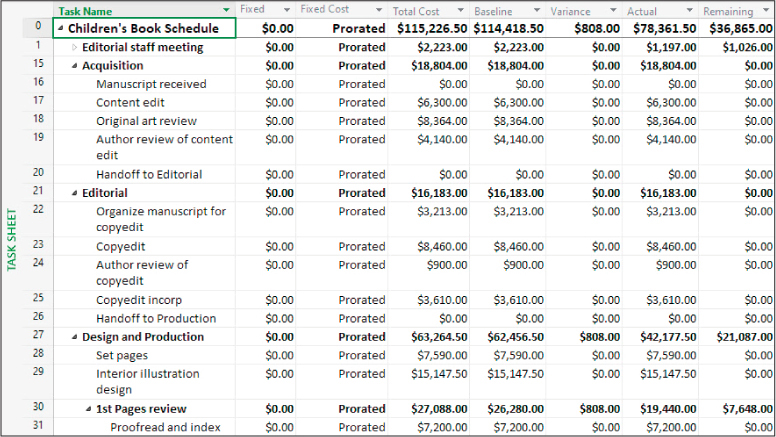
FIGURE 15-9 Display the project summary task to see the complete cost rollup, from subtasks, to summary tasks, to the project summary task.
In this table, Total Cost represents the calculated cost (sometimes called the scheduled cost) of a task, based on the cost rates of the assigned resources and their assigned durations, plus any fixed cost that’s been specified for the task. If the task has been completed, Total Cost is equal to the task’s actual cost.
Displaying the project summary task (identified as task 0) is useful when examining a plan’s costs. The project summary task’s cost values are the plan’s cost values, and they match the values you see in the Project Statistics dialog. These values include the following:
The current total cost value is the sum of the actual (completed) and remaining (uncompleted) cost values.
The baseline cost value is the project’s planned cost when its baseline was set.
The actual cost is the cost that has been incurred so far.
The remaining cost is the difference between the current cost and the actual cost.
Project includes several reports that focus on task costs. You can see in Figure 15-10 that the Task Cost Overview report includes multiple charts and tables that present summary and detailed task cost information.
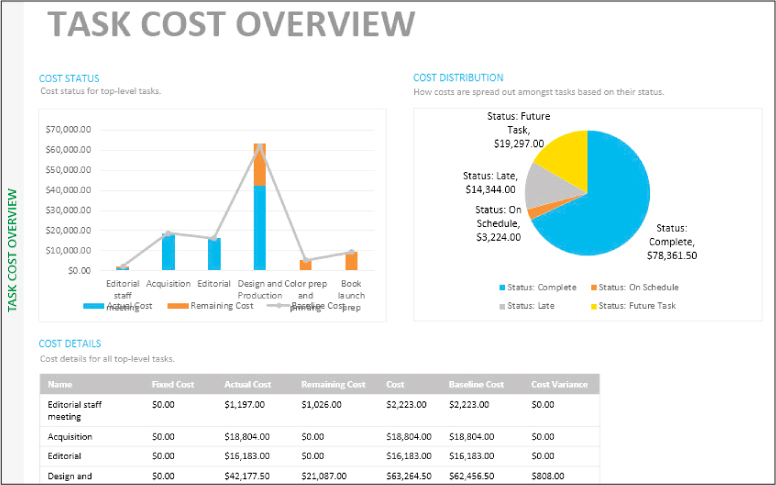
FIGURE 15-10 In the Task Cost Overview report, the Cost Distribution pie chart sums task costs by their completion status.
Another useful report is the Cash Flow report (see Figure 15-11). This report shows cumulative project costs per quarter, or whatever budgeting time period you need.
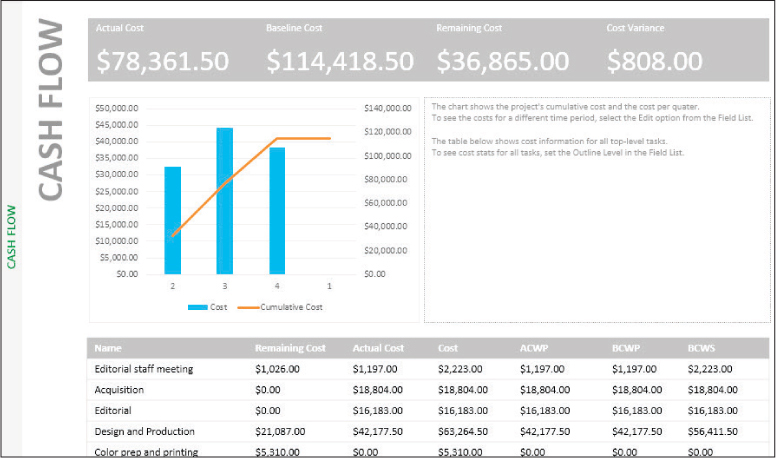
FIGURE 15-11 Display the Cash Flow report to see the plan’s cost and cumulative cost values over time.
We’ll end this walkthrough of task- and cost-centric Project features with a visual report. Visual reports are a category of reports that use Project data exported to Excel or Visio. The Budget Cost visual report presents budget (in this context, meaning as currently scheduled), baseline, and actual costs per time period. As Figure 15-12 shows, when you generate this visual report, Project exports data to Excel and then produces a PivotChart and PivotTable in Excel.
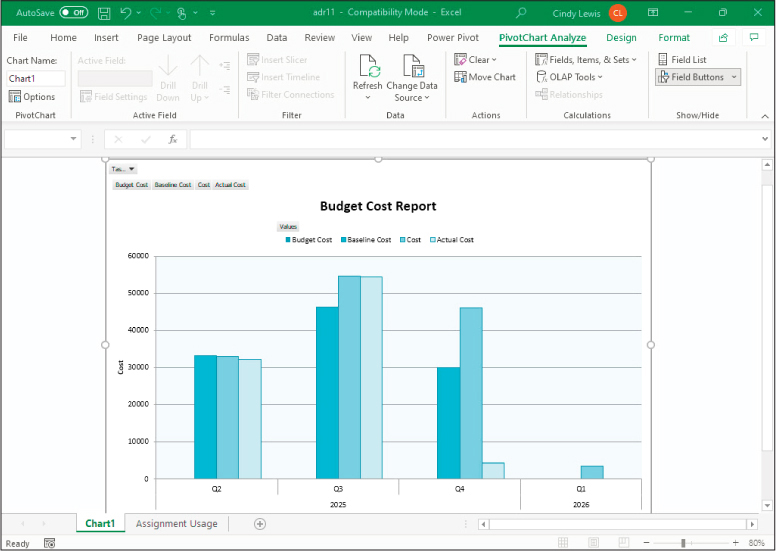
FIGURE 15-12 The Budget Cost visual report is based on an Excel PivotTable and offers the rich data manipulation available with a PivotTable and displayed as a PivotChart.
Consider some additional tips and suggestions for working with tasks’ cost data:
Apply the Late/Overbudget Tasks Assigned To filter for a specific resource. This filter is available from the More Filters list on the View tab, available from the Filters command in the Data group.
Display work variance in the Work table in a task view by selecting Work on the Tables menu, available from the View tab, in the Data group. Remember that, for a plan in which most costs are derived from work resources, examining work variance is one way to examine cost variance.
You can compare timephased baseline and scheduled work in a usage view. For example, in the Task Usage view, on the Task Usage Format tab, in the Details group, select Baseline Work.
To see cost variance over time for assignments to a task, switch to the Task Usage view and then apply the Cost table. While in a usage view, you can also show Cost, Baseline Cost, and Actual Cost details using the Add Details dialog. On the Task Usage Format tab, in the Details group, select the options you want.
To display the Cost table in the Task Sheet view
On the View tab, in the Task Views group, select Other Views and then select Task Sheet to display the Task Sheet view.
On the View tab, in the Data group, select Tables and then select Cost.
To display the Task Cost Overview or Cash Flow report
On the Report tab, in the View Reports group, select Costs.
Select the report you want.
To display the Budget Cost visual report (requires Excel)
On the Report tab, in the Export group, select Visual Reports to open the Visual Reports dialog.
Select the Assignment Usage tab.
Select Budget Cost Report and then select View. The report appears in Excel.
Examine resource costs
Project managers sometimes focus on resource costs as a means of measuring progress and variance within a project. However, resource cost information also serves other people and other needs. For many organizations, resource costs are the primary—or even the only—costs incurred while completing projects, so closely watching resource costs might directly relate to the financial health of an organization. The person most interested in a project’s resource costs as they relate to organizational costs might not be a project manager, but instead an executive, cost accountant, or resource manager.
Another common reason to track resource costs is for billing either within an organization (for example, billing another department for services your department has provided) or externally. In either case, the resource cost information stored in plans can serve as the basis for billing for your department or organization’s services to others.
This topic walks you through some effective features, views, and reports for focusing on resource costs in your plans. We begin with the Cost table, which you can display in any resource-centric tabular view, such as the Resource Sheet view shown in Figure 15-13.
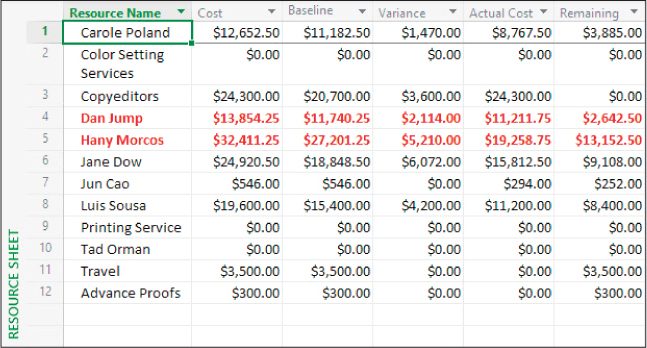
FIGURE 15-13 The cost values for work resources are derived from each resource’s cost rate multiplied by the work on their assignments to tasks in the plan.
In the Cost table, you can see each resource’s cost, baseline cost, and related cost values, as Figure 15-14 shows.
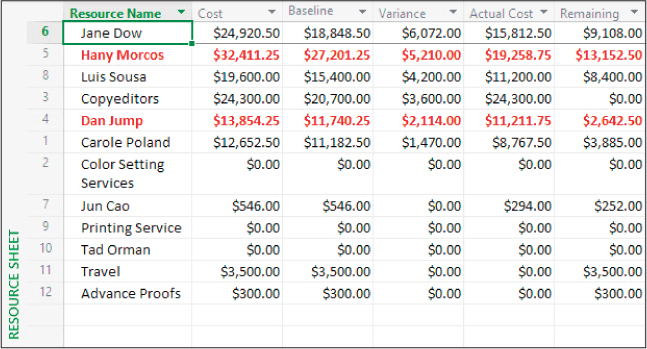
FIGURE 15-14 Use the sorting and filtering features to organize and present resource cost information in tabular views.
With the Cost table visible, you can then sort the Cost or another column from largest to smallest. When you sort by the Cost column, Project sorts resources according to the values in the Cost column, which is the sum of their actual (or historical) costs and their remaining (or expected) costs. Sorting resources by the Cost column quickly tells you the most and least costly resources.
Another useful sorting strategy is to sort resources by their Variance value, as illustrated in Figure 15-14. With the resource list sorted by cost variance, you can quickly zero in on resources with the greatest variance.
To see cost variance over time for assignments per resource, display the Resource Usage view and then apply the Cost table. Then you can also show Cost and Baseline Cost details in the timephased grid, as shown in Figure 15-15. This also works in the Task Usage view.
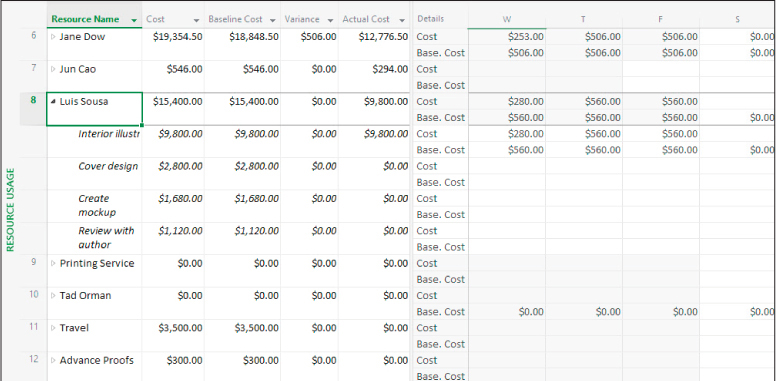
FIGURE 15-15 With both the Cost table and cost-related timephased details visible, the Resource Usage view gives you a detailed level of timephased cost data.
Project also includes reports that focus on resource costs, as Figure 15-16 shows in the Resource Cost Overview report.
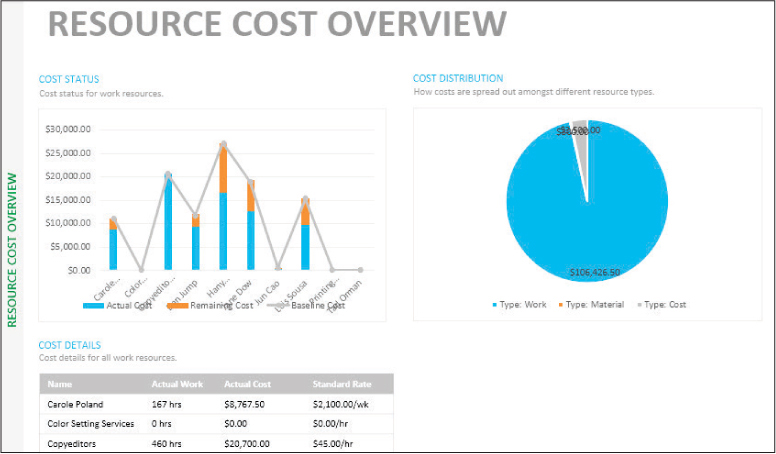
FIGURE 15-16 The Resource Cost Overview report includes a mix of charts and tables that focus on cost details per resource.
This report includes a simple summary table of resource cost details, plus charts that convey actual and remaining costs per resource, as well as cost totals by resource type. The Cost Distribution pie chart is especially relevant if your plan includes a significant portion of material and cost resources.
To display the Cost table in the Resource Sheet view
On the View tab, in the Resource Views group, select Resource Sheet to display the Resource Sheet view.
On the View tab, in the Data group, select Tables and then select Cost.
To sort resources by cost amounts
Display the Cost table.
Select the AutoFilter arrow in a column heading such as Cost or Variance and, in the menu that appears, select Sort Largest to Smallest.
To display the Cost table and cost details in the Resource Usage view
On the View tab, in the Resource Views group, select Resource Usage to display the Resource Usage view.
On the View tab, in the Data group, select Tables and then select Cost. The Cost table appears in the Resource Usage view.
On the Resource Usage Format tab, in the Details group, select the Cost detail to add it to the timephased side of the view.
To add more timephased details, select Add Details to open the Detail Styles dialog. Then in the Available fields list, select the cost-related fields you want to add and select Show.
To display the Resource Cost Overview report
On the Report tab, in the View Reports group, select Costs.
Select Resource Cost Overview.
Skills review
In this chapter, you learned how to
Examine a plan’s variance
Identify tasks that have slipped
Examine task costs
Examine resource costs

Practice tasks
The ReportStatus practice file for these tasks is located in the ProjectDesktopSBSCh15 folder. For practice file download instructions, see the introduction to this book.
![]() Important
Important
If you’re running Project Online desktop client or Project Professional, make sure that Project is not connected to Project Web App and is instead set to Computer mode. For more information, see Appendix C, “Integration with Microsoft 365 solutions for collaboration.”
Examine a plan’s variance
The scenario: at Lucerne Publishing, work on the children’s book plan is well underway. You’ve encountered some variance from the plan—in other words, actual work has not always matched the plan as captured in its baseline. You want to get a broad look at what work has been completed and what remains. Open the ReportStatus plan in Project and perform the following tasks:
Locate the plan’s overall schedule variance of its finish date (65 days) in the Project Statistics dialog.
Display the Project Overview report shown in Figure 15-17, and note the percent complete values of the top-level summary tasks.
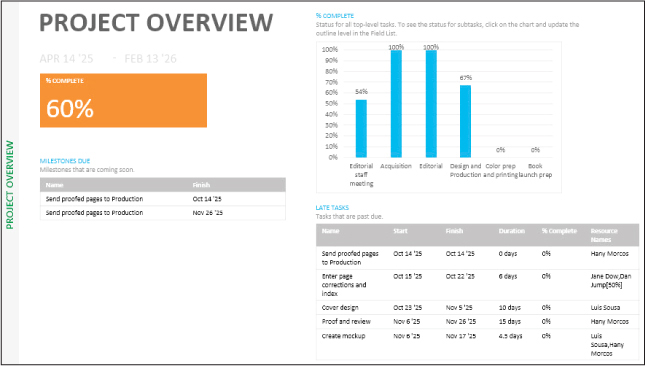
FIGURE 15-17 The Project Overview report prominently displays overall percent complete, in addition to the completion status of top-level summary tasks.
Identify tasks that have slipped
The scenario: you’ve seen the overall variance for the children’s book plan. Next, you focus on the summary tasks that have incurred the highest variance. Continuing in the ReportStatus plan, perform the following tasks:
Display the Variance table in the Task Sheet view, as Figure 15-18 shows.
Filter the table to display only summary tasks, as shown in Figure 15-18.
Use the resulting view to identify the summary tasks (phases) of the plan that have incurred the highest finish variance.
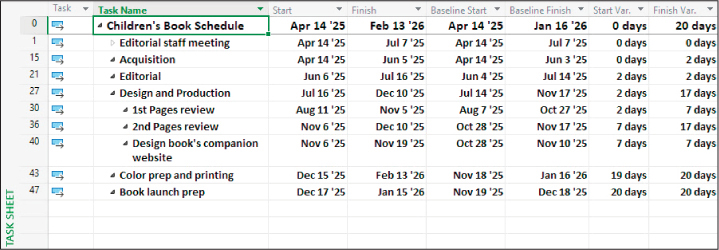
FIGURE 15-18 Apply the Summary Task filter to more simply focus on summary tasks’ variance values.
Display the Slipping Tasks report shown in Figure 15-19, and identify the tasks with the most remaining work that have slipped from the baseline.
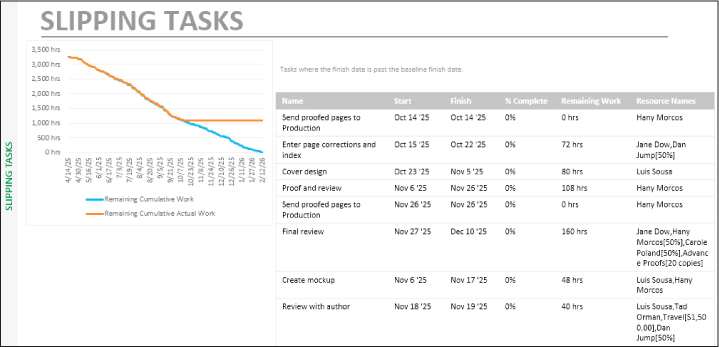
FIGURE 15-19 Scan down the Remaining Work column to identify the slipping tasks with the most remaining work.
Examine task costs
The scenario: you’ve examined task schedule variance in the children’s book plan. Next, you examine task cost variance. Continuing in the ReportStatus plan, perform the following tasks:
Display the Cost table in the Task Sheet view to find the total remaining costs per summary task, as shown in Figure 15-20.
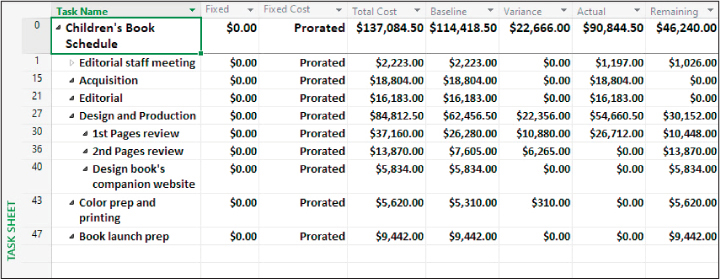
FIGURE 15-20 Use the Cost table to spot variance per task and summary task (this view still has the summary task filter applied).
Display the Task Cost Overview report, as Figure 15-21 shows, and then find the expected cost of the plan’s incomplete future tasks.
 Tip
TipFuture tasks are incomplete even though the pie chart does not indicate that.
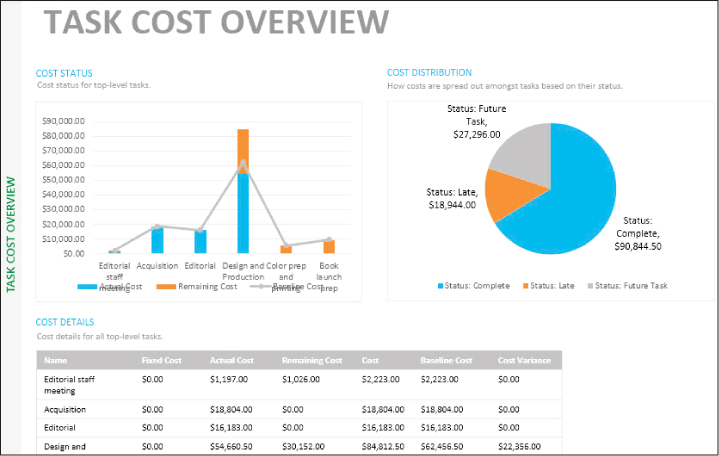
FIGURE 15-21 The pie chart in the Task Cost Overview report conveys the total cost of both completed and future tasks.
Examine resource costs
The scenario: expenses in the children’s book plan are mostly derived from the costs of resource assignments. You’ve already seen the task costs, so next you focus on resource cost variance. Continuing in the ReportStatus plan, perform the following tasks:
Display the Cost table in the Resource Sheet view, as shown in Figure 15-22.
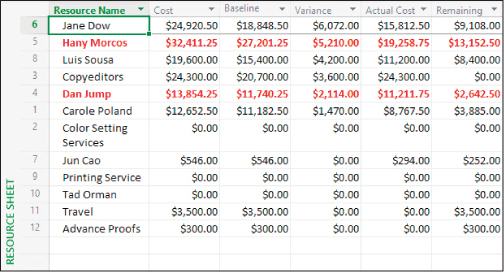
FIGURE 15-22 With resources sorted by cost variance, it’s easy to spot which resources have incurred the most variance.
Sort the resources from most to least cost variance.