
19
Share information with other programs
In this chapter
This chapter focuses on various ways of getting data into and out of Project. In addition to the standard Microsoft copy and paste features you might be familiar with, Project offers a variety of options for importing and exporting data.
Throughout this chapter, the following terms apply:
The source program is the program from which you copy information.
The destination program is the program to which you paste information.
This chapter guides you through procedures related to copying Project data to and from other programs, opening files in other formats in Project, saving to other file formats from Project, and generating reports with Microsoft Excel and Visio.
![]() Tip
Tip
To learn more about Excel, Visio, and other programs, visit the Microsoft Support page at https://support.microsoft.com to review a list of topics, find information about programs, or search for information
Copy Project data to and from other programs
You can copy information out of and paste information into Project. However, because Project information is highly structured, it’s important to note a few points.
When copying data from Project (the source program) into other (destination) programs, you have some options for the results that you get:
You can copy information (such as task names and dates) from a table in Project (see Figure 19-1) and paste it as structured tabular data in spreadsheet programs such as Excel, or as a table in word-processing programs that support tables, such as Microsoft Word (see Figure 19-2).
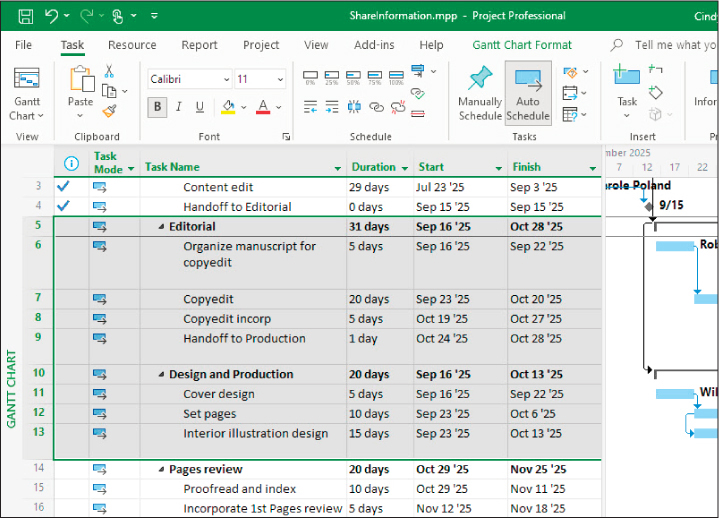
FIGURE 19-1 This selected data in Project includes a summary and subtask hierarchy.
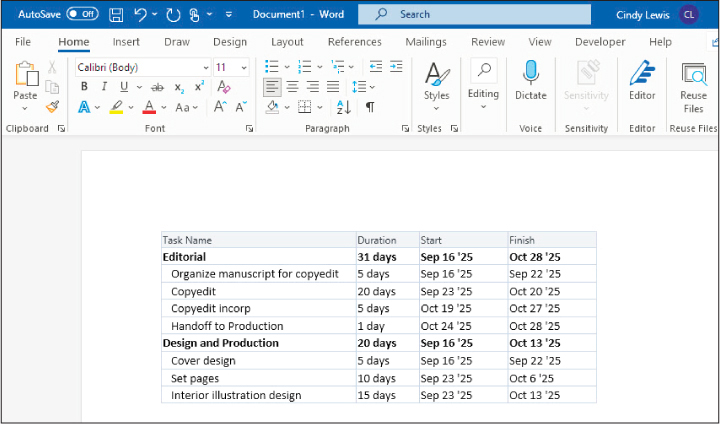
FIGURE 19-2 Pasting into Word generates a formatted table that preserves the column headings and the summary task and subtask outline structure from Project.
In most cases, the table’s column headings for the data you copied are also pasted, and the summary/subtask hierarchy is indicated by the indentation of the subtasks.
You can copy text from a table in Project and paste it as tab-delimited text in text editor programs that don’t support tables, such as WordPad and Notepad.
When pasting information from Project into an email program such as Microsoft Outlook, you probably will get tabular results if your email program supports the HTML format.
You can create a graphic image snapshot of the active view and paste the image into any program that supports graphic images. Chapter 7, “Format and share your plan,” covers the Copy Picture feature (on the Task tab).
![]() Tip
Tip
Many Office apps—including Word, Excel, and PowerPoint—have a Paste Special feature that gives you more options for pasting data from Project into the destination app. For example, you can use the Paste Special feature in Word to paste formatted or unformatted text or a picture. You can also choose to paste only the data or paste it with a persistent link back to the source data. When the data is pasted into Project with a persistent link, the data in Project can be updated whenever the source data changes. When pasting data into calculated fields, such as start and finish dates, use the paste link option with care and verify that you get the results you want.
These techniques are useful for selecting tabular data in Project:
To select a range, select the upper-left corner of the range, hold the Shift key, and then select the value in the lower-right corner of the range you want to select.
Select the Select All button in the upper-left corner of a table. Project selects the entire table, although only cells that contain values are copied.
Pasting rich tabular data from Project does not work the same way in all programs. If you paste Project data into Notepad, for example, the result is tab-delimited data with no column headings. Feel free to experiment with this.
You also have options when pasting data from other source programs into Project:
You can paste a graphic image from another program into a graphical portion of a Gantt chart view. You can also paste a graphic into a task, resource, or assignment note into a form view, such as the Task or Resource Form views, or into a report.
You can paste text (such as a list of task or resource names) into a table in Project. For example, you can paste a range of cells from Excel or a group of paragraphs from Word into Project. Additionally, you can paste a series of task names that are organized in a vertical column from Excel or Word into the Task Name column in Project.
Pasting text as multiple columns into Project requires some planning. First, make sure that the order of the information in the source program matches the order of the columns in the Project table. You can either rearrange the data in the source program to match the column order in the Project table or vice versa. Second, make sure that the columns in the source program support the same types of data (for example, text, numbers, and dates) as do the columns in Project.
If you need to paste a set of task or resource names into Project, you can work with partial data. For example, if you paste only a set of task names into Project, Project gives them an estimated 1-day duration and schedules them to start on the plan’s start date. You can then update the new tasks’ schedule details as needed.
To copy tabular data from Project to another program
In Project, organize the data you want to copy (for example, switch to the table that contains the fields you want).
Select the range of data you want. Then, on the Task tab, in the Clipboard group, select Copy. Project copies the selected range to the clipboard.
Switch to the destination program and paste the data. If the destination program supports it, you can experiment with pasting formatted or plain text.
To paste tabular data from another program into Project
In the source program, select and copy the data you want to paste into Project. If you need to copy multiple columns, make sure that the tabular data is organized into the correct field order you need in Project.
Switch to Project and select the cell in the table that you want to contain the first value of the first row of the data to be pasted. If you need to paste multiple columns, make sure that the field order you have in the Project table corresponds to how the copied data is organized.
To paste the copied data, on the Task tab, in the Clipboard group, select Paste. Project pastes the data into the table.
![]() Tip
Tip
To avoid using formatting from the source program, you can paste the data as text only. From the Paste list, choose Paste Special and then select Text Data to paste without formatting.
To paste a graphic image from another program into Project
In the source program, copy the image you want to paste into Project.
Do any of the following:
To paste the copied image into the chart portion of a Gantt chart view, select the chart portion and then, on the Task tab, in the Clipboard group, select Paste. Project pastes the image. You can then reposition or resize the image.
To paste the copied image into a task or resource note, open or create the note. Select in the Notes field and press Ctrl+V.
To paste the copied image into a report, open the report. Select an empty area of the report to make sure none of the report’s elements are selected, and then press Ctrl+V or, on the Task tab, in the Clipboard group, select Paste.
Open files in other formats in Project
Information that you need to incorporate into a plan in Project can come from a variety of sources. Two examples are a task list from a spreadsheet and a resource list from a database. You might want to use the unique features of Project to analyze data that originates from another program. For example, many people keep to-do lists and simple task lists in Excel; however, accounting for basic scheduling issues, such as distinguishing between working and nonworking time, is impractical in Excel. You might find that simply copying data from other source programs and pasting it into Project is fine for one-time data sharing. On the other hand, if you need to frequently share the same type of data, or if its structure is too complex for copying and pasting, sharing via a data file might be a better option.
When saving data to or opening data from files in other formats, Project uses maps (also called import/export maps or data maps) that specify the exact data to import or export and determine how to structure it. You use data maps to specify how you want individual fields in the source program’s file to correspond to individual fields in the destination program’s file. After you set up an import/export map, you can use it as often as you want.
Project uses a feature called the Import Wizard, displayed in Figure 19-3, to guide you through creating the correct data map for the data you want to import.
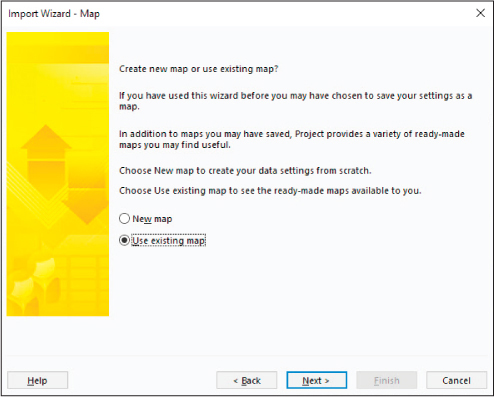
FIGURE 19-3 When importing files in other formats into Project, you can move forward and backward in the Import Wizard to set the data mapping options you want.
The Import Wizard uses maps to organize how structured data in another file format is imported into Project. When you import a task list from Excel, for example, the Import Wizard shows you what the imported task list will contain. See Figure 19-4 for the Task Mapping dialog of the Import Wizard.
![]() Tip
Tip
On the Task Mapping page of the Import Wizard, if you see Out of Context messages displayed, check the source worksheet name and make sure it matches the Excel sheet where your data is saved.
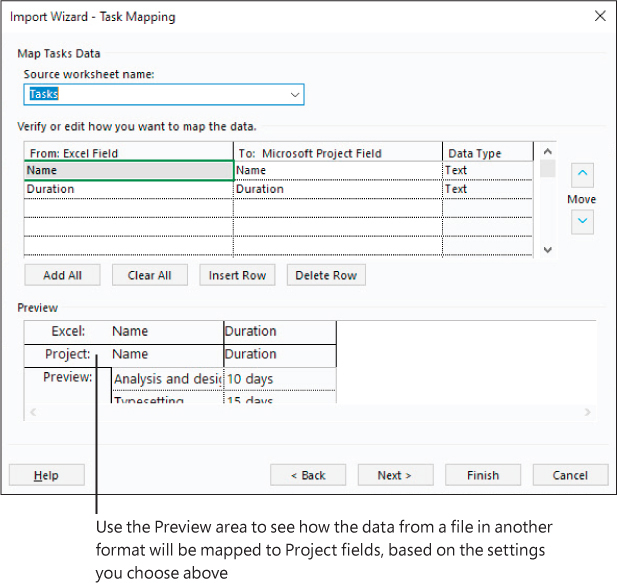
FIGURE 19-4 On the Task Mapping page of the Import Wizard, you specify how Project imports data from other file formats—in this case, an Excel workbook.
When you import the data, it’s ready for more detailed work, such as setting up task relationships. See Figure 19-5 for an illustration of imported data.
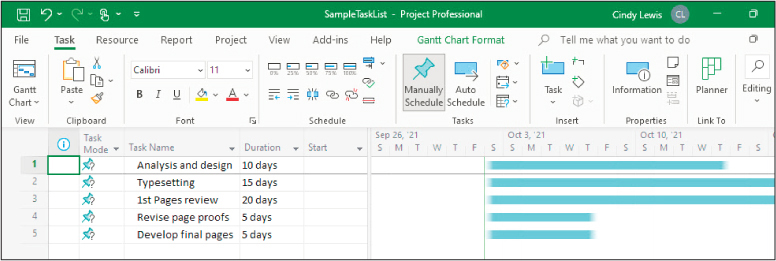
FIGURE 19-5 This imported task list is ready for schedule fine-tuning.
![]() Important
Important
Project has a security setting that might prevent you from opening or saving files from previous versions of Project or files in other nondefault formats. Changing this setting is covered later in this section.
To open a file that’s in another format
Select the File tab to display the Backstage view, and then select Open.
Select Browse and navigate to the location of the file you want to open.
In the file type box (which is initially labeled Projects (*.mpp)), in the dropdown list, select the file format you want.
 Tip
TipYou can scroll through the file type box to see the file formats that Project can import data from. If you work with programs that can save data in any of these file formats, you can import their data into Project.
Select the file you want, and select Open to start the Import Wizard. The wizard guides you through the steps required to import structured data from a different format into Project.
Complete the steps in the Import Wizard and select Finish. Project imports the data.
To change your legacy file format setting for opening files in other formats
In Project, select the File tab to display the Backstage view; then select Options to open the Project Options dialog.
Select Trust Center.
 Important
If you need to edit your legacy file format setting, do so only when you need to work with legacy file formats that you know come from a trusted source. Your capability to edit your legacy file format setting in the Trust Center (as described here) might be blocked by a setting within your organization.
Select Trust Center Settings to open the Trust Center dialog, as shown in Figure 19-6.
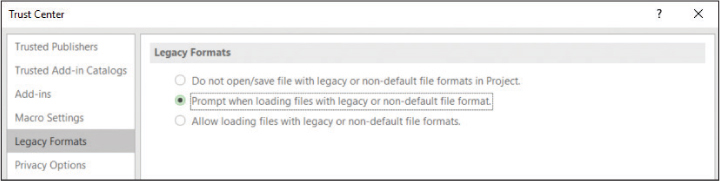
FIGURE 19-6 Use the Legacy Formats page in the Trust Center dialog to control how Project responds when you attempt to open or save files in other formats.
Select Legacy Formats.
Under Legacy Formats, select the option you want.
Select OK to close the Trust Center dialog; then select OK again to close the Project Options dialog.
Save to other file formats from Project
Earlier, we described how to paste Project data into other programs. This technique might suffice for one-time or infrequent needs, but it might not work as well if you must export a large volume of data from Project. In this case, you can save Project data in different file formats. You can accomplish this as follows:
You can save the entire project in Extensible Markup Language (XML) format for structured data exchange with other programs that support XML.
You can save only the data you specify in a different format. The supported formats include Excel workbooks and tab- or comma-delimited text. When saving to these formats, you choose the format in which you want to save, choose a built-in export map (or create your own), and export the data.
![]() Tip
Tip
You can also save the active view to an archival format such as XPS or PDF that preserves layout and formatting but is generally not editable. For more information, see Chapter 16, “Format and print views: In-depth techniques.”
When you need to export Project data to another file format, the current view displayed in Project is irrelevant; the current view doesn’t affect what data can or cannot be exported.
You begin on the Export page in the Backstage view, as shown in Figure 19-7. Here you can see the major categories of file types that Project supports.
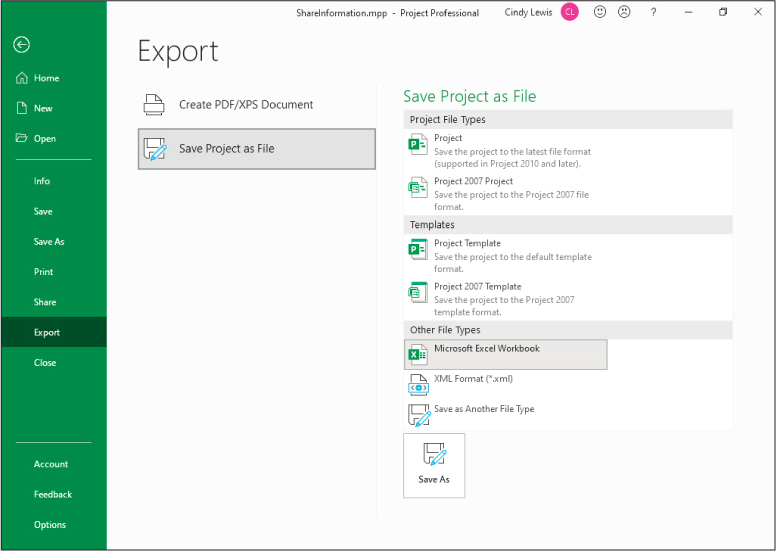
FIGURE 19-7 You can find the export file formats that Project supports on the Export page of the Backstage view.
The following are the supported file types:
The current Project file format, which spans Project 2010 through Project Online desktop client
The Project 2007 file format
Project templates for both groups of Project formats
Excel workbook format
XML format
Other file types, such as text (tab-delimited) or comma-separated value (CSV) formats
If you select any of the Project formats or the XML format, Project immediately exports the plan’s data. The other file formats require data maps, as Figure 19-8 shows, to control how individual fields from the active plan are organized when exported.
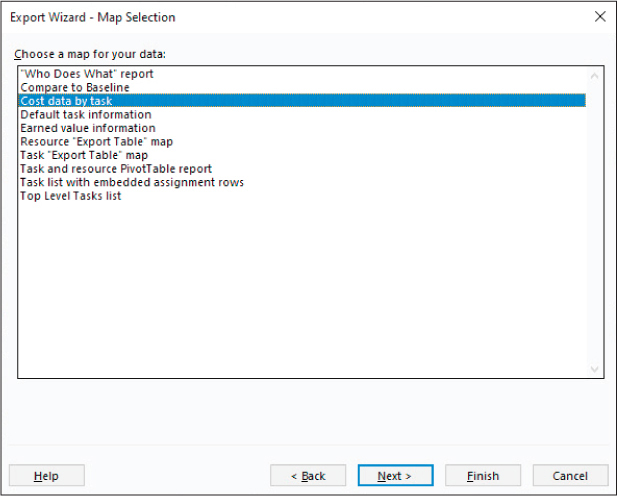
FIGURE 19-8 You can experiment with the available data maps to find what works best when you want to export data from Project.
When you begin the export process for a format that requires a data map, you work through the Export Wizard. In this wizard, you either define a new data map, use one of the built-in data maps in Project, or use a data map you’ve created previously.
As you progress, the Export Wizard shows you the detailed field mapping to be applied for the export, as Figure 19-9 shows.
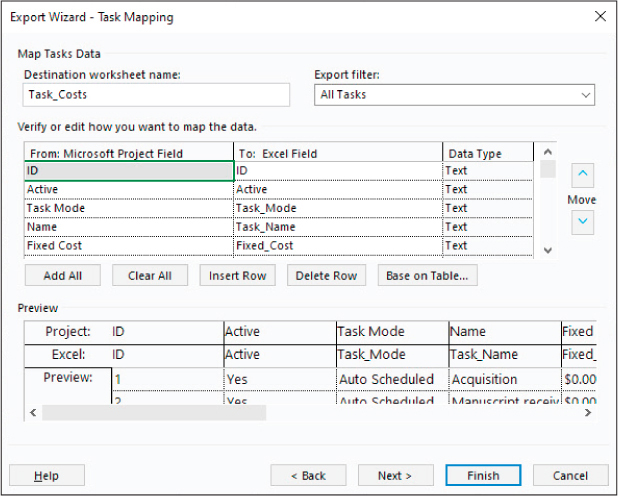
FIGURE 19-9 After you select a specific data map, you can preview and adjust its field mapping details on this page of the Export Wizard.
The built-in data maps in Project are extensive, but if they don’t meet your needs, you can build your own. Data map–based exporting is especially useful when you must repeatedly export large volumes of Project data to feed into other programs or systems.
![]() Important
Important
Project has a security setting that might prevent you from opening or saving files from previous versions of Project or files in other nondefault formats. You can change this setting, as described in the previous topic.
To save data in another file format
Select the File tab to display the Backstage view, and then select Export.
Select Save Project as File. In the Save Project as File area, you can see some of the supported file types.
In the Save Project as File area, select the format that you want and then select Save As.
ImportantDepending on the file format you select and your legacy file format setting in the Trust Center, a confirmation message box might appear.
If the file type you selected does not require a data map, Project generates the exported file.
If the file type you selected requires a data map, the Export Wizard starts. This wizard guides you through the steps required to export structured data from Project into a different format. Complete the steps in the Export Wizard, and then select Finish. Project exports the data.
Generate reports with Excel and Visio
Project can generate data visualizations that focus on sharing schedule details with other programs. Specifically, you can use the Visual Reports feature to export data from Project to either Excel or Visio; when the data is there, you can then visually represent schedule details in compelling formats.
![]() Tip
Tip
Some visual reports (especially reports generated in Excel) are similar to the built-in reports available in Project. You might find visual reports beneficial when you want to do more complex data analysis in Excel.
A visual report can include task, resource, or assignment details. As Figure 19-10 shows, you can see all available visual reports listed in the Visual Reports dialog.
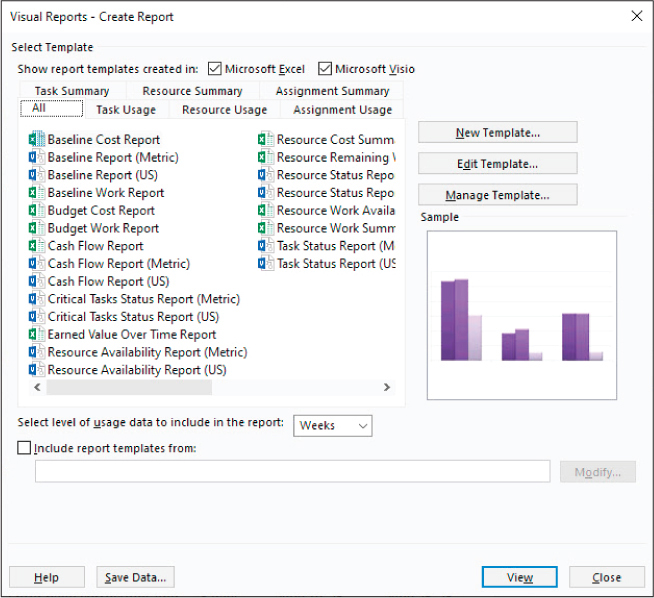
FIGURE 19-10 The Visual Reports dialog lists the reports available for Excel or Visio, if those programs are installed on the same computer as Project.
![]() Tip
Tip
To see the complete list of reports, you must have installed Excel and Visio Professional (or their equivalent subscription versions).
The Visual Reports dialog groups visual reports in multiple ways: all reports; only Excel or only Visio reports; and task, resource, or assignment details (divided into summary and usage reports). The dialog includes a simplified preview of the type of graphic (chart or diagram) associated with each visual report.
When you select a visual report in Project, the Visual Reports feature generates a highly structured database, called an Online Analytical Processing (OLAP) cube, from your plan. Project then starts either Excel or Visio (depending on the visual report you selected), loads and organizes the data used by that program, and generates a graphical representation of that data (an Excel chart or a Visio diagram).
The specific results you obtain depend on the type of visual report you choose:
Excel visual reports use the PivotChart and PivotTable features in Excel (see Figure 19-11). You can format the chart and modify the details in the PivotTable report from which the chart is derived. PivotTable reports are well suited for analyzing and summarizing the large volumes of data that plans can contain.
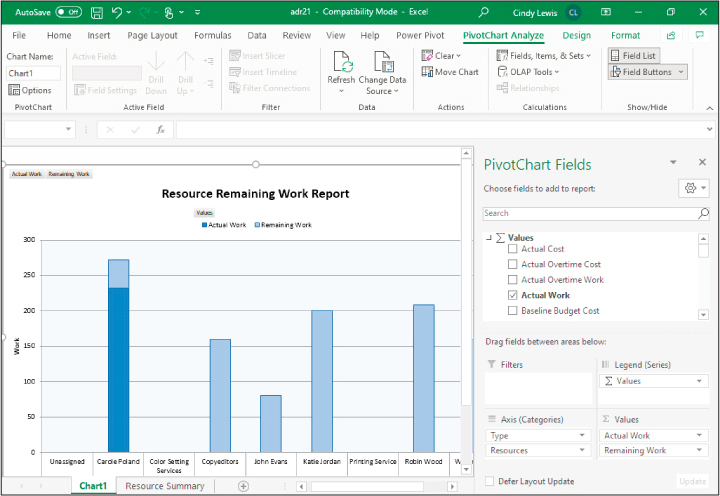
FIGURE 19-11 A Project visual report for Excel generates a PivotChart.
Visio visual reports use the PivotDiagrams feature in Visio. You can see in Figure 19-12 that PivotDiagrams are well suited for presenting hierarchical data and can complement the Project summary/subtask outlines. Not only can you customize the visual report as a Visio diagram, but you can also filter and rearrange the data from which the diagram is derived.
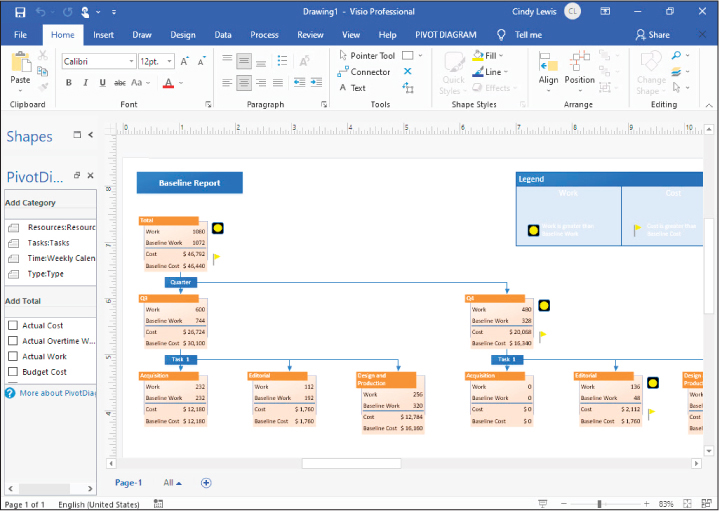
FIGURE 19-12 A Project visual report for Visio generates a PivotDiagram.
Project includes several Excel and Visio visual report templates. You can also create your own visual reports from scratch or modify one of the supplied templates. Visual reports can be beneficial to any Project user. If you’re already familiar with Excel PivotTables or are a Visio power user, and you need to analyze and present Project data, you’ll find visual reports especially interesting.
To generate a visual report (requires Excel or Visio)
On the Report tab, in the Export group, select Visual Reports to open the Visual Reports dialog.
Next to Show report templates created in, select the checkbox or boxes for the supported visual reports you want to see: Excel, Visio, or both.
Select the tab of the report type you want.
Select the specific report you want, and then select View. Project generates the data required by this report, starts Excel or Visio, and creates the report.
![]() Tip
Tip
Project sets the detail level to weeks when generating your visual report. To change this setting, in the Visual Reports dialog, in the Select level of usage data to include in this report <Timeframe> box, as shown in Figure 19-10, select a different option.
Skills review
In this chapter, you learned how to
Copy Project data to and from other programs
Open files in other formats in Project
Save to other file formats from Project
Generate reports with Excel and Visio

Practice tasks
The practice files for these tasks, ShareInformation and SampleTaskList (an Excel file), are located in the ProjectDesktopSBSCh19 folder. For practice file download instructions, see the introduction to this book.
![]() Important
Important
If you’re running Project Online desktop client or Project Professional, make sure that Project is not connected to Project Web App and is instead set to Computer mode. For more information, see Appendix C, “Integration with Microsoft 365 solutions for collaboration.”
Copy Project data to and from other programs
The scenario: at Lucerne Publishing, you want to share task list data from Project with a word processing program. Open the ShareInformation plan in Project and perform the following tasks:
In the Entry table on the left side of the Gantt Chart view, select the cell range from the name of task 5, Editorial, through the finish date for task 13, Oct 13, ‘25.
Copy the tasks to the clipboard.
Start Word (or a comparable word-processing program), create a new document, and then paste the copied tasks into the new document. Use the default paste option. See Figure 19-13 for the pasted results.
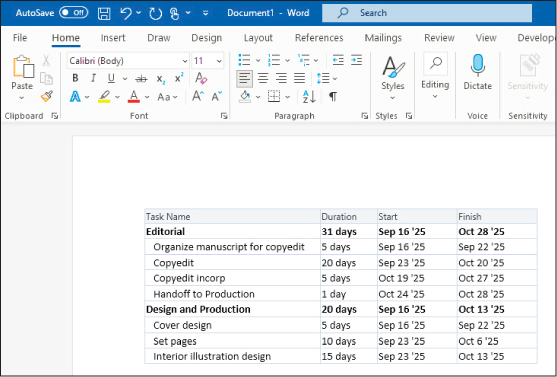
FIGURE 19-13 If you have Word, your screen now looks like this.
Open files in other formats in Project
![]() Important
Important
If the computer you’re using doesn’t have Excel installed, you can’t complete the first two steps of this exercise.
The scenario: a colleague has sent you an Excel workbook that contains her recommended tasks and durations of activities for some work that Lucerne Publishing might do in the future. You want to import this data into Project. Continuing in the ShareInformation plan, perform the following tasks:
Before importing the data into Project, you want to review it in Excel. In Excel, open the workbook named SampleTaskList from the Ch19 practice file folder, as shown in Figure 19-14.

FIGURE 19-14 The Excel workbook you import into Project.
The important points to note about the SampleTaskList workbook are the names and order of the columns, the presence of a header row (the labels at the top of the columns), and the fact that the data is in a worksheet named Tasks.
When you’re finished reviewing the workbook, close it without saving it.
In the Open dialog in Project, navigate to the practice file folder.
In the file type box (initially labeled Projects (*.mpp)), in the dropdown list, select Excel Workbook.
Select the SampleTaskList file, and then select Open to start the Import Wizard. Select Next to move past the introduction.
On the Import Wizard – Map page, specify that you want to use an existing map.
On the Import Wizard – Map Selection page, specify that you want to use the Default task information map.
On the Import Wizard – Import Mode page, specify that you want to import the data into a new project.
On the Import Wizard – Map Options page, specify that you want to import tasks data; instruct Project that the import includes headers.
On the Import Wizard – Task Mapping page, specify that Tasks is the source worksheet name (see Figure 19-15). Review the Excel to Microsoft Project field mapping in the Preview area, and then select Next.
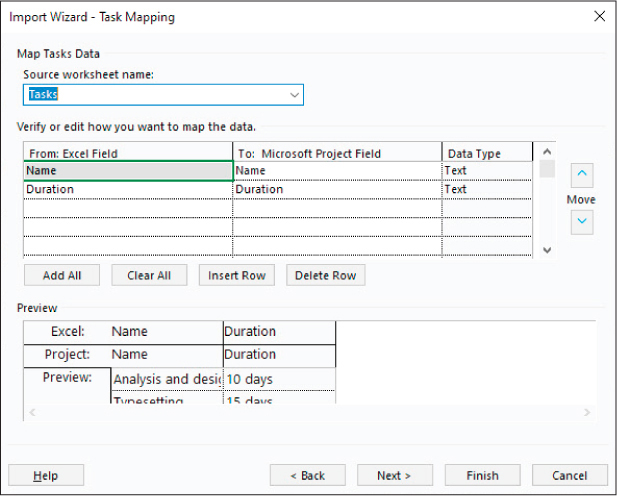
FIGURE 19-15 On the Task Mapping page of the Import Wizard, note the Source worksheet name value.
Finish the Import Wizard and review the resulting task list, as shown in Figure 19-16. The tasks will be manually scheduled, with various durations, and the Gantt bars will all start at the new plan’s start date (today’s date).

FIGURE 19-16 The task list that you import is scheduled to start at the new plan’s start date, which likely differs from what is shown here.
Close the new plan without saving it and return to the ShareInformation plan.
Save to other file formats from Project
![]() Important
Important
If the computer you’re using doesn’t have Excel installed, you can’t complete the last two steps of this exercise.
The scenario: a financial planner has requested some project data in Excel format. Continuing in the ShareInformation plan, perform the following tasks:
Export the plan to a new Excel workbook. Name the workbook ShareInformationExport and save it in the practice file folder (or your preferred location for saving).
As you do so, use the Export Wizard to specify these data export options:
Export selected data
Use the existing data map named Default task information
Export task data and include headers
Use the destination worksheet name Tasks Data
When you complete the export from Project, open the ShareInformationExport workbook in Excel (see Figure 19-17).
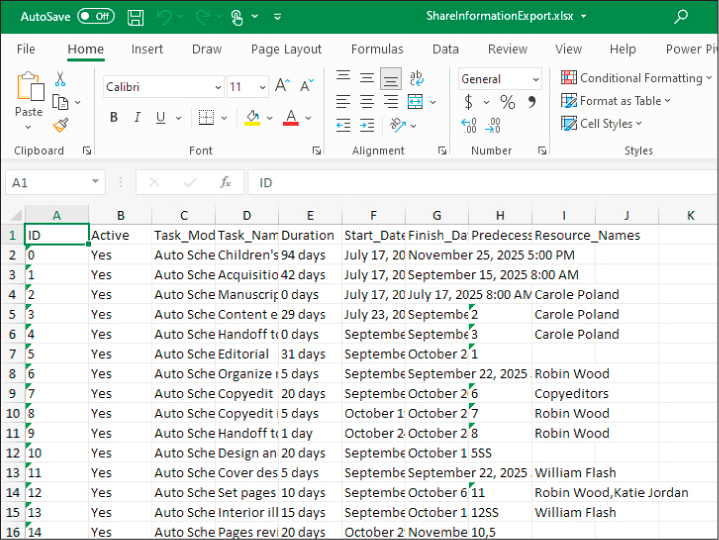
FIGURE 19-17 The Excel workbook exported from Project.
Close the ShareInformationExport workbook and return to Project.
Generate reports with Excel and Visio
![]() Important
Important
If the computer you’re using doesn’t have Excel installed, you can’t complete this exercise.
The scenario: a colleague has asked you for some Project data in an Excel PivotChart and PivotTable. You decide to generate a visual report. Continuing in the ShareInformation plan, perform the following tasks:
In Project, generate the Resource Remaining Work Report. Set the usage data in the report to Weeks.
View the report in Excel.
Select anywhere on the chart to open the PivotChart Fields pane (see Figure 19-18).

FIGURE 19-18 The Excel workbook generated from a Project visual report.
Close the Excel workbook without saving it and return to Project.