7
Format and share your plan
In this chapter
In some respects, a Project plan is really a database of information, not unlike a Microsoft Access database file. You don’t usually see all the data in a plan at one time. Instead, you focus on the aspect of the plan you’re currently interested in viewing. Views and reports are the most common ways to observe or print a plan’s data. In both cases, you can substantially format the data to meet your needs.
In this chapter, you customize and share common views from Project—views such as the Gantt Chart, which is strongly identified with project management.
Another means of visualizing your schedule is with reports. Reports can include colorful charts and images, in addition to tables. Project includes many reports you can either use as is or customize.
![]() Tip
Tip
This chapter introduces you to some of the simpler view and report formatting features in Project. For more information about formatting, printing, and sharing your plans, see Chapter 13, “Organize plan details”; Chapter 16, “Format and print views: In-depth techniques”; Chapter 17, “Format reports: In-depth techniques”; and Appendix C, “Integration with Microsoft 365 solutions for collaboration.”
This chapter guides you through procedures related to customizing a Gantt chart view, adding tasks to a Timeline view, customizing reports, and copying and printing views and reports.
Customize a Gantt chart view
The Gantt chart became a standard way of visualizing schedules when, in the early 20th century, American engineer Henry Gantt developed a bar chart showing the use of resources over time. For many people, the Gantt chart is the most common visualization of a project’s schedule or plan. In fact, the Gantt chart is a popular and widely understood representation of schedule information throughout the project management world. In Project, the default view is dominated by a Gantt chart. You will likely spend a lot of your time in this type of view when working in Project.
![]() Tip
Tip
By default, when you create a new plan, Project displays a split view named Gantt with Timeline. However, you can change this setting to display any view you want as the default view for a new plan. On the File tab, select Options. In the Project Options dialog, in the Default view box, select the view you want. The next time you create a new plan, the view you have chosen appears.
You might remember from Chapter 2, “Take a guided tour,” that a Gantt Chart view as shown in Figure 7-1 consists of two main parts: a table on the left and a bar chart with a timescale on the right.
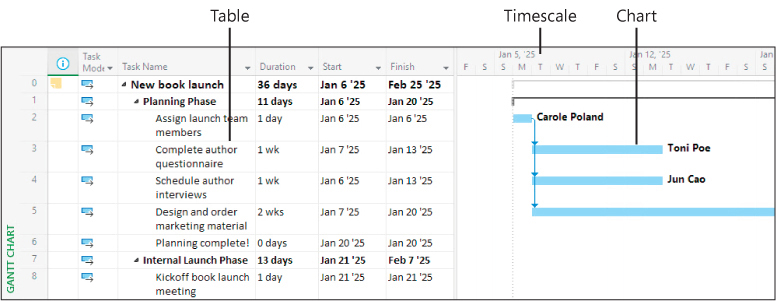
FIGURE 7-1 The major elements of the Gantt Chart view include a table on the left, a chart on the right, and a timescale above the chart.
The bar chart includes an adjustable timescale band across the top that denotes units of time. The bars on the chart graphically represent the tasks in the table in terms of start and finish dates, duration, and status (for example, whether work on the task has started).
On a Gantt chart, tasks, summary tasks, and milestones all appear as Gantt bars or symbols, and each type of bar has its own format. Whenever you work with Gantt bars, keep in mind that they represent tasks in a plan. Other elements on the chart, such as link lines, represent relationships between tasks.
The default formatting applied to a Gantt chart view works well for on-screen viewing, sharing with other programs, and printing. However, you can change the formatting of almost any element on a Gantt chart.
You can format the chart elements in a Gantt chart view in several ways:
As Figure 7-2 shows, you can quickly apply predefined color combinations from the Gantt Chart Style group.
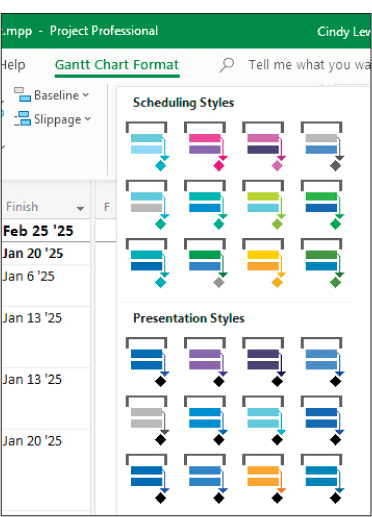
FIGURE 7-2 Use the Gantt chart styles to quickly apply color combinations to a Gantt chart view.
The Gantt Chart styles are divided into two groups:
Scheduling Styles These styles distinguish between manually and automatically scheduled tasks.
Presentation Styles Applying a presentation style to a Gantt chart view is a good option when you don’t want to distinguish between manually and automatically scheduled tasks.
You can apply highly customized formatting to Gantt bars in the Bar Styles dialog shown in Figure 7-3.
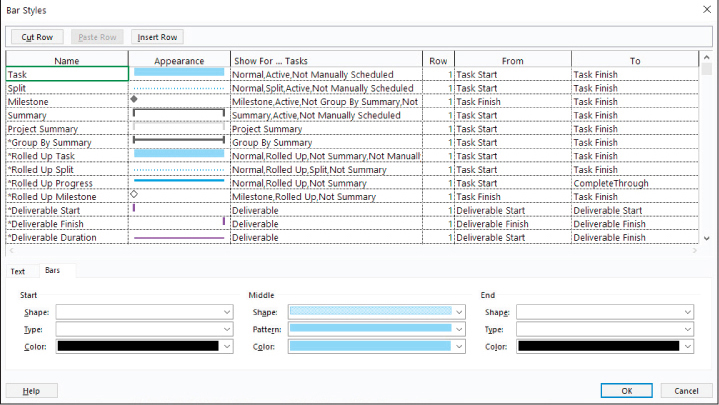
FIGURE 7-3 Use the settings on the Bars tab of the Bar Styles dialog to change the appearance of all instances of a specific type of Gantt bar.
In this case, the formatting changes you make to a particular type of Gantt bar (a summary task, for example) apply to all such Gantt bars in the Gantt chart. Applying or customizing bar styles is a powerful formatting feature; for more information, see Chapter 16, “Format and print views: In-depth techniques.”
You can also format individual Gantt bars directly. The direct formatting changes you make have no effect on other bars in the Gantt chart.
In the table portion of a Gantt chart view, you can format text and cell values. The cell formatting options in Project are similar to those in Microsoft Excel.
To apply a Gantt chart style to Gantt bars
Switch to a Gantt chart view.
On the Gantt Chart Format tab, in the Gantt Chart Style group, select the More button shown in Figure 7-5 to display the predefined color styles.
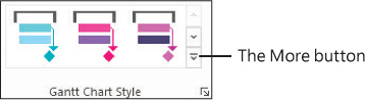
FIGURE 7-5 Select the More button to display all the available Gantt Chart Style options.
Select the style you want.
To format an individual Gantt bar shape
Double-click a Gantt bar.
Or
Select the name of the task whose bar you want to format. Then on the Gantt Chart Format tab, in the Bar Styles group, select Format and then select Bar.
In the Format Bar dialog, select the formatting options you want.
![]() Tip
Tip
A milestone indicator uses just the Start shape options in the Format Bar dialog.
To remove direct formatting from an individual Gantt bar shape
Double-click a previously formatted Gantt bar.
Or
Select the name of the task of the previously formatted Gantt bar. Then on the Gantt Chart Format tab, in the Bar Styles group, select Format and then select Bar.
In the Format Bar dialog, select Reset.
To apply a Text style to tasks
On the Gantt Chart Format tab, in the Format group, select Text Styles.
In the Text Styles dialog displayed in Figure 7-6, in the Item to Change field, select the type of task you want to format.
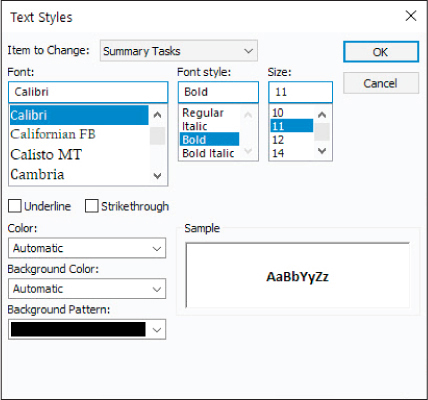
FIGURE 7-6 Use Text Styles to apply formatting to specific types of tasks.
Select the formatting options you want and then select OK.
![]() Tip
Tip
Text styles is a way to quickly apply the same formatting to a task category globally throughout your plan. You still have the option to format individual cells or groups of cells when you need emphasis.
To modify a Text style
On the Gantt Chart Format tab, in the Format group, select Text Styles.
In the Text Styles dialog, in the Item to Change field, select the type of task you want to modify.
Select the formatting options you want and then select OK.
To format a cell or range of cells
In the table portion of a Gantt chart view, select the cell or range of cells you want to format.
On the Task tab, in the Font group, select the formatting options you want.
Or
Select the cell or range of cells you want to format.
Right-click or long-press (tap and hold) the selected cell or range of cells.
As you can see in Figure 7-7, a shortcut menu appears.
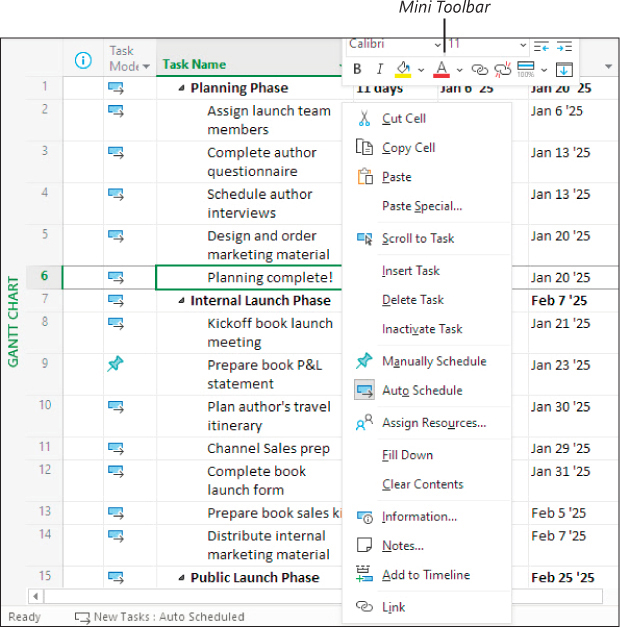
FIGURE 7-7 Right-click a table cell, such as one that includes a task name, to see the shortcut menu and Mini Toolbar.
In addition to the regular shortcut menu, note that the Mini Toolbar appears.
On the Mini Toolbar, select the text or cell background formatting options you want.
To remove all formatting that has been applied to a cell
Select the previously formatted cell or range of cells.
On the Task tab, in the Editing group, select Clear (the button that looks like an eraser) and then select Clear Formatting.
![]() Tip
Tip
Formatting that was applied using Text Styles is not affected with Clear Formatting. You need to return to Text Styles to make changes.
To adjust the timescale in a Gantt chart view
Do either of the following:
On the View tab, in the Zoom group, select Timescale and then select the setting you want.
Use the Zoom Slider in the lower-right corner of the status bar to adjust the zoom setting.
Add tasks to a Timeline view
A Timeline view is best for displaying key tasks and milestones from your plan in a simple and compact format as shown in Figure 7-8. This view is especially well suited for conveying quick summaries of plans and is easily shared with Microsoft PowerPoint presentations, email messages, and other formats beyond Project (you do this later in this chapter). You can add just enough detail to the Timeline view to convey your message, especially to other project stakeholders.
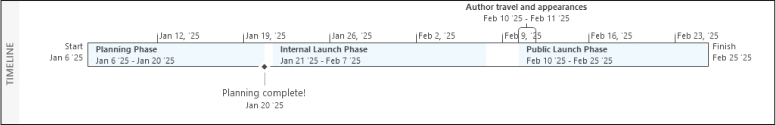
FIGURE 7-8 A thoughtfully populated Timeline view can be your “project at a glance” view.
A Timeline view usually is displayed above the current view. Initially, the Timeline view is empty, even when the plan contains tasks. You select the existing tasks or add new tasks that you want to have included on a Timeline view, and you determine how they should appear.
In fact, you can display multiple Timelines at a time—each one can include different tasks and formatting options. For more information about multiple Timelines, see Chapter 16.
To add existing tasks to a Timeline view
Select anywhere in a Timeline view.
 Tip
TipIf the Timeline is not visible, on the View tab, in the Split View group, select the Timeline checkbox.
Project shifts focus to the Timeline view and displays the Timeline Format tab.
On the Timeline Format tab, in the Insert group, select Existing Tasks.
The Add Tasks to Timeline dialog opens. As Figure 7-9 shows, this dialog contains an outline of the summary and subtasks in the plan.
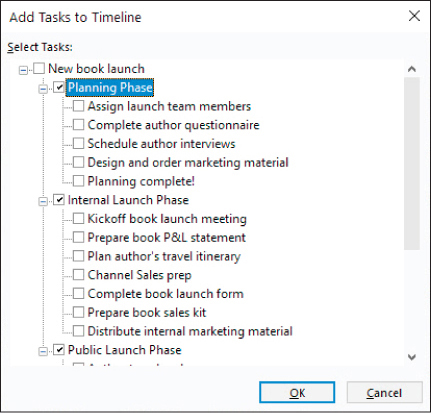
FIGURE 7-9 This dialog is a handy way to quickly add tasks to a Timeline view.
Select the tasks you want to appear on the Timeline, and then select OK.
Or
In the active task view, select the task you want to appear on the Timeline.
On the Task tab, in the Properties group, select Add to Timeline.
Or
Right-click the task and select Add to Timeline in the shortcut menu that appears.
To add a new task to a Timeline view
Select anywhere in a Timeline view.
On the Timeline Format tab, in the Insert group, select Task.
In the Task Information dialog, enter the new task’s information and select OK.
Project adds the new task to the plan. It is now visible in both the Timeline and Gantt Chart views.
To switch task bars to callouts in the Timeline view
Select anywhere in the Timeline view.
Project shifts focus to the Timeline view and displays the Timeline Format tab.
In the Timeline view, select a task bar you want to display as a callout.
TipTo see the full name and other details about a task on the Timeline, point to the task. You can see in Figure 7-10 that its details appear in a ScreenTip.
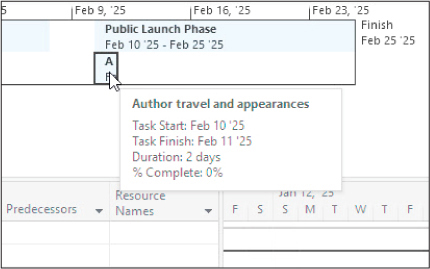
FIGURE 7-10 To see the full name and other details of a task on a Timeline view, point to the task name.
On the Timeline Format tab, in the Current Selection group, select Display as Callout.
Project displays the task as a callout (see Figure 7-11).
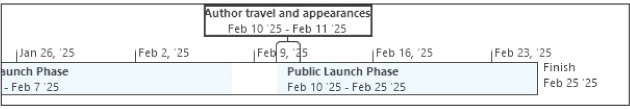
FIGURE 7-11 To give a task on a Timeline greater visibility, format it as a callout.
Customize reports
You can use Project reports to see details of your plans in a variety of ways. Project includes several built-in reports, and you can customize those or create your own for the unique information needs of your project’s stakeholders.
Reports are intended to be used for viewing Project details. You don’t directly edit your plan’s data in a report as you can in a view. However, you can extensively customize what data appears in a report and how it’s formatted.
Consider some of the useful actions you can take:
Create graphical reports within Project instead of exporting the Project data to another program
Include colorful charts and images, in addition to tables, in your reports
Print reports or copy them to other programs
Project includes many reports that you can use as is or customize, or you can create your own unique reports. Unlike most views in Project, a report is more like a blank canvas onto which you place the elements (such as tables or charts) that focus on the information that’s most interesting to you.
A single report can include a dynamic mix of tables, charts, and textual content. For a report example, see Figure 7-13.
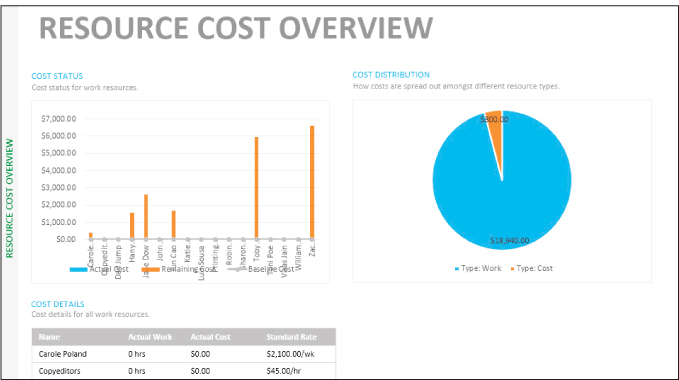
FIGURE 7-13 The Resource Cost Overview report is a great example of a report that includes a mix of data and presentation formats.
You can change both the formatting and the content of charts and tables in a report. As soon as you select a chart (or a table), the Field List pane opens on the right side of the screen. In Chapter 17, “Format reports: In-depth techniques,” you use the Field List to customize the data that is included in reports.
In addition to changing what type of data appears in a chart, you can change its visual appearance. When you select in a report—or in a chart, table, or other element in a report—Project displays tabs unique to the selected element illustrated in Figure 7-14.
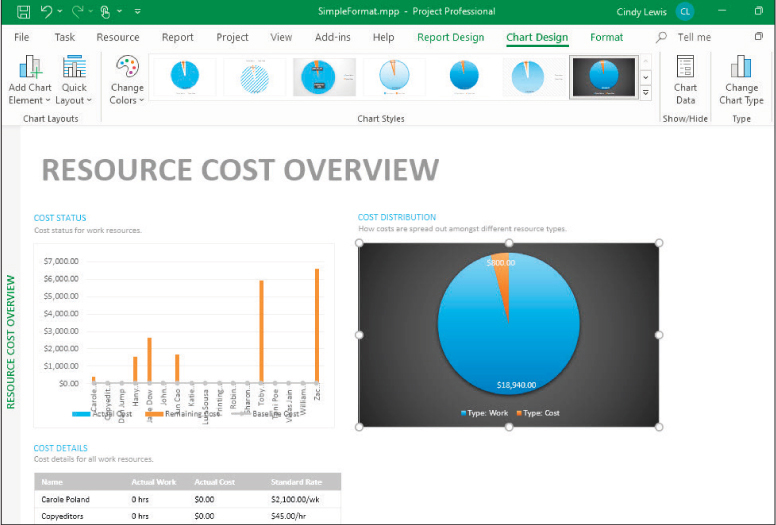
FIGURE 7-14 As you select different elements in a report, the Report Design, Chart Design, Table Design, Format, and Layout tabs give you options specific to the selected element.
![]() See Also
See Also
This topic introduces report formatting. For more details about reports, see Chapter 15, “View and report project status,” and Chapter 17, “Format reports: In-depth techniques.”
To display a report
On the Report tab, in the View Reports group, select a category and then select the specific report you want.
To apply a style to a chart in a report
Display the report that includes a chart that you want to style.
Select anywhere in the chart.
On the Chart Design tab, in the Chart Styles group, select the style you want.
To apply a style to a table in a report
Display the report that includes a table that you want to style.
Select anywhere in the table.
On the Table Design tab, in the Table Styles group, select the style you want.
Copy views and reports
Project supports standard copying and pasting of data, such as a range of task names and details via the clipboard. Sometimes, though, you want to share views from your plans with colleagues who don’t have Project or who prefer a simple schedule snapshot. You can quickly copy most views and reports from Project. Those colleagues then can copy views and reports and paste them into email messages, presentations, and other documents. Views that cannot be directly copied from Project include the Team Planner (Project Online desktop client or Project Professional only), form views (such as the Task Form), and the Relationship Diagram view.
![]() Tip
Tip
If you need a visual snapshot of a view or report that cannot be directly copied from Project, use a screen capture utility.
Both Gantt charts and Timeline views are well suited for sharing schedule details. The Timeline is a concise “project at a glance” view, and the Gantt chart is a widely used format of schedules.
Reports are also well suited for sharing with other project stakeholders. Reports can be especially effective in conveying your plan’s information in charts that you might otherwise need to create in Excel.
![]() Tip
Tip
When copying a Timeline view or any report to a Microsoft Office (or Microsoft 365) program, you have some choices about what gets pasted. The Office programs support pasting a graphic image or pasting editable elements of the copied Timeline or report.
To copy a view
Use this technique to copy a Gantt chart and most other views in Project.
Set up the view the way you want it to appear when copied. For example, in a Gantt chart view, you can scroll to display the range of tasks you want to copy and their Gantt bars.
TipYou can quickly scroll the Gantt chart to display the Gantt bars of the selected task. On the Task tab, in the Editing group, select Scroll to Task.
On the Task tab, in the Clipboard group, select the arrow next to Copy, and then select Copy Picture.
The Copy Picture dialog opens, as shown in Figure 7-15.
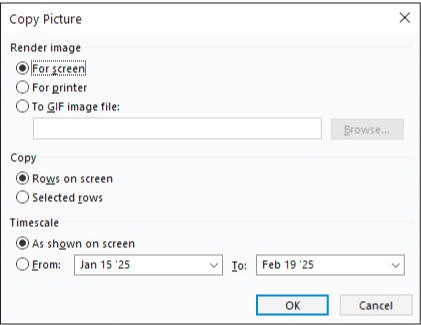
FIGURE 7-15 Use the options in the Copy Picture dialog to generate the image you want to copy.
In this dialog, you can control how Project copies details from the plan to the clipboard or saves it to a file. The first two options under Render image control the size and resolution of the view you copy; the third option enables you to save the copied image as a Graphics Interchange Format (GIF) image file. The options under Copy and Timescale let you fine-tune what you want to copy. The Timescale options are not available when you are copying views that don’t include a timescale, such as Sheet views.
Select the copy options you want and select OK.
Project copies a graphic image of the view to the clipboard. You can then paste it into another program.
To copy a Timeline view
You copy most other views in Project much like you do a Gantt chart view. The Timeline view, however, has unique options for copying. You can copy the Timeline at different resolutions and levels of detail, depending on the destination you have in mind.
Select anywhere in the Timeline view.
With the focus now on the Timeline, the label of the Gantt Chart Format tab changes to Timeline Format.
On the Timeline Format tab, in the Copy group, select Copy Timeline.
The Copy Timeline options appear, as Figure 7-16 shows.
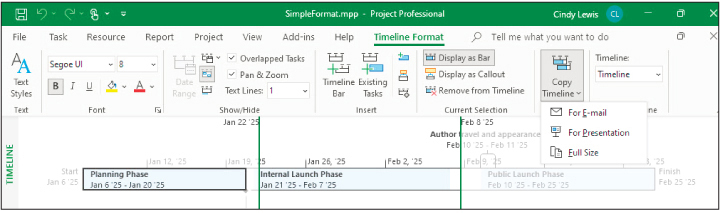
FIGURE 7-16 When you’re copying a Timeline view, Project includes handy options to optimize the image for the destination format you have in mind.
Select the sizing option you want.
Project copies the timeline to the clipboard.
TipYou can quickly switch the Timeline view between a more or less detailed format. Select anywhere in the Timeline view and then, on the Timeline Format tab, in the Show/Hide group, select Detailed Timeline.
To copy a report
On the Report tab, in the View Reports group, display the report you want.
Select anywhere in the report and then, on the Report Design tab, in the Report group, select Copy Report.
Project copies a graphic image of the entire report to the clipboard.
![]() Tip
Tip
To copy just one chart or other element from a report, right-click the outer edge of the element you want and, in the shortcut menu that appears, select Copy.
Print views and reports
In addition to sharing your plan’s information by copying and pasting, you can print most views and all reports. The views that you cannot print include the form views and the Relationship Diagram.
For a plan with many tasks, you might be able to see only a relatively small portion of the full plan on your screen at one time. Printing from Project can require quite a bit of paper; in fact, some heavy-duty Project users make poster-size printouts of their plans by using plotters. Whether you use a printer or a plotter, it’s a good idea to preview the views and reports you intend to print.
You have several options when printing from Project, such as printing a specific date range in a Gantt chart view (described later in this topic). You can also control what will print in a view before you print it by filtering or collapsing tasks or by displaying only summary tasks. (See Chapter 13, “Organize plan details.”) You work with these options in the Print window. This topic describes some of the most useful options.
Start with the page navigation buttons in the lower-right corner of the screen, which you can see in Figure 7-17.
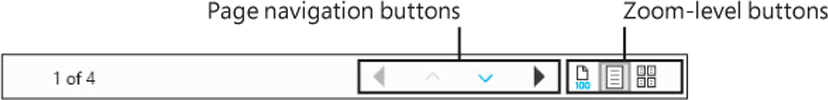
FIGURE 7-17 Use the page navigation and zoom controls in the lower-right corner of the Print window to control what is displayed.
To preview a broader view of the output, you can switch to a multipage view. When you do, the full view or report appears in the Print window. Assuming that you have a letter-size sheet as your selected paper size, you might see the view or report spread across several sheets.
With timescaled views such as the Gantt Chart view, you can be more selective. You can adjust the preview using the Settings options to include just the portion of the view that covers a specific date range.
For example, you can set a Gantt chart’s options in the Print window displayed in Figure 7-18 to show just a specific date range.
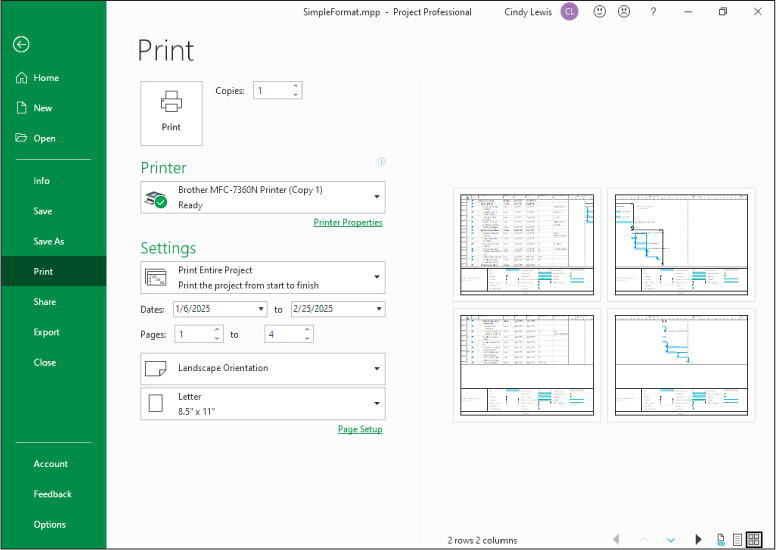
FIGURE 7-18 Use the Print options to control how a Gantt chart view appears when printed.
Compared to views, a report can be a more compact way to print information about your plan. Reports use commonly understood formats, such as tables and charts, to organize and present information.
Printing reports in Project is mainly a “what you see is what you get” action. Project offers some report-specific printing options on the Report Design tab (which is visible when you tap or click in a report).
The Page Breaks command is especially useful when you intend to print a report. It draws dashed lines in the report that tell you how it will print across pages based on the current page settings. Other options available on the Report Design tab in the Page Setup group, such as margins and paper size, can be useful as you design your report.
![]() Tip
Tip
Some views, such as form views and the Relationship Diagram view, cannot be printed from Project. However, you can use a screen-capture utility to capture a snapshot of such a view and then print that.
To print a view
On the View tab, in the Task Views group, display the view you want to print.
On the File tab, select Print.
The Print page of the Backstage view appears, with the view in the preview.
Select the options you want, and then select Print.
To print a report
On the Report tab, in the View Reports group, display the report you want to print.
On the File tab, select Print.
The Print page of the Backstage view appears, with the report in the preview.
Select the options you want, and then select Print.
To adjust page setup options in a report
Display the report whose page setup options you want to adjust.
Select the Report Design tab.
In the Page Setup group, note the four commands available.
Do any of the following:
Select Page Breaks to see where the page breaks occur in the report based on your currently selected paper size.
Select Margins to adjust the page margins of the report when printed.
Select Orientation to switch the report between landscape (horizontal) and portrait (vertical) layout.
Select Size to select your paper size.
Skills review
In this chapter, you learned how to
Customize a Gantt chart view
Add tasks to a Timeline view
Customize reports
Copy views and reports
Print views and reports

Practice tasks
The SimpleFormat practice file for these tasks is located in the ProjectDesktopSBSCh07 folder. For practice file download instructions, see the introduction to this book.
![]() Important
Important
If you’re running Project Online desktop client or Project Professional, make sure that your Project is not connected to Project Web App and is instead set to Computer mode. For more information, see Appendix C, “Integration with Microsoft 365 solutions for collaboration.”
Customize a Gantt chart view
The scenario: at Lucerne Publishing, you’re almost finished planning the new book launch project, and the team is about to commence work. You want to format the plan to highlight a key milestone. You also want a few other details from the plan to stand out visually. Open the SimpleFormat plan in Project and perform the following tasks:
In the Gantt Chart view, scroll to the manually scheduled task 9, Prepare book P&L statement. The task and related Gantt bar are shown in Figure 7-19.

FIGURE 7-19 The default formatting of the Gantt bars for manually scheduled tasks differs from the default formatting of automatically scheduled tasks.
As you can see, the Gantt bar of this manually scheduled task does not look like the Gantt bars of the automatically scheduled tasks. Keep an eye on this Gantt bar as you apply a different Gantt chart style to the plan.
Apply the predefined orange color style (the second style from the right or the second from last, depending on your screen resolution) from the Presentation Styles area of the style gallery. You can see the formatting results in Figure 7-20.
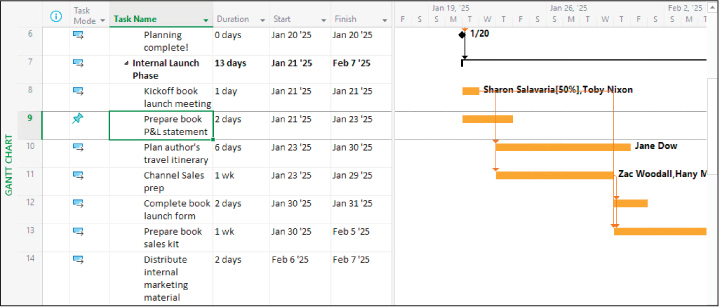
FIGURE 7-20 After a presentation style is applied, the Gantt bars of both manually and automatically scheduled tasks are formatted the same.
Project changes the formatting of all Gantt bars. The Gantt bar of task 9, the manually scheduled task, is no longer visually distinct from the Gantt bars of the automatically scheduled tasks.
Task 6 is a milestone task that describes the end of the first phase of the new book launch at Lucerne Publishing. You want to highlight this task name. Apply italic text formatting and a yellow background color (the default color when selecting the Background Color command) to the name of task 6, Planning Complete! As Figure 7-21 shows, the task formatting has been applied.
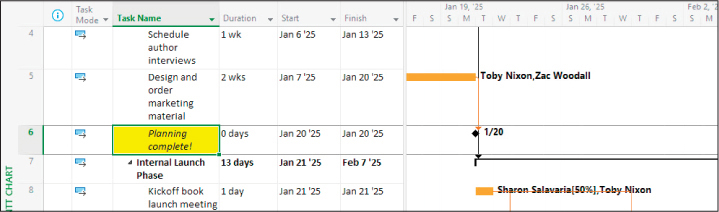
FIGURE 7-21 The text and background formatting of a task name can make it stand out.
Now the milestone task name stands out.
Notice that a shape appears instead of a Gantt bar in the Gantt chart area for task 6. This is because the task is a milestone task. Format the Gantt bar (shape) of task 6 to be a star shape as indicated in Figure 7-22.
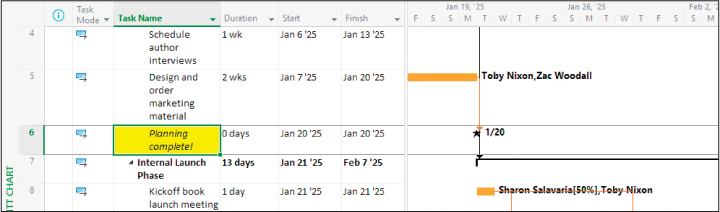
FIGURE 7-22 Formatting a milestone’s shape can make it stand out in a Gantt chart.
Add tasks to a Timeline view
The scenario: you know from past experience that some of the stakeholders of the new book launch project will find your Gantt chart view more detailed than they like. To help such stakeholders see the key details you want to convey, you decide to build a Timeline view. Later, you’ll copy the Timeline view to another program as a quick “project at a glance” image. Continuing in the SimpleFormat plan, perform the following tasks:
Add the following existing tasks to the Timeline:
Planning Phase
Planning complete!
Internal Launch Phase
Public Launch Phase
Author travel and appearances
In the Timeline view, switch the task bar for Author travel and appearances to a callout so that its full title is visible, as shown in Figure 7-23.
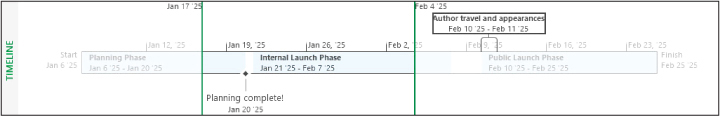
FIGURE 7-23 Give distinct focus to certain tasks on the Timeline by formatting them as callouts.
Customize reports
The scenario: you want to share the Resource Cost Overview report with the team. However, you want to change the formatting of some elements in the report. Continuing in the SimpleFormat plan, perform the following tasks:
Display the Resource Cost Overview report shown in Figure 7-24.
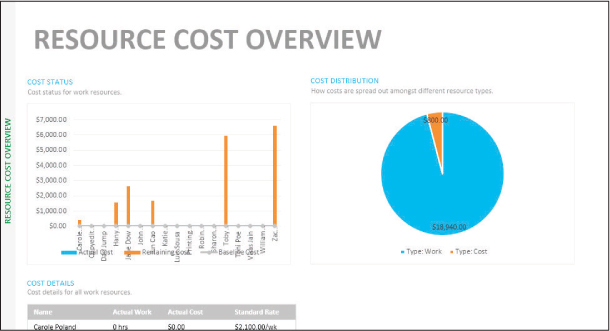
FIGURE 7-24 This report includes chart and table elements; both types of elements support extensive formatting.
Apply the black background chart style (style 7) to the pie chart.
Apply the gray background table style (themed style 1, accent 3, located under Best Match for Document in the top row) to the table. You can see the results of the chart formatting in Figure 7-25.
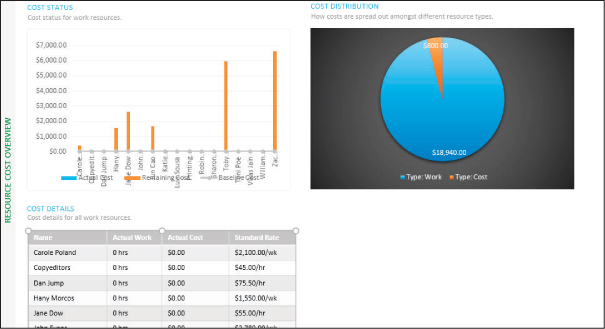
FIGURE 7-25 Use the Table Design tab to change the formatting of the selected report element.
Copy views and reports
The scenario: you want to share snapshots of key views and a report from the plan via email or Microsoft Word documents. Continuing in the SimpleFormat plan, perform the following tasks:
Display the Gantt Chart view so that the Gantt bars of tasks 7–14 are visible.
Copy a picture of tasks 7–14. Render the picture for the screen.
Paste the image into a new document or email message.
Copy a full-sized image of the detailed Timeline with Pan and Zoom disabled.
Paste the Timeline as a picture into the same document or email message below the previous image.
Copy the Resource Cost Overview report, and paste it as a picture into the same document or email message below the last image.
Adjust the size and position of the images as desired. The resulting document created for sharing is shown in Figure 7-26.
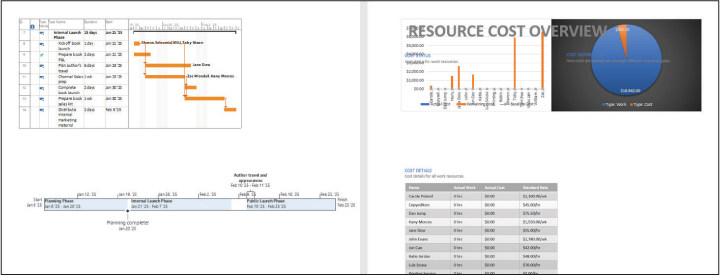
FIGURE 7-26 You can copy most views and other elements you see in Project.
Print views and reports
The scenario: you want to print views and reports from the plan to post to the wall space for the team to mark with feedback or clarifications. Continuing in the SimpleFormat plan, perform the following tasks:
Display the print preview of the full Gantt Chart view, set to multiple pages as shown in Figure 7-27.
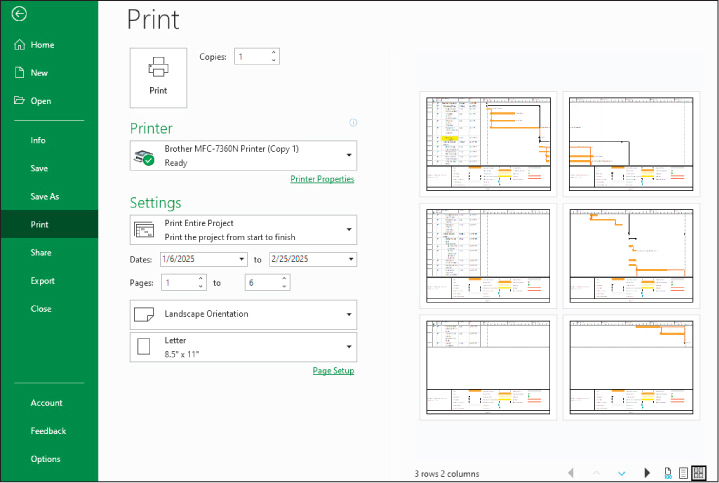
FIGURE 7-27 When previewing a large view or report, use the page navigation and zoom controls to manage what is displayed. The display might differ, depending on your selected printer and paper size.
Go back to Gantt Chart view.
Display the Resource Cost Overview Report.
Display page breaks as shown in Figure 7-28.
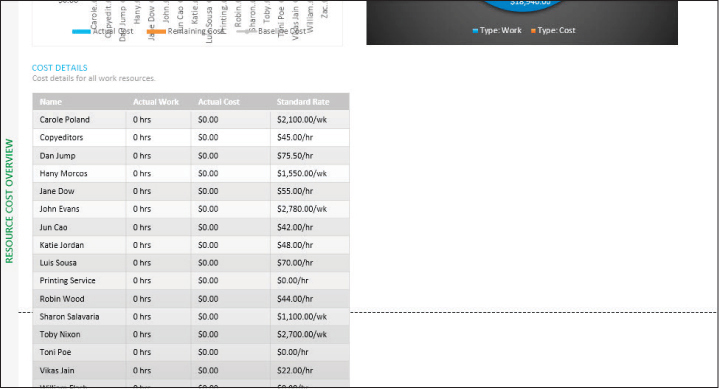
FIGURE 7-28 You can show page breaks in multipage reports outside the print preview.