You may be impressed with ModSecurity and all the interesting things we have used it for so far, but if you're like me you might have that nagging thought in the back of your head saying "Sure, it's powerful... but how much of a performance hit will my web service take if I implement this"? This chapter looks at exactly that—should you be worried about ModSecurity negatively impacting the responsiveness of your site or is the worry unfounded?
We will be looking at the way a typical web server responds when put under an increasing amount of load from client requests, both when it has ModSecurity disabled and when it is enabled, and will then be able to compare the results. After this we will look at the ways in which you can increase the performance of your server by tweaking your configuration and writing more efficient rules.
To get a better picture of the possible delay incurred when using a web application firewall, it helps to understand the anatomy of a typical HTTP request, and what processing time a typical web page download will incur. This will help us compare any added ModSecurity processing time to the overall time for the entire request.
When a user visits a web page, his browser first connects to the server and downloads the main resource requested by the user (for example, an .html file). It then parses the downloaded file to discover any additional files, such as images or scripts, that it must download to be able to render the page. Therefore, from the point of view of a web browser, the following sequence of events happens for each file:
Connect to web server.
Request required file.
Wait for server to start serving file.
Download file.
Each of these steps adds latency, or delay, to the request. A typical download time for a web page is on the order of hundreds of milliseconds per file for a home cable/DSL user. This can be slower or faster, depending on the speed of the connection and the geographical distance between the client and server.
If ModSecurity adds any delay to the page request, it will be to the server processing time, or in other words the time from when the client has connected to the server to when the last byte of content has been sent out to the client.
Another aspect that needs to be kept in mind is that ModSecurity will increase the memory usage of Apache. In what is probably the most common Apache configuration, known as "prefork", Apache starts one new child process for each active connection to the server. This means that the number of Apache instances increases and decreases depending on the number of client connections to the server. As the total memory usage of Apache depends on the number of child processes running and the memory usage of each child process, we should look at the way ModSecurity affects the memory usage of Apache.
In this section we will run a performance test on a real web server running Apache 2.2.8 on a Fedora Linux server (kernel 2.6.25). The server has an Intel Xeon 2.33 GHz dual-core processor and 2 GB of RAM.
We will start out benchmarking the server when it is running just Apache without having ModSecurity enabled. We will then run our tests with ModSecurity enabled but without any rules loaded. Finally, we will test ModSecurity with a ruleset loaded so that we can draw conclusions about how the performance is affected. The rules we will be using come supplied with ModSecurity and are called the "core ruleset".
The ModSecurity core ruleset contains over 120 rules and is shipped with the default ModSecurity source distribution (it's contained in the rules sub-directory). This ruleset is designed to provide "out of the box" protection against some of the most common web attacks used today. Here are some of the things that the core ruleset protects against:
We will examine these methods of attack further in subsequent chapters, but for now, let's use the core ruleset and examine how enabling it impacts the performance of your web service.
To install the core ruleset, create a new sub-directory named modsec under your Apache conf directory (the location will vary depending on your distribution). Then copy all the .conf files from the rules sub-directory of the source distribution to the new modsec directory:
mkdir /etc/httpd/conf/modsec
cp /home/download/modsecurity-apache/rules/modsecurity_crs_*.conf /etc/httpd/conf/modsec
Finally, enter the following line in your httpd.conf file and restart Apache to make it read the new rule files:
# Enable ModSecurity core ruleset
Include conf/modsecurity/*.conf
Putting the core rules in a separate directory makes it easy to disable them—all you have to do is comment out the above Include line in httpd.conf, restart Apache, and the rules will be disabled.
The core ruleset contains a file named modsecurity_crs_10_config.conf. This file contains some of the basic configuration directives needed to turn on the rule engine and configure request and response body access. Since we have already configured these directives in previous chapters, we do not want this file to conflict with our existing configuration, and so we need to disable this. To do this, we simply need to rename the file so that it has a different extension as Apache only loads *.conf files with the Include directive we used above:
$ mv modsecurity_crs_10_config.conf modsecurity_crs_10_config.conf.disabled
Once we have restarted Apache, we can test that the core ruleset is loaded by attempting to access an URL that it should block. For example, try surfing to http://yourserver/ftp.exe and you should get the error message Method Not Implemented, ensuring that the core rules are loaded.
So what effect does loading the core ruleset have on web application response time and how do we measure this? We could measure the response time for a single request with and without the core ruleset loaded, but this wouldn't have any statistical significance—it could happen that just as one of the requests was being processed, the server started to execute a processor-intensive scheduled task, causing a delayed response time.
The best way to compare the response times is to issue a large number of requests and look at the average time it takes for the server to respond.
An excellent tool—and the one we are going to use to benchmark the server in the following tests—is called httperf. Written by David Mosberger of Hewlett Packard Research Labs, httperf allows you to simulate high workloads against a web server and obtain statistical data on the performance of the server. You can obtain the program at http://www.hpl.hp.com/research/linux/httperf/ where you'll also find a useful manual page in the PDF file format and a link to the research paper published together with the first version of the tool.
We'll run httperf with the options --hog (use as many TCP ports as needed), --uri /index.html (request the static web page index.html) and we'll use --num-conn 1000 (initiate a total of 1000 connections). We will be varying the number of requests per second (specified using --rate) to see how the server responds under different workloads.
This is what the typical output from httperf looks like when run with the above options:
$ ./httperf --hog --server=bytelayer.com --uri /index.html --num-conn 1000 --rate 50
Total: connections 1000 requests 1000 replies 1000 test-duration 20.386 s
Connection rate: 49.1 conn/s (20.4 ms/conn, <=30 concurrent connections)
Connection time [ms]: min 404.1 avg 408.2 max 591.3 median 404.5 stddev 16.9
Connection time [ms]: connect 102.3
Connection length [replies/conn]: 1.000
Request rate: 49.1 req/s (20.4 ms/req)
Request size [B]: 95.0
Reply rate [replies/s]: min 46.0 avg 49.0 max 50.0 stddev 2.0 (4 samples)
Reply time [ms]: response 103.1 transfer 202.9
Reply size [B]: header 244.0 content 19531.0 footer 0.0 (total 19775.0)
Reply status: 1xx=0 2xx=1000 3xx=0 4xx=0 5xx=0
CPU time [s]: user 2.37 system 17.14 (user 11.6% system 84.1% total 95.7%)
Net I/O: 951.9 KB/s (7.8*10^6 bps)
Errors: total 0 client-timo 0 socket-timo 0 connrefused 0 connreset 0
Errors: fd-unavail 0 addrunavail 0 ftab-full 0 other 0
The output shows us the number of TCP connections httperf initiated per second ("Connection rate"), the rate at which it requested files from the server ("Request rate"), and the actual reply rate that the server was able to provide ("Reply rate"). We also get statistics on the reply time—the "reply time response" is the time taken from when the first byte of the request was sent to the server to when the first byte of the reply was received—in this case around 103 milliseconds. The transfer time is the time to receive the entire response from the server.
The page we will be requesting in this case, index.html, is 20 KB in size which is a pretty average size for an HTML document. httperf requests the page one time per connection and doesn't follow any links in the page to download additional embedded content or script files, so the number of such links in the page is of no relevance to our test.
When running benchmarking tests like this one, it's always important to get a baseline result so that you know the performance of your server when the component you're measuring is not involved. In our case, we will run the tests against the server when ModSecurity is disabled. This will allow us to tell which impact, if any, running with ModSecurity enabled has on the server.
The following chart shows the response time, in milliseconds, of the server when it is running without ModSecurity. The number of requests per second is on the horizontal axis:
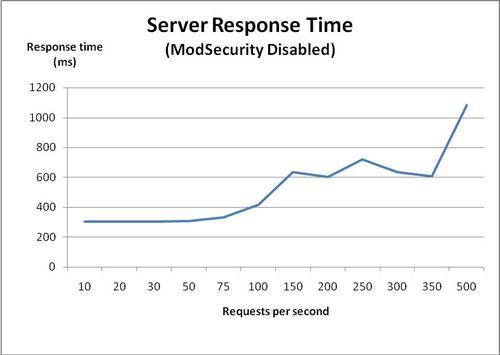
As we can see, the server consistently delivers response times of around 300 milliseconds until we reach about 75 requests per second. Above this, the response time starts increasing, and at around 500 requests per second the response time is almost a second per request. This data is what we will use for comparison purposes when looking at the response time of the server after we enable ModSecurity.
Finding the memory usage on a Linux system can be quite tricky. Simply running the Linux top utility and looking at the amount of free memory doesn't quite cut it, and the reason is that Linux tries to use almost all free memory as a disk cache. So even on a system with several gigabytes of memory and no memory-hungry processes, you might see a free memory count of only 50 MB or so.
Another problem is that Apache uses many child processes, and to accurately measure the memory usage of Apache we need to sum the memory usage of each child process. What we need is a way to measure the memory usage of all the Apache child processes so that we can see how much memory the web server truly uses.
To solve this, here is a small shell script that I have written that runs the ps command to find all the Apache processes. It then passes the PID of each Apache process to pmap to find the memory usage, and finally uses awk to extract the memory usage (in KB) for summation. The result is that the memory usage of Apache is printed to the terminal.
The actual shell command is only one long line, but I've put it into a file called apache_mem.sh to make it easier to use:
#!/bin/sh
# apache_mem.sh
# Calculate the Apache memory usage
ps -ef | grep httpd | grep ^apache | awk '{ print $2 }' | xargs pmap -x | grep 'total kB' | awk '{ print $3 }' | awk '{ sum += $1 } END { print sum }'
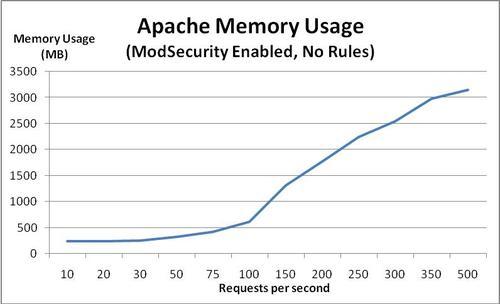
Now, let's use this script to look at the memory usage of all of the Apache processes while we are running our performance test. The following graph shows the memory usage of Apache as the number of requests per second increases:
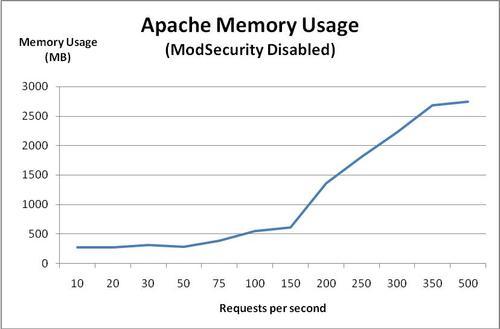
Apache starts out consuming about 300 MB of memory. Memory usage grows steadily and at about 150 requests per second it starts climbing more rapidly.
At 500 requests per second, the memory usage is over 2.4 GB—more than the amount of physical RAM of the server. The fact that this is possible is because of the virtual memory architecture that Linux (and all modern operating systems) use. When there is no more physical RAM available, the kernel starts swapping memory pages out to disk, which allows it to continue operating. However, since reading and writing to a hard drive is much slower than to memory, this starts slowing down the server significantly, as evidenced by the increase in response time seen in the previous graph.
In both of the tests above, the server's CPU usage was consistently around 1 to 2%, no matter what the request rate was. You might have expected a graph of CPU usage in the previous and subsequent tests, but while I measured the CPU usage in each test, it turned out to run at this low utilization rate for all tests, so a graph would not be very useful. Suffice it to say that in these tests, CPU usage was not a factor.
Now, let's enable ModSecurity—but without loading any rules—and see what happens to the response time and memory usage. Both SecRequestBodyAccess and SecResponseBodyAccess were set to On, so if there is any performance penalty associated with buffering requests and responses, we should see this now that we are running ModSecurity without any rules.
The following graph shows the response time of Apache with ModSecurity enabled:
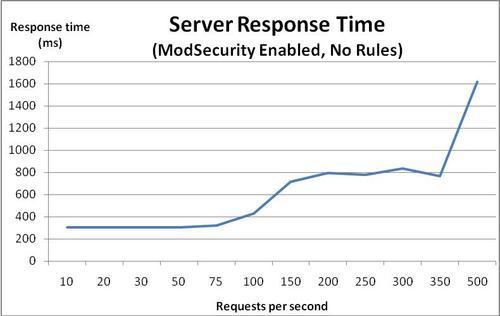
We can see that the response time graph looks very similar to the response time graph we got when ModSecurity was disabled. The response time starts increasing at around 75 requests per second, and once we pass 350 requests per second, things really start going downhill.
The memory usage graph is also almost identical to the previous one:
Apache uses around 1.3 MB extra per child process when ModSecurity is loaded, which equals a total increase of memory usage of 26 MB for this particular setup. Compared to the total amount of memory Apache uses when the server is idle (around 300 MB) this equals an increase of about 10%.
Now for the really interesting test we'll run httperf against ModSecurity with the core ruleset loaded and look at what that does to the response time and memory usage.
The following graph shows the server response time with the core ruleset loaded:
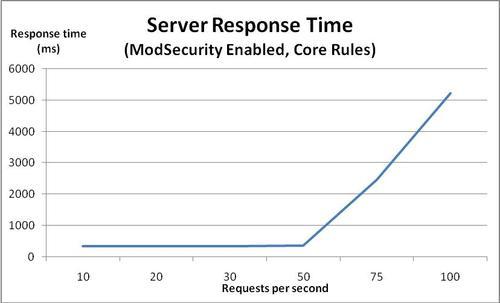
At first, the response time is around 340 ms, which is about 35 ms slower than in previous tests. Once the request rate gets above 50, the server response time starts deteriorating. As the request rates grows, the response time gets worse and worse, reaching a full 5 seconds at 100 requests per second. I have capped the graph at 100 requests per second, as the server performance has already deteriorated enough at this point to allow us to see the trend.
We see that the point at which memory usage starts increasing has gone down from 75 to 50 requests per second now that we have enabled the core ruleset. This equals a reduction in the maximum number of requests per second the server can handle of 33%.
What could be causing this deterioration in response time? Let's take a look at the memory usage of Apache and see if we can find any clues:
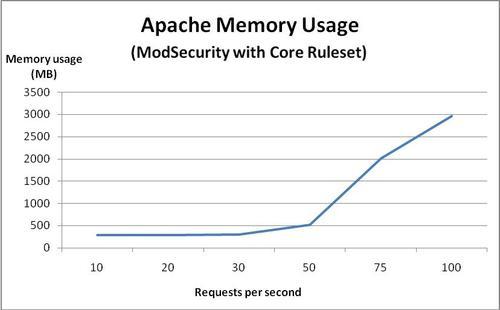
Aha! We see that once we hit 50 requests per second, the memory usage goes up dramatically. The server only has 2 GB of memory, so it's a pretty good bet that the increase in memory usage and subsequent swapping of memory pages to and from the hard drive is what causes the server performance to deteriorate.
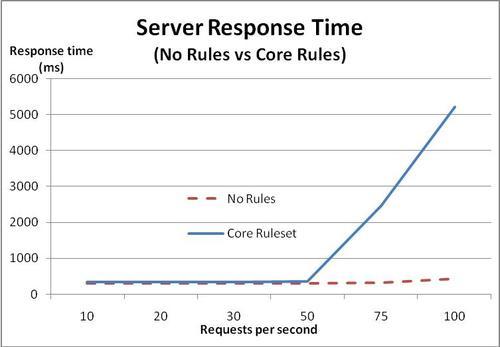
For comparison purposes, take a look at these graphs, which show the response rate and memory usage for ModSecurity with no rules (dotted line) and ModSecurity with the core ruleset (solid line):
The memory usage with the core ruleset loaded is represented by the solid line in the following graph:
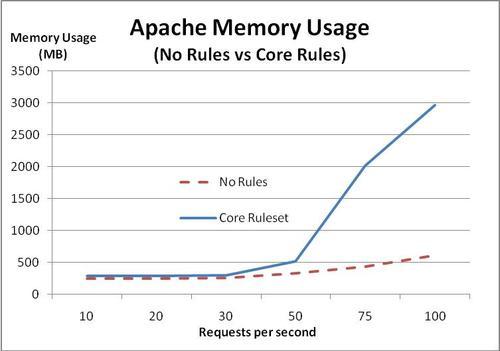
The conclusion we can draw from this is that once the request rate goes over a certain threshold, the memory usage grows to the extent that the kernel has to start swapping data to disk. Once this happens, the response time grows larger and larger.
We see that under 50 requests per second the response times are virtually identical, indicating that ModSecurity does not incur any significant performance penalty as long as there is a sufficient amount of free memory available. This is important, because it shows that the underlying limit being encountered is the amount of free memory, and this could have happened just as easily without ModSecurity enabled. ModSecurity just lowers the threshold at which this happens.
Is it possible that the deterioration in response time seen in the previous graphs is caused by a ModSecurity configuration setting? Two likely candidates would be request and response body buffering. Both of these settings, when set to On, cause ModSecurity to allocate extra memory to hold the buffered request and response bodies.
Let's set both RequestBodyAccess and ResponseBodyAccess to Off and run the same tests again and see if there's any difference.
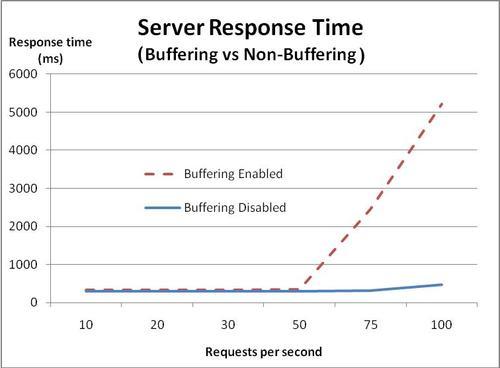
When buffering is disabled, the response time doesn't start increasing until we get above 75 requests per second, indicating that turning off buffering indeed improved performance—the server is able to handle 25 extra requests per second before performance starts going downhill.
Let's see what the memory usage looks like with buffering disabled:
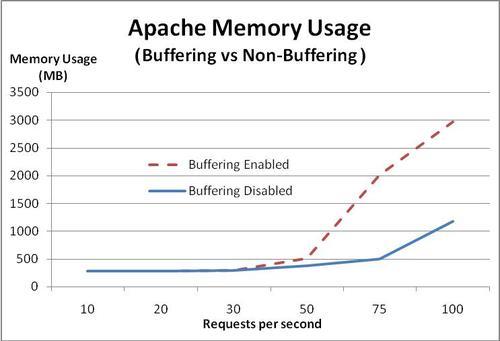
As expected, we see that with buffering turned off, memory usage doesn't start increasing significantly until we reach 75 requests per second, again showing that memory load is a crucial factor in the number of requests per second the server can handle.
We have seen that loading the core ruleset caused a decrease in the number of simultaneous connections the server could handle before being overwhelmed. CPU usage was not an issue at all, but the server was running a pretty fast dual-core processor, so the results may be different on systems with older hardware.
In the case of the limitation we ran into here, optimizing two things should enable us to squeeze a significant amount of extra performance out of the server:
Decreasing the memory usage of each Apache process
Adding extra RAM to the server
In the next section we will be looking at how to decrease the amount of memory Apache uses, and we will also be looking at ways to optimize your rules for efficiency.
The previous results indicate that you will likely not see any performance degradation from using ModSecurity unless Apache starts consuming too much memory, or you are using a large number of rules and a slow system. What can you do if you do run into either the memory or processor becoming overloaded? This part of the chapter gives some practical advice to help you squeeze the best performance out of your ModSecurity setup.
Adding extra RAM to your server may not be the first or easiest thing to do when you find that the web server processes use too much memory, and therefore it pays to know how to decrease the memory footprint of each Apache process.
Follow these tips and you may not have to add any extra memory:
Decrease Apache module usage
The number of dynamic modules that Apache has to load has a direct impact on the memory footprint of each process. Therefore, tweak your
httpd.conffile so that any modules which you don't require are disabled (by simply commenting out theLoadModulelines for the modules you don't need).Limit the number of requests per Apache child process
If you are using Apache in the prefork configuration (one child process per request) then you should set
MaxRequestsPerChildso that each child's memory usage gets reset after a certain number of requests. Apache child processes tend to grow over time and seldom do they shrink in size unless restartedReduce the number of ModSecurity rules
The larger your ModSecurity ruleset, the more memory each Apache process will consume. In addition, a large ruleset takes a longer time to execute, so the performance savings are two-fold.
You can often achieve a performance gain in general by passing requests for static content such as images or binary files to a web server specialized for this task. If you don't want to install a light-weight web server especially to handle static content, you can configure ModSecurity to not inspect such files by using a rule similar to the following:
SecRule REQUEST_FILENAME ".(?:jpe?g|gif|png|js|exe)$" "phase:1,allow"
The above rule immediately allows access to files ending in .jpg, .jpeg, .gif, .png, .js, and .exe. It's easy enough to add your own extensions for any additional static content you may have on your site with other extensions.
We saw in the previous chapter that using the @pm and @pmFromFile operators can be quicker than a standard regex matching attempt. But just how much quicker are these operators?
As an example, imagine that you would like to block requests with a particular referrer header. A list of "banned" referrers could be several hundred or even thousand lines long, so it's important to know which method to use and the differences in speed between them.
To investigate the difference in speed between regex matching and the @pm and @pmFromFile operators, let's look at how ModSecurity performs when we throw a list of 500 phrases at it. For this test, let's use a dictionary file and our favorite programming language to generate a list of 500 random domain names to block. The list starts out like this, just to give you an idea of what we're working with:
gaddersprossies.org
bastefilagree.com
thicksetflurry.net
shaitansshiners.org
colludesfeminise.com
luffingsall.com
oversewnprinker.net
metereddebonair.com
sparingcricking.com
...
We'll save this file as DomainNames.txt and upload it to our server running Apache and ModSecurity. We can then take the list of domain names and modify them so that each line looks as follows:
SecRule REQUEST_HEADERS:Referer "gaddersprossies.org" deny SecRule REQUEST_HEADERS:Referer "bastefilagree.com" deny
SecRule REQUEST_HEADERS:Referer "thicksetflurry.net" deny
SecRule REQUEST_HEADERS:Referer "shaitansshiners.org" deny
SecRule REQUEST_HEADERS:Referer "colludesfeminise.com" deny
SecRule REQUEST_HEADERS:Referer "luffingsall.com" deny
SecRule REQUEST_HEADERS:Referer "oversewnprinker.net" deny
SecRule REQUEST_HEADERS:Referer "metereddebonair.com" deny
SecRule REQUEST_HEADERS:Referer "sparingcricking.com" deny
...
As you can see, this file now contains ModSecurity rules to block any referrer containing one of the specified domain names. We'll save this file as DomainNamesRegex.conf and place it in the conf.d subdirectory of the Apache root, causing the rules to be loaded after an Apache restart. We'll also set the debug log level to 4, which causes ModSecurity to log timestamps at the beginning and end of each phase to the debug log:
These are the results when accessing a file on the server with the regex rules in place:
[rid#b8a763b8][/][4] Time #1: 258
...
[rid#b8a763b8][/][4] Time #2: 13616
The times are given in microseconds, so the total time spent processing the regex rules was 13616 258 = 13348 microseconds, or about 13.3 milliseconds.
Now let's see how much time the @pmFromFile operator takes:
[rid#b8a69bf0][/][4] Time #1: 414
...
[rid#b8a69bf0][/][4] Time #2: 485
This time the total time spent was 485 414 = 71 microseconds, or about 0.07 milliseconds. This data indicates that @pmFromFile is approximately 200 times faster than using a regular expression. It's pretty clear that you should prefer using @pm and @pmFromFile for large lists of phrases that need to be matched.
Enabling debug and audit logging will cause ModSecurity to write log entries to the respective log file. Especially with debug logging at a high level (for example, 9), you will incur a performance penalty since each request will generate many lines of log data. Therefore, you should not enable debug logging unless you are testing out new rules or debugging a problem.
There are certain things you can do when writing your regular expressions that will ensure that you achieve maximum performance. What follows are a few guidelines on things you should and shouldn't do when writing regexes.
Non-capturing parentheses, as we have mentioned earlier, are this awkward-looking construct:
(?: )
They perform the same function as regular parentheses, with the difference that the non-capturing ones do not capture backreferences. This means the regular expression engine doesn't need to keep track of backreferences or allocate memory for them, which saves some processing time as well as memory.
If you look at the core ruleset, you'll notice that many of the rules in it contain these parentheses, which shows you that if performance is something you have in mind then you should be using them, too.
It is usually more efficient to use a single regular expression instead of a lot of smaller ones. So if for example you wanted to match a filename extension, the following rule would be faster than using one rule for each extension:
SecRule REQUEST_FILENAME ".(?:exe|bat|pif)" deny
You'll have to weigh writing one-line, complex rules against the readability of your ruleset. For a small amount of rules in the ruleset, the difference in speed won't matter, and you should prefer to use simple, readable rules. If your ruleset starts growing into the hundreds of rules, you may want to consider using the above technique.
In this chapter we looked at the performance of ModSecurity. The results when benchmarking ModSecurity indicate that the additional latency due to CPU usage is usually low. Apache's memory usage increases when ModSecurity is enabled and is using the approximately 120 rules in the core ruleset, and we have seen that this leads to a decrease in the number of simultaneous connections that the server can successfully handle due to increased memory usage.
In most cases, enabling ModSecurity should not slow down your server unless you are getting a lot of concurrent requests. If you do experience a slow-down (or are able to measure a significant one using a benchmarking tool such as httperf) then it is important to find out the underlying cause.
If the problem is that Apache uses too much memory then you need to either configure it (and ModSecurity) to use less memory, add more RAM, or both. If the CPU usage goes up and you find that this is caused by ModSecurity then implement the tips found in the last section of this chapter and also consider trimming the number of rules in your ruleset.
In the next chapter, we will be looking at logging and auditing, and learn about the ModSecurity console.