
In the earlier chapters of this book, we looked at techniques for reducing the workload demands on the MongoDB server. We considered options for structuring and indexing our datasets and tuning our MongoDB requests to minimize the amount of data that has to be processed in response to a work request. Maybe 80% of the performance gains from performance tuning come from these application-level optimizations.
However, at some point, our application schema and code is as optimized as it is ever going to be, and the demands we are placing on the MongoDB server are reasonable. Our priority now is to ensure that MongoDB can respond quickly to our requests. When we send a data request to MongoDB, the most critical factor becomes is the data in memory or does it have to be fetched from disk?
Like all databases, MongoDB uses memory to avoid disk IO. A read from memory typically takes about 20 nanoseconds. A read from a very fast Solid State Disk takes about 25 microseconds – 1000 times as long. A read from a magnetic disk might take 4–10 milliseconds – that’s another 2000 times slower! So MongoDB – like all databases – is architected to avoid disk IO whenever possible.
MongoDB Memory Architecture
MongoDB supports a variety of pluggable storage engines, each of which utilizes memory differently. Indeed, there is even an in-memory storage engine which stores active data only in memory. However, in this chapter, we are going to focus solely on the default WiredTiger storage engine.
When using the WiredTiger storage engine, the bulk of the memory consumed by MongoDB is usually the WiredTiger cache.
MongoDB allocates additional memory based on workload demand. You can’t directly control the amount of additional memory allocated, although workload and some server configuration parameters do influence the total amount of memory allocated. The most significant memory allocations are associated with sorting and aggregation operations – we looked at these in Chapter 7. Every connection to MongoDB also requires memory.
Within the WiredTiger cache, memory is allocated to caching collection and index data, for snapshots supporting transaction Multi-Version Consistency Control (see Chapter 9), and to buffer the WiredTiger write-ahead log.
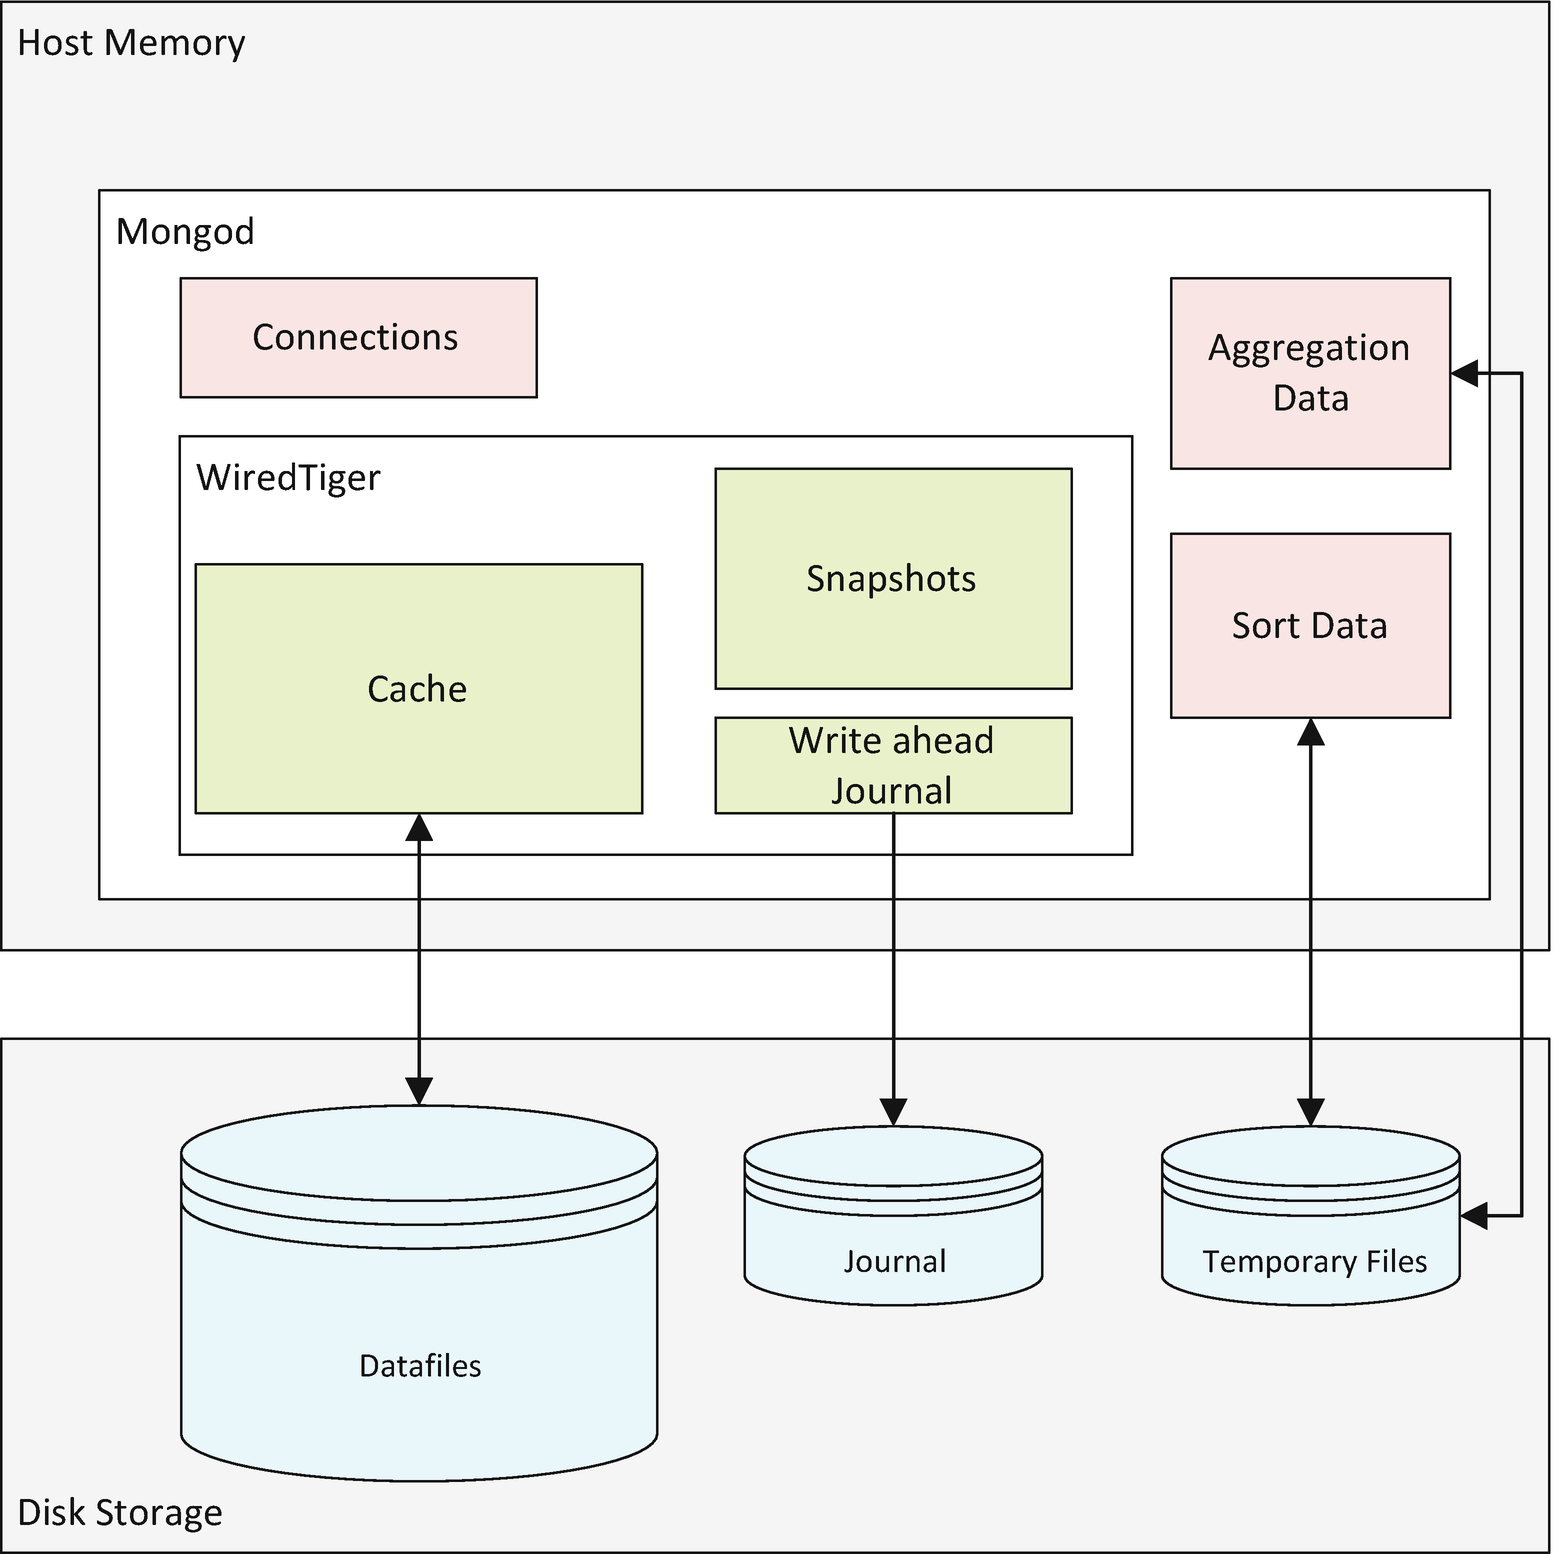
MongoDB memory architecture
Host Memory
Although configuring MongoDB memory is a big topic, from an operating system perspective, memory management is very simple. Either there is some free memory available, and everything is fine, or there is not enough free memory and things are awful.
When physical free memory is exhausted, then attempts to allocate memory will result in existing memory allocations “swapping out” to disk. Since the disk is many hundreds of times slower than memory, memory allocations suddenly take many orders of magnitude longer to satisfy.

Memory, swap, and response time
When server memory is over-utilized, then memory may be swapped to disk. On a MongoDB server, this almost always indicates that there is insufficient memory for the MongoDB memory configuration.
While we don’t want to see memory over-allocation and swapping, we also don’t want to see massive amounts of unallocated memory. Unused memory serves no useful purpose – it’s probably better to allocate that memory to the WiredTiger cache than to allow it to be unused.
Measuring Memory
The most critical counters here are active memory – which represents memory currently allocated to a process and used swap, which indicates how much memory has been swapped to disk. If active memory is approaching total memory, you may be about to experience a memory shortage. Used swap should generally be zero, though it’s possible after a memory shortage has been resolved for swap to contain inactive memory for some time.
The report tells us that MongoDB had allocated 9.8GB of virtual memory, 8.1GB of which was currently actively allocated to physical memory. The difference between virtual and resident memory often represents memory that has been allocated, but not yet used.
Of the 9.8GB of memory allocated, 6.1GB is assigned to the WiredTiger cache.
WiredTiger Memory
The vast majority of MongoDB production deployments use the WiredTiger storage engine. And for those deployments, the largest chunk of memory will be the WiredTiger cache. In this chapter, we’ll discuss only the WiredTiger storage engine, since while other storage engines exist, they are nowhere near as widely deployed as WiredTiger.
The WiredTiger cache has a massive effect on server performance. Without the cache, every data read would be a disk read. The cache typically reduces the number of disk reads by more than 90% and consequently allows for orders of magnitude improvements in throughput.
Cache Size
By default, the WiredTiger cache will be set to either 50% of total memory minus 1GB or to 256MB, whichever is largest. So, for instance, on a 16GB server, you would expect a default size of 7GB ((16/2) – 1). The remaining memory is left available for sort and aggregation areas, connection memory, and operating system memory.
The default WiredTiger cache size is a useful starting point, but rarely the optimal value. If other workloads are running on the same host, it may be too high. Conversely, on a large memory system dedicated to MongoDB, it may be too low. Given the importance of the WiredTiger cache to performance, you should be ready to adjust the cache size to meet your needs.
The default WiredTiger cache size is a useful starting point, but rarely the optimum value. Determining and setting the optimal value will usually be worthwhile.
Determining the Optimum Cache Size
A cache that is too small can result in an increase in IO, which can degrade performance. On the other hand, increasing the cache size beyond the available operating system memory can lead to swapping and even more disastrous performance degradation. Increasingly, MongoDB is deployed in cloud containers where the amount of available memory can be adjusted dynamically. Even so, memory is often the most expensive resource in a cloud environment, and so “throwing more memory” at the server without evidence is undesirable.
The cache “hit” ratio
The eviction rate
The Database Cache "Hit" Ratio

The cache hit ratio represents the proportion of block requests that are satisfied by the database cache without requiring a disk read. Each “hit” – when the block is found in memory – is a good thing, since it avoids a time-consuming disk IO. Therefore, it seems intuitively obvious that a high buffer cache hit ratio is also a good thing.
Unfortunately, while the cache hit ratio clearly measures something, it’s not always or even usually true that a high cache hit ratio is indicative of a well-tuned database. In particular, poorly tuned workloads often read the same data blocks over and over again; these blocks are almost certainly in memory, so the most grossly inefficient operations ironically tend to generate very high Cache Hit Ratios. An Oracle DBA Connor McDonald famously created a script that could generate any desired hit ratio, essentially by reading the same blocks over and over again. Connor’s script performs no useful work but can achieve an almost perfect hit ratio.
There is no "correct" value for the cache hit ratio – high values are just as likely to be the result of poorly tuned workloads as the result of well-tuned memory configuration.
That having all been said, for a well-tuned workload (one with a sound schema design, appropriate indexes, and optimized aggregation pipelines), observing the WiredTiger hit ratio can give you an idea of how well your WiredTiger cache is sustaining your MongoDB workload demand.
This shows that the cache hit ratio over the preceding 5 seconds was 58%.
Providing our workload is well tuned, a low cache hit ratio suggests that increasing the WiredTiger cache might improve performance.
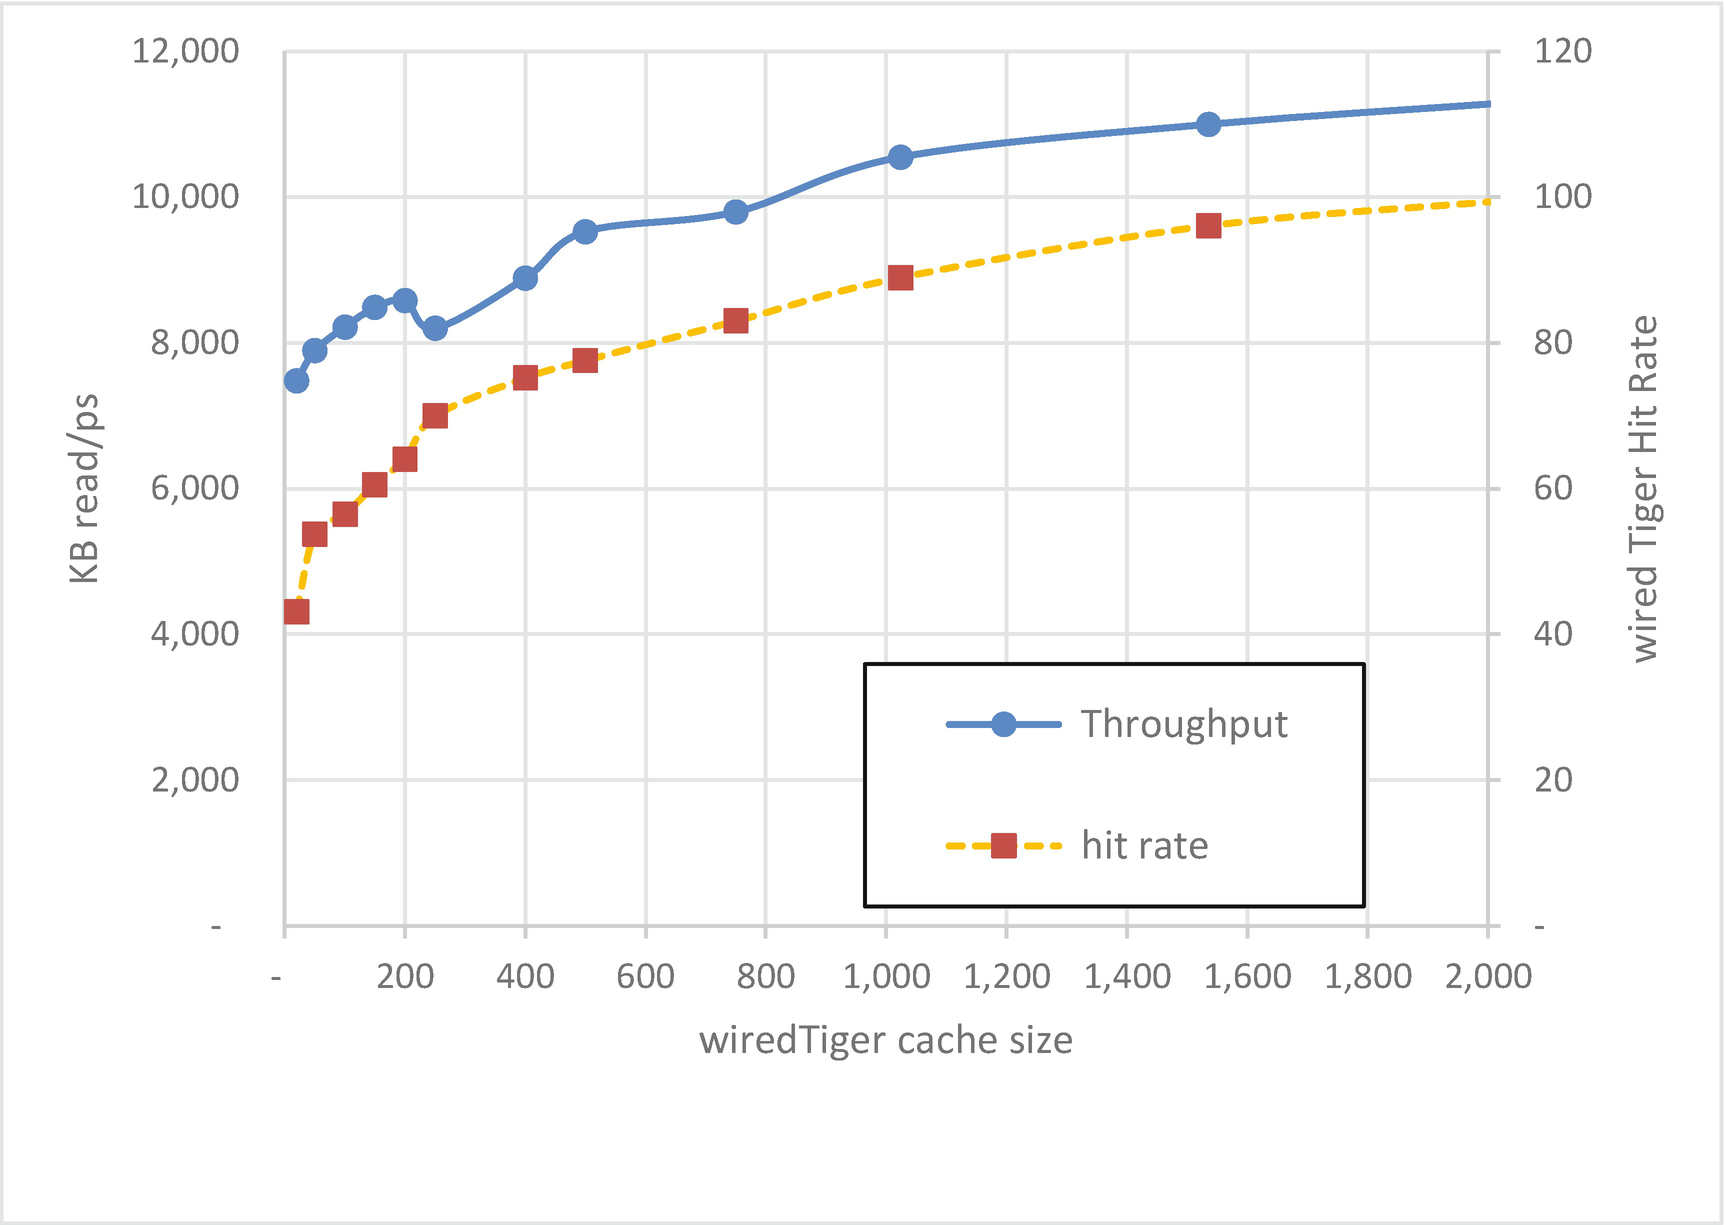
WiredTiger cache size (MB), miss rates, and throughput
As we increase the size of the cache, we might see an increase in the hit rate and an increase in throughput. The key word in the last sentence is might: some workloads will see little or no benefit from an increased cache size, either because all the data needed is already in memory or because some of the data is never re-read and therefore can’t benefit from caching.
As imperfect as it is, the WiredTiger miss rate is a crucial health metric for many MongoDB databases.
Performance issues may indicate that the database is operating at capacity and that it is time to add additional capacity to the database. In particular, the application's working set should fit in the available physical memory.
A high cache hit ratio is the best indicator we have that the working set does fit into memory.
Providing your workload is tuned, a low WiredTiger cache hit rate may be an indication that the WiredTiger cache size should be increased.
Evictions
Caches generally can’t hold everything in memory. Typically, caches try to keep the most frequently accessed documents in memory by keeping only the most recently accessed pages of data in the cache.
Once the cache reaches its maximum size, making room for new data requires that old data be removed – evicted – from the cache. The pages of data that are removed are generally the Least Recently Used (LRU) pages.
MongoDB doesn’t wait until the cache is completely full before performing evictions. By default, MongoDB will try and keep 20% of the cache free for new data and will start to restrict new pages from coming into cache when the free percentage hits 5%.
If a data item in cache has not been modified, then eviction is almost instantaneous. However, if a block of data has been modified, then it cannot be evicted until it is written to disk. These disk writes take time. For this reason, MongoDB tries to keep the percentage of modified – “dirty” – blocks under 5%. If the percentage of modified blocks hits 20%, then operations will be blocked until the target value is achieved.
The MongoDB server allocates dedicated threads to eviction processing – by default, four eviction threads are allocated.
Blocking Evictions
When the number of clean blocks or dirty blocks hits the higher threshold values, then sessions that try to bring new blocks into the cache will be required to perform an eviction before the read operation can complete.
If the blocking eviction rate is significant, it might indicate a more aggressive eviction policy is warranted. Either start evictions earlier or apply more threads to the eviction process. It is possible to change WiredTiger eviction configuration values, but it’s a risky procedure, partially because although you can set the values, you cannot directly retrieve the existing values.
If evictions appeared to be problematic, we could try increasing the number of threads or changing the threshold values to promote a more or less aggressive eviction processing regime.
If there is a high rate of "blocking" evictions, then a more aggressive eviction policy might be warranted. But be very cautious when adjusting WiredTiger internal parameters.
Checkpoints
When an update or other data manipulation statement changes data in the cache, it is not immediately reflected in the datafiles that represent the durable representation of the document. A representation of the data change is written to a sequential write-ahead journal. These sequential journal writes can be used to recover the data in the case of a server crash, and the sequential writes involved are much faster than the random writes that would be required to keep the datafiles in absolute sync with the cache.
However, we don’t want the cache to move too far in advance of the datafiles – partially because it will increase the time to recover the database in the case of a server crash. For this reason, MongoDB periodically ensures that the datafiles are synchronized with the changes in the cache. These checkpoints involve writing out the modified “dirty” blocks to disk. By default, checkpoints occur every 60 seconds.
Checkpoints are IO-intensive – depending on the size of the cache and the amount of dirty data in the cache, many gigabytes of information might have to be flushed to disk. As a result, checkpoints generally cause noticeable slowdowns in throughput – especially for data manipulation statements.
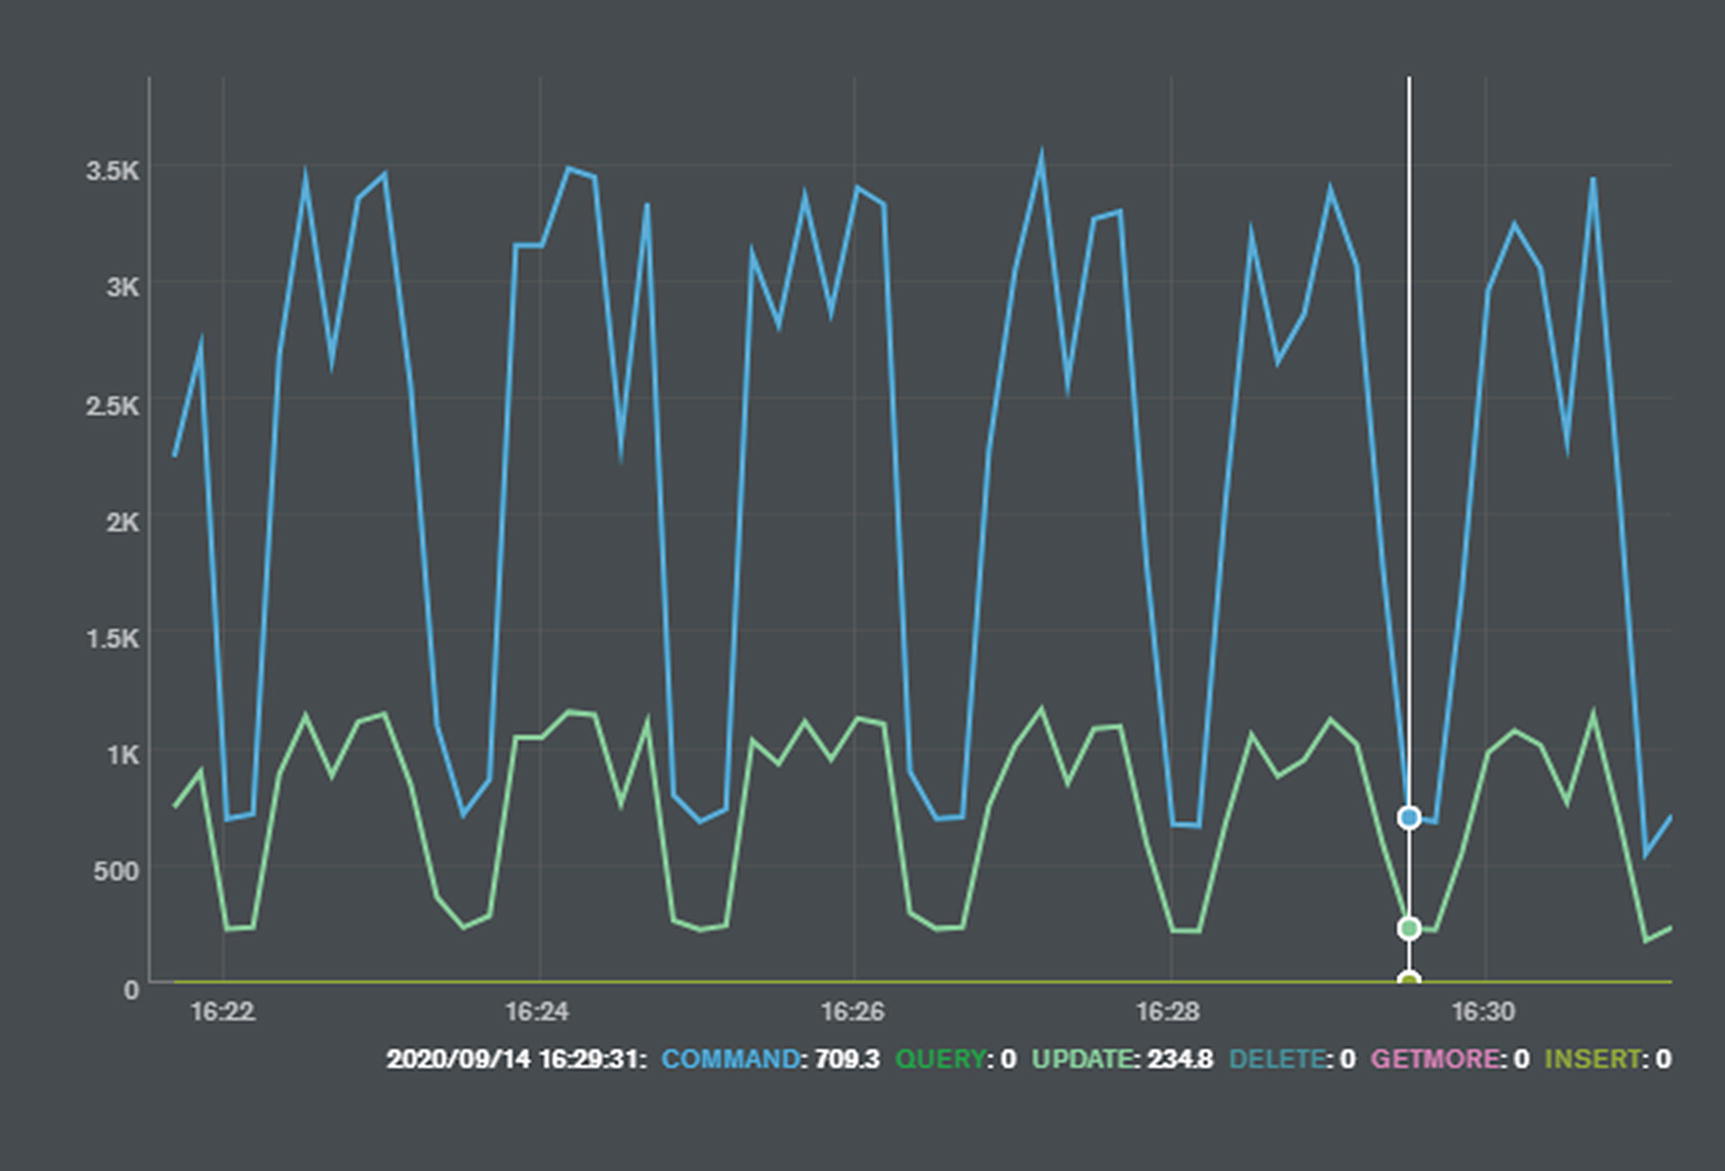
Checkpoints can create uneven performance
The eviction_dirty_trigger and eviction_dirty_target settings – discussed in the previous section – control how many modified blocks are allowed in the cache before eviction processing kicks in. These can be adjusted to reduce the number of modified blocks in the cache, reducing the amount of data that must be written to disk during a checkpoint.
The eviction.threads_min and eviction.threads_max settings specify how many threads will be dedicated to eviction processing. Allocating more threads to evictions will accelerate the rate of eviction processing, which could, in turn, leave fewer blocks in the cache to flush during a checkpoint.
The checkpoint.wait setting can be adjusted to increase or reduce the time between checkpoints. If a high value is set, then the probability is that eviction processing will end up writing most of the blocks to disk before the checkpoint occurs, and the overall impact of the checkpoints might be reduced. However, it’s also possible that the overhead of these delayed checkpoints will be massive.
There is no one correct setting for checkpointing, and sometimes the impact of checkpointing can be counter-intuitive. For instance, the overhead of checkpointing can be greater when you have a large WiredTiger cache. This is because the default eviction policies for modified blocks are set to a percentage of the WiredTiger cache – the greater the cache size, the more “lazy” the eviction processor will become.
We want to make it absolutely clear that we are not recommending the preceding settings, nor are we recommending you modify these parameters at all. However, if you are concerned that checkpoints are creating unpredictable response times, these settings might be helpful.
Checkpoints write out modified pages to disk every one minute by default. If you are experiencing a dip in performance on a one-minute cycle, you might consider adjusting – carefully – the WiredTiger checkpoint and dirty eviction policies.
WiredTiger Concurrency
In the preceding example, 28 of 128 read tickets are in use, and 7 of 128 write tickets.
However, be careful when increasing the number of concurrent readers, as higher values may overwhelm available hardware resources.
Reducing Application Memory Demand
As we emphasized earlier, the best tuning outcomes occur when you tune your application design and workload before tuning your hardware and server configuration. You can often get a performance improvement by adding memory to a server that is experiencing a high IO overhead. However, memory is not free, whereas creating an index or adjusting some code costs you nothing – at least in dollar terms.
We covered the key application tuning principles in the first ten chapters of this book. However, it’s worth recapping on a few here, with respect to how they affect memory consumption.
Document Design
the document is fairly small, except for a massive binary representation of the users’ driver’s licenses. The WiredTiger cache will need to store all the high-resolution scans of driver’s license in the cache, whether you ask for them or not. Therefore, to maximize memory, you may wish to adopt the vertical partitioning design pattern introduced in Chapter 4. We could put the driver’s license scans in a separate collection which would only be loaded into the cache when needed, rather than whenever an SSN record is accessed.
Remember, the larger the document size, the fewer documents can be stored in the cache. Keeping documents small improves cache efficiency.
Indexing
Indexes offer a fast path to selected data, but also help with memory as well. When we search for data using a full collection scan, all documents are loaded into the cache regardless of whether the document matches the filter criteria. Therefore, indexed lookups help keep the cache relevant and effective.
Indexes also reduce the memory required by sorts. We saw in Chapters 6 and 7 how to avoid disk sorts using indexes. However, if we perform lots of memory sorts, then we are going to require operating system memory (outside of the WiredTiger cache) to perform these sorts. Indexed sorts don’t have the same sort of memory overhead.
Indexes help reduce memory demand by introducing only required documents into the cache and by reducing the memory overhead of sorts.
Transactions
We saw in Chapter 9 how MongoDB transactions use snapshots of data to ensure that sessions do not read from uncommitted versions of documents. Prior to MongoDB 4.4, these snapshots are held in the WiredTiger cache and reduce the amount of memory available for other purposes.
Consequently, prior to MongoDB 4.4, adding transactions to your application will increase the amount of memory required in your WiredTiger cache. Furthermore, if you adjust the transactionLifetimeLimitSeconds parameter to allow for longer transactions, you will increase the memory pressure even more. From MongoDB 4.4 onwards, snapshots are stored to disk as “durable history” and the memory impact of long transactions is less significant.
Summary
Like all databases, MongoDB uses memory primarily to avoid disk IO. If possible, you should tune your application workload before tuning memory, since changes to schema design, indexing, and queries will all change the memory demands of your application.
In a WiredTiger implementation, MongoDB memory consists of the WiredTiger cache – primarily used to cache frequently accessed documents – and operating system memory which is used for a variety of purposes, including connection data and sort areas. Whatever your memory footprint, make sure it never exceeds the operating system memory limit; otherwise, some of this memory may be swapped out to disk.
The most significant tuning knob you have available is the WiredTiger cache size. It defaults to a little under one-half of operating system memory and can be increased in many cases, especially if there is abundant free memory on your server. The “hit rate” in the cache is one indicator that might suggest a need to increase memory.
The cache and other areas of memory serve to avoid disk IO, but eventually, some disk IO has to occur for the database to do its work. In the next chapter, we will consider how to measure and optimize necessary disk IO.