6
Dealing with Uncertainty of Information: A Classic Approach
The classic approach encountered when considering uncertainty, which comes with a broad range of practical applications (Kaufman 1961; Belyaev 1977), is associated with the analysis carried out for the given solution alternatives (strategies) and the given representative combinations of initial data, states of nature, or scenarios realized on the basis of constructing the corresponding payoff matrices. This analysis is based on applying so‐called choice criteria. The use of certain choice criteria leads to robust solutions, which are considered in the present chapter. The basic phases to support the application of the classic approach when dealing with the uncertainty factor are presented. The questions of constructing representative combinations of initial data, states of nature, or scenarios are also discussed. The use of the presented results is illustrated by solving a monocriteria problem in the presence of uncertainty.
6.1 Characterization of the Classic Approach to Dealing with Uncertainty of Information
The classic approach (Luce and Raiffa 1957; Raiffa 1968; Webster 2003) to dealing with the uncertainty of information is based on the assumption that the analysis is carried out for the given solution alternatives (strategies) Xk, k = 1, 2, …, K and the given representative combinations of initial data, states of nature, or scenarios Ys, s = 1, 2, …, S. Making use of alternatives and scenarios, we associate them with the corresponding payoff matrix in the form shown in Table 6.1.
The payoff matrix reflects effects (or consequences) of one or other solution alternative Xk, k = 1, 2, …, K for the corresponding combinations of initial data, states of nature, or scenarios Ys, s = 1, 2, …, S.
Table 6.1 Payoff matrix.
| Y1 | … | Ys | … | YS | |
| X1 | F(X1, Y1) | … | F(X1, Ys) | … | F(X1, YS) |
| ⋯ | ⋯ | ⋯ | ⋯ | ⋯ | ⋯ |
| Xk | F(Xk, Y1) | … | F(Xk, Ys) | … | F(Xk, YS) |
| ⋯ | ⋯ | ⋯ | ⋯ | ⋯ | ⋯ |
| XK | F(XK, Y1) | … | F(XK, Ys) | … | F(XK, YS) |
Belyaev (1977) defines the following basic phases to support the application of the classic approach when dealing with the uncertainty factor:
- mathematical formulation of the problem;
- selection of the representative combinations of initial data (selection of the states of nature or scenarios);
- determination and preliminary analysis of solution alternatives;
- construction of the payoff matrix;
- analysis of the payoff matrix and the choice of the rational solution alternatives;
- selection of the final solution.
Without the detailed discussion of the phases identified here, it is worth emphasizing that an analysis of the payoff matrices and the choice of the rational solution alternatives are based on the use of the corresponding choice criteria (Luce and Raiffa 1957; Raiffa 1968; Webster 2003). Those being utilized most frequently and exhibiting a general character are the criteria of Wald, Laplace, Savage, and Hurwicz. At the same time, it is necessary to indicate that other choice criteria are available in the literature, for example, the criteria of Hodges and Lehmann (Hodges and Lehmann 1952), Bayes (Trukhaev 1981), maximal probability (Trukhaev 1981), and so on. However, the use of these criteria presumes the availability of the certain information (usually, probabilistically described) about the states of nature.
6.2 Payoff Matrices and Characteristic Estimates
To better understand the nature of the criteria of Wald, Laplace, Savage, and Hurwicz, the matrix presented in Table 6.1 is now extended and shown in Table 6.2, in which we take into account recommendations presented in (Belyaev 1977). This extension is associated with the incorporation of the following estimates (Pedrycz et al. 2011):
Table 6.2 Payoff matrix with characteristic estimates.
| Y1 | … | Ys | … | YS | Fmax(Xk) | Fmin(Xk) | rmax(Xk) | ||
| X1 | F(X1, Y1) | … | F(X1, Ys) | … | F(X1, YS) | Fmax(X1) | Fmin(X1) | rmax(X1) | |
| ⋯ | ⋯ | ⋯ | ⋯ | ⋯ | ⋯ | ⋯ | ⋯ | ⋯ | ⋯ |
| Xk | F(Xk, Y1) | … | F(Xk, Ys) | … | F(Xk, YS) | Fmax(Xk) | Fmin(Xk) | rmax(Xk) | |
| ⋯ | ⋯ | ⋯ | ⋯ | ⋯ | ⋯ | ⋯ | ⋯ | ⋯ | ⋯ |
| XK | F(XK, Y1) | … | F(XK, Ys) | … | F(XK, YS) | Fmax(XK) | Fmin(XK) | rmax(XK) | |
| Fmax(Ys) | Fmax(Y1) | … | Fmax(Ys) | … | Fmax(YS) |
- The objective function maximum level
This level is determined for the given solution alternative and, as the name stipulates, is the most optimistic estimate when the objective function is to be maximized or the most pessimistic estimate if the objective function is to be minimized for the considered solution alternative.
- The objective function minimum level
(6.2)

computed for the given solution alternative. It is the most pessimistic estimate when the objective function is to be maximized, or is treated as the most optimistic estimate if the objective function is to be minimized for the considered solution alternative.
- The objective function
(6.3)
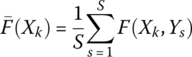
determined for the given solution alternative.
- The risk (regret) maximum level
where r(Xk, Ys) is an over‐expenditure that takes place under combination of the representative combination of initial data, state of nature, or scenario Ys, and the choice of the solution alternative Xk instead of the solution alternative that is locally optimal for the given Ys. The estimates of over‐expenditures provide a certain description of the situation as they show a relative difference of the objective function values under the choice of one solution alternative in place of another. In fact, the over‐expenditures characterize a damage level associated with the uncertainty of the situation itself.
To determine risks (regrets) r(Xk, Ys), it is necessary to define the maximum value of the objective function (if it is to be maximized, as it is considered in Table 6.2) for each representative combination of initial data, state of nature or scenario Ys (for each column of the payoff matrix):
It is evident that if the objective function is to be minimized, it is necessary to define its minimum for each representative combination of initial data, state of nature, or scenario Ys (for each column of the payoff matrix):
Table 6.3 Risk matrix.
| Y1 | … | Ys | … | YS | rmax(Xk) | |
| X1 | r(X1, Y1) | … | r(X1, Ys) | … | r(X1, YS) | rmax(X1) |
| ⋯ | ⋯ | ⋯ | ⋯ | ⋯ | ⋯ | ⋯ |
| Xk | r(Xk, Y1) | … | r(Xk, Ys) | … | r(Xk, YS) | rmax(Xk) |
| ⋯ | ⋯ | ⋯ | ⋯ | ⋯ | ⋯ | ⋯ |
| XK | r(XK, Y1) | … | r(XK, Ys) | … | r(XK, YS) | rmax(XK) |
The risk associated with any solution alternative Xk and any representative combination of initial data, state of nature, or scenario Ys can be evaluated as follows:
if the objective function is to be maximized, or
if the objective function is to be minimized.
Carrying out calculations on the basis of Eqs. for all Xk, k = 1, 2, …, K and Ys, s = 1, 2, …, S, we obtain the risk (regret) matrix shown in Table 6.3. Note that any column of this matrix includes at least a single zero element r(Xk, Ys) = 0.
Table 6.4 Example 6.1: Payoff matrix.
| Y1 | Y2 | Y3 | Y4 | |
| X1 | 13 | 7 | 9 | 12 |
| X2 | 13 | 8 | 14 | 10 |
| X3 | 10 | 9 | 7 | 12 |
| X4 | 10 | 8 | 11 | 13 |
Table 6.5 Example 6.1: Risk matrix for the problem of maximization.
| Y1 | Y2 | Y3 | Y4 | rmax(Xk) | |
| X1 | 0 | 2 | 5 | 1 | 5 |
| X2 | 0 | 1 | 0 | 3 | 3 |
| X3 | 3 | 0 | 7 | 1 | 7 |
| X4 | 3 | 1 | 3 | 0 | 3 |
Table 6.6 Example 6.1: Risk matrix for the problem of minimization.
| Y1 | Y2 | Y3 | Y4 | rmax(Xk) | |
| X1 | 3 | 0 | 2 | 2 | 3 |
| X2 | 3 | 1 | 7 | 0 | 7 |
| X3 | 0 | 2 | 0 | 2 | 2 |
| X4 | 0 | 1 | 4 | 3 | 4 |
Table 6.7 Example 6.1: Payoff matrix with characteristic estimates for the problem of maximization.
| Y1 | Y2 | Y3 | Y4 | Fmax(Xk) | Fmin(Xk) | rmax(Xk) | ||
| X1 | 13 | 7 | 9 | 12 | 13 | 7 | 10.25 | 5 |
| X2 | 13 | 8 | 14 | 10 | 14 | 8 | 11.25 | 3 |
| X3 | 10 | 9 | 7 | 12 | 12 | 7 | 9.50 | 7 |
| X4 | 10 | 8 | 11 | 13 | 13 | 8 | 10.50 | 3 |
Table 6.8 Example 6.1: Payoff matrix with characteristic estimates for the problem of minimization.
| Y1 | Y2 | Y3 | Y4 | Fmax(Xk) | Fmin(Xk) | rmax(Xk) | ||
| X1 | 13 | 7 | 9 | 12 | 13 | 7 | 10.25 | 3 |
| X2 | 13 | 8 | 14 | 10 | 14 | 8 | 11.25 | 7 |
| X3 | 10 | 9 | 7 | 12 | 12 | 7 | 9.50 | 2 |
| X4 | 10 | 8 | 11 | 13 | 13 | 8 | 10.50 | 4 |
6.3 Choice Criteria and Their Application
The choice criteria of Wald, Laplace, Savage, and Hurwicz are based on the use of the characteristic estimates Fmax(Xk), Fmin(Xk), ![]() , and rmax(Xk), defined by Eqs. (6.1)–(6.4). In this section, we discuss the particular characteristics of each choice criterion.
, and rmax(Xk), defined by Eqs. (6.1)–(6.4). In this section, we discuss the particular characteristics of each choice criterion.
The criterion of Wald utilizes the estimates Fmin(Xk) or Fmax(Xk). The Wald criterion stipulates that one has to choose the solution alternative XW, for which, for the maximization objective function, the estimate Fmin(Xk) attains maximum, that is,
or, for a minimization objective function, the estimate Fmax(Xk) attains minimum, that is
The use of this criterion generates solution alternatives, assuming the most unfavorable combination of initial data. It guarantees that the objective function level is not greater than a certain value at any possible future conditions (in the case of the maximized objective function) or is not lesser than a certain value at any possible future conditions (in the case of the minimized objective function). This is its dignity (Belyaev 1977). On the other hand, the orientation toward the most unfavorable combination of initial data is extremely cautious (pessimistic or conservative) (Belyaev 1977).
The criterion of Laplace uses the estimate ![]() and is oriented to choose the solution alternative XL, for which this estimate attains its maximum:
and is oriented to choose the solution alternative XL, for which this estimate attains its maximum:
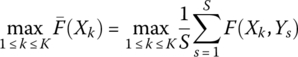
for a maximization objective function, or its minimum

for a minimization objective function.
This criterion corresponds to the principle of “insufficient reason” (Belyaev 1977), that is, it is based upon the assumption that we have no basis to distinguish one or another combination of initial data. Thus, it is necessary to act as they are equally probable. This is its drawback. However, the average score is sufficiently important.
The criterion of Savage is associated with the use of the estimate rmax(Xk) and allows one to choose the solution alternative XS, for which this estimate reaches minimum:
As in the case of the Wald choice criterion, the use of Eq. (6.10) is based on the minimax principle. Therefore, the Savage choice criterion can also be considered conservative. However, experience (Belyaev 1977) shows that the recommendations based on applying Eq. (6.13) are mismatched with the decisions obtained with the use of Eq. (6.10). Operating with values of rmax(Xk), we obtain a slightly different evaluation of the situation, which could lead to more “daring” (less conservative) recommendations.
Finally, the criterion of Hurwicz utilizes a linear combination of the estimates Fmin(Xk) and Fmax(Xk) chooses the solution alternative XH for which this combination attains the maximum:
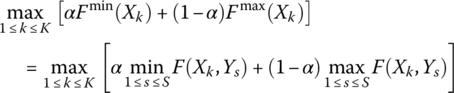
for a maximization objective function, or the minimum:

for a minimization problem.
In Eqs. (6.14) and (6.15), α ∈ [0, 1] is the index “pessimism‐optimism” whose magnitude is defined by a DM. If α = 1, the Hurwicz choice criterion is turned into the Wald choice criterion, and if α = 0, Eq. (6.15) is turned into the “extreme optimism” (minmin) criterion for which the most favorable combination of initial data is assumed. When 0 < α < 1, we obtain something that is an average and this is the attractiveness of the Hurwicz criterion. Belyaev (1977) recommends choosing a range from 0.5 to 1.
Generally, we can talk about obtaining so‐called robust solutions (Roy 2010) in the case of applying the Wald and Savage choice criteria. Besides, the use of the Hurwicz choice criterion with the index “pessimism‐optimism” α = 1 also provides robust solutions.
6.4 Elements of Constructing Representative Combinations of Initial Data, States of Nature, or Scenarios
The first stage in the decision‐making process is concerned with the construction of a payoff matrix for all combinations of the solution alternatives Xk, k = 1, 2, …, K and the representative states of nature Ys, s = 1, 2, …, S. Taking this into account, it is necessary to indicate that the questions related to constructing representative combinations of initial data, states of nature, or scenarios, including the definition of their number, are of a general nature and the corresponding answers vary from area to area (Amer et al. 2012). Generally, the main condition in building representative combinations of initial data, states of nature, or scenarios is that each scenario is to be the representation of a plausible reality (Durbach and Stewart 2012).
Given the experience of (Pedrycz et al. 2011; Pereira et al. 2015) in the present work, so‐called LPτ‐sequences (proposed in Sobol' 1966, 1979 and classified in Niederreiter 1978) are also used to construct the representative combinations of initial data, states of nature, or scenarios. The sequences of points constructed on the basis of Sobol' (1966, 1979) fill the multidimensional cube in a very uniform mode. These sequences have superior characteristics of uniformity among other uniformly distributed sequences (Sobol' 1979).
The results of Sobol' (1966, 1979) allow one to determine points Qs, s = 1, 2, …, S with coordinates qst, t = 1, 2, …, T in the corresponding unit hypercube QT. For instance, if we have T = 5 and it is necessary to create S = 6 representative combinations of initial data, states of nature, or scenarios, the coordinates of Qs, s = 1, 2, …, 6 for t = 1, 2, …, 5 determined on the basis of Sobol' (1966, 1979) are presented in Table 6.9.
In reality, the selection of representative combinations of initial data, states of nature, or scenarios is reduced to the formation of points of a uniformly distributed sequence in QT and their transformation to the hypercube CT, defined by the lower ![]() and upper
and upper ![]() bounds of the corresponding uncertain coefficient of the analyzed objective function. Taking this into account, if points Qs, s = 1, 2, …, S with coordinates qst, t = 1, 2, …, T form a uniformly distributed sequence in QT, then points Cs, s = 1, 2, …, S with the coordinates are expressed as follows:
bounds of the corresponding uncertain coefficient of the analyzed objective function. Taking this into account, if points Qs, s = 1, 2, …, S with coordinates qst, t = 1, 2, …, T form a uniformly distributed sequence in QT, then points Cs, s = 1, 2, …, S with the coordinates are expressed as follows:
Table 6.9 Points of the LPτ‐sequences in Q5.
| s | t = 1 | t = 2 | t = 3 | t = 4 | t = 5 |
| 1 | 0.500 | 0.500 | 0.500 | 0.500 | 0.500 |
| 2 | 0.250 | 0.750 | 0.250 | 0.750 | 0.250 |
| 3 | 0.750 | 0.250 | 0.750 | 0.250 | 0.750 |
| 4 | 0.125 | 0.625 | 0.875 | 0.875 | 0.625 |
| 5 | 0.625 | 0.125 | 0.375 | 0.375 | 0.125 |
| 6 | 0.375 | 0.375 | 0.625 | 0.125 | 0.875 |
Table 6.10 Example 6.3: Points of the LPτ‐sequences in Q3.
| s | t = 1 | t = 2 | t = 3 |
| 1 | 0.500 | 0.500 | 0.500 |
| 2 | 0.250 | 0.750 | 0.250 |
| 3 | 0.750 | 0.250 | 0.750 |
| 4 | 0.125 | 0.625 | 0.875 |
| 5 | 0.625 | 0.125 | 0.375 |
Table 6.11 Example 6.3: Representative combinations of initial data.
| s | t = 1 | t = 2 | t = 3 |
| 1 | 3.000 | 5.500 | 4.000 |
| 2 | 2.500 | 6.250 | 3.500 |
| 3 | 3.500 | 4.750 | 4.500 |
| 4 | 2.250 | 5.875 | 4.750 |
| 5 | 3.250 | 4.375 | 3.750 |
6.5 Application Example
Let us consider the following problem with interval coefficients present in the objective function:
subject to the following constraints:
Table 6.12 includes points of the LPτ‐sequences in Q4 in accordance with the number of coefficients in the objective function Eq. (6.17). These points can serve for the generation of S = 7 representative combinations of initial data, states of nature, or scenarios.
The application of Eq. (6.16) helps one to process Eq. (6.17) by using points of the LPτ‐sequences of Table 6.12. In particular, one can construct seven optimization problems with deterministic coefficients
which are subject to the same constraints in Eqs. (6.18)–(6.22).
The solutions to these optimization problems are the following:
- s = 1:
 ,
,  ,
,  ,
,  for Eq. (6.23)
 - s = 2:
 ,
,  ,
,  ,
,  for Eq. (6.24)
 - s = 3:
 ,
,  ,
,  ,
,  for Eq. (6.25)
Table 6.12 Application example: Points of the LPτ‐sequences in Q4.
s t = 1 t = 2 t = 3 t = 4 1 0.500 0.500 0.500 0.500 2 0.250 0.750 0.250 0.750 3 0.750 0.250 0.750 0.250 4 0.125 0.625 0.875 0.875 5 0.625 0.125 0.375 0.375 6 0.375 0.375 0.625 0.125 7 0.875 0.875 0.125 0.625 - s = 4:
 ,
,  ,
,  ,
,  for Eq. (6.26)
 - s = 5:
 ,
,  ,
,  ,
,  for Eq. (6.27)
 - s = 6:
 ,
,  ,
,  ,
,  for Eq. (6.28)
 - s = 7:
 ,
,  ,
,  ,
,  for Eq. (6.29)
In such a way, we can form the following four solution alternatives for the problems in Eqs. (6.17)–(6.22):
- X1 = (30, 35, 35, 0)
- X2 = (30, 10, 35, 25)
- X3 = (0, 50, 35, 15)
- X4 = (15, 50, 35, 0)
Substituting these solutions into Eqs. (6.23)–(6.29), one can construct a payoff matrix presented in Table 6.13.
The use of the data in Table 6.13 and the application of Eq. (6.8) produces the risk matrix presented in Table 6.14.
Now, we can build a matrix that includes characteristic estimates. This matrix is presented in Table 6.15.
Finally, analyzing the data in Table 6.15, on the basis of applying the Wald, Laplace, Savage, and Hurwicz choice criteria, it is possible to choose the rational solution alternatives. The Wald criterion in Eq. (6.10) indicates XW = {X1}. The Laplace choice criterion in Eq. (6.12) leads to XL = {X1, X2}. The use of the Savage choice criterion in Eq. (6.13) produces XS = {X1}. The Hurwicz choice criterion in Eq. (6.15), applied with α = 0.75, also generates XH = {X1}.
Table 6.13 Application example: Payoff matrix.
| Y1 | Y2 | Y3 | Y4 | Y5 | Y6 | Y7 | |
| X1 | 535.00 | 565.00 | 505.00 | 520.00 | 580.00 | 462.50 | 577.50 |
| X2 | 535.00 | 577.50 | 492.50 | 507.50 | 542.50 | 500.00 | 590.00 |
| X3 | 580.00 | 550.00 | 610.00 | 553.75 | 613.75 | 458.75 | 693.75 |
| X4 | 557.50 | 553.75 | 561.25 | 540.62 | 608.12 | 449.38 | 631.88 |
Table 6.14 Application example: Risk matrix.
| Y1 | Y2 | Y3 | Y4 | Y5 | Y6 | Y7 | rmax(Xk) | |
| X1 | 0 | 15.00 | 12.50 | 12.50 | 37.50 | 13.12 | 0 | 37.50 |
| X2 | 0 | 27.50 | 0 | 0 | 0 | 50.62 | 12.50 | 50.62 |
| X3 | 45.00 | 0 | 117.50 | 46.25 | 71.25 | 9.37 | 116.25 | 117.50 |
| X4 | 22.50 | 3.75 | 68.75 | 33.12 | 65.62 | 0 | 54.38 | 68.75 |
Table 6.15 Application example: Characteristic estimates.
| Fmax(Xk) | Fmin(Xk) | rmax(Xk) | ||
| X1 | 580.00 | 462.50 | 535.00 | 37.50 |
| X2 | 590.00 | 492.50 | 535.00 | 50.62 |
| X3 | 693.75 | 458.75 | 580.00 | 117.50 |
| X4 | 631.88 | 449.38 | 557.50 | 68.75 |
6.6 Conclusions
We have considered the classic approach to taking into account the uncertainty factor in analyzing monocriteria decision‐making models. This approach is associated with the construction of so‐called payoff matrices, reflecting effects that can be obtained for different combinations of solution alternatives (strategies) and representative combinations of initial data, states of nature, or scenarios. To obtain rational solution alternatives, the payoff matrices are processed with the use of so‐called choice criteria, which are discussed. Some of them permit one to construct robust solutions. The basic phases to support the utilization of the classic approach have been presented. The questions of the construction of representative combinations of initial data, states of nature, or scenarios on the basis of applying LPτ‐sequences have been discussed. The LPτ‐sequences have superior characteristics of uniformity among other uniformly distributed sequences. The use of the presented results has been illustrated by solving the monocriteria problem in conditions of uncertainty.
Before processing with the generalization of the classic approach to dealing with the uncertainty factor in multiobjective problems (Chapter 7), it is worth noting that there have been some other models addressing the consideration of uncertainty. For instance, in Yager (1996); Kuchta (2007); and Wen and Iwamura (2008), fuzzy sets were discussed as a viable alternative, and in Ahn and Yager (2014) the OWA operator was used for decision‐making under uncertainty. However, all these studies are focused on monocriteria problems.
Exercises
- 6.1 Using the data in Table 6.10, construct four representative combinations of initial data, states of nature, or scenarios for an objective function that includes the following three interval coefficients:
- c1 = [1, 5]
- c2 = [3, 6]
- c3 = [2, 7]
- 6.2 Apply the classic approach to considering the uncertainty of information (taking into account α = 0.75 for the Hurwicz choice criterion) to analyze the payoff matrix given in Table 6.16. The objective function is to be minimized.
Table 6.16 Problem 6.2: Payoff matrix.
Y1 Y2 Y3 Y4 X1 10 12 12 11 X2 8 13 11 14 X3 10 11 12 13 X4 12 13 12 9 - 6.3 Apply the classic approach to considering the uncertainty of information (taking into account α = 0.75 for the Hurwicz choice criterion) to analyze the payoff matrix given in Table 6.17. The objective function is to be maximized.
Table 6.17 Problem 6.3: Payoff matrix. Y1 Y2 Y3 Y4 X1 105 112 96 118 X2 95 115 108 120 X3 110 98 99 115 X4 107 111 102 107 - 6.4 Verify the possibility of changing the solution of the problem, defined by Problems 6.1 and 6.2, for the Hurwicz criterion in the case of setting α = 0.25.
- 6.5 The levels of the characteristic estimates given in Table 6.15 have permitted the selection of the solution alternative X1 on the basis of applying the Hurwicz choice criterion with setting α = 0.75. It is necessary to find a boundary value of α that permits one to select the solution alternative X4 instead of X1, applying the Hurwicz choice criterion.
References
- Ahn, B.S. and Yager, R.R. (2014). The use of ordered weighted averaging method for decision making under uncertainty. International Transactions in Operational Research 21 (2): 247–262.
- Amer, M., Daim, T.U., and Jetter, A. (2012). A review of scenario planning. Futures 46 (1): 23–40.
- Belyaev, L.S. (1977). A Practical Approach to Choosing Alternate Solutions to Complex Optimization Problems Under Uncertainty. Laxenburg: IIASA.
- Durbach, I.N. and Stewart, T.J. (2012). Modeling uncertainty in multi‐criteria decision analysis. European Journal of Operational Research 223 (1): 1–14.
- Hodges, J.L. and Lehmann, E.L. (1952). The use of previous experience in reaching statistical decisions. The Annals of Mathematical Statistics 23 (3): 396–407.
- Kaufman, G.M. (1961). Statistical Decision and Related Techniques in Oil and Gas Exploration. Englewood Cliffs: Prentice Hall.
- Kuchta, D. (2007). Choice of the best alternative in case of a continuous set of states of nature‐application of fuzzy numbers. Fuzzy Optimization and Decision Making 6 (2): 173–178.
- Luce, R.D. and Raiffa, H. (1957). Games and Decisions. New York: Wiley.
- Niederreiter, H. (1978). Quasi‐Monte Carlo methods and pseudo‐random numbers. Bulletin of the American Mathematical Society 84 (6): 951–1041.
- Pedrycz, W., Ekel, P., and Parreiras, R. (2011). Fuzzy Multicriteria Decision‐Making: Models, Methods and Applications. John Wiley & Sons.
- Pereira, J.G. Jr., Ekel, P.Y., Palhares, R.M., and Parreiras, R.O. (2015). On multicriteria decision making under conditions of uncertainty. Information Sciences 324: 44–59.
- Raiffa, H. (1968). Decision Analysis. Reading, MA: Addison‐Wesley.
- Roy, B. (2010). To better respond to the robustness concern in decision aiding: four proposals based on a twofold observation. In: Handbook of Multicriteria Analysis (eds. C. Zopounidis and P.M. Pardalos), 3–24. Berlin: Springer.
- Sobol', I.M. (1966). On the distribution of points in a cube and integration grids. Achievements of Mathematical Sciences 21 (5): 271–272. (in Russian).
- Sobol', I.M. (1979). On the systematic search in a hypercube. SIAM Journal on Numerical Analysis 16 (5): 790–793.
- Trukhaev, R.I. (1981). Models of Decision Making in Conditions of Uncertainty. Moscow (in Russian): Nauka.
- Webster, T.J. (2003). Managerial Economics: Theory and Practice. London: Academic Press.
- Wen, M. and Iwamura, K. (2008). Fuzzy facility location‐allocation problem under the Hurwicz criterion. European Journal of Operational Research 184 (2): 627–635.
- Yager, R.R. (1996) Fuzzy set methods for uncertainty representation in risky financial decisions. Proceedings of the IEEE/IAFE Conference on Computational Intelligence for Financial Engineering, New York, NY, pp. 59–65.