
Atomic force microscopy (AFM) and related tools for the imaging of foods and beverages on the nanoscale
Abstract:
This chapter discusses the use of atomic force microscopy, atomic force spectroscopy and optical tweezers as tools for probing the nanostructures of foods and the molecular origins of the functional properties of foods and beverages. Emphasis is given to the uses of these techniques that have led to new insights in food science and to potential new applications in the near future.
5.1 Introduction
The development of probe microscopes, capable of visualising and manipulating materials at the atomic and molecular levels, probably spawned the birth of the fields of nanoscience and nanotechnology. Probe microscopes image by feeling rather than viewing a sample: a sharp probe is positioned close to the sample surface and the probe and sample scanned relative to each other (Binnig et al., 1986). The magnitude of the interaction between the probe and the surface will depend on the roughness of the surface. Through monitoring changes in this interaction, whilst the probe and sample are scanned relative to each other, it is possible to produce a 3D profile of the sample surface. By selecting different types of probes, or by modifying the nature of the probe, it is possible to monitor different types of interaction. Thus, in addition to generating topographic images of the surface, it is also possible to map various material characteristics such as charge, chemical or biological structure, magnetic properties, mechanical or frictional behaviour. By varying the separation of the probe and sample at a given sample point it is possible to quantify the nature of the interaction and also to apply various forces to manipulate or modify the surface.
The most common form of probe microscopy used for studying biological systems (Morris et al., 2010) is the atomic force microscope (AFM). This instrument generates images by measuring changes in the force between a sharp probe and a sample surface as the probe and the sample are scanned relative to each other. The earliest studies of biological systems were of biological molecules or assemblies deposited onto flat substrates and often imaged in air. A major obstacle was the need to prevent the probe damaging or displacing the sample. Method development allowed reproducible imaging which was extended to studies of molecules and molecular processes in realistic liquid environments. The production of hybrid AFM/optical microscopes allowed AFM to be used to study more complex structures such as cells and tissues. However, in these first-generation machines the mechanical coupling of the AFM was poor, restricting the resolution to less than that of a stand-alone AFM. Second-generation hybrid instruments have overcome these problems, allowing molecular resolution on complex biological systems. Method development and validation mean that AFM, although not yet routine for biological systems, is now increasingly used as a tool to solve biological problems.
As the use of AFM as an imaging tool has begun to mature, the use as a force transducer is rapidly emerging as a new area of interest. Through measuring the force between the sample surface and the probe, as a function of probe-surface separation, it is possible to investigate the nature of a variety of different types of interactions: this technique is called force spectroscopy. By selecting different types of probes it is becoming possible to investigate the mechanical behaviour of individual molecules, study specific molecular interactions, and to probe the molecular basis of macroscopic phenomena such as colloidal particle interactions, adhesion and friction (tribiology).
The use of AFM and force spectroscopy in food science has mirrored the general developments in the biological sciences. This chapter will discuss the techniques of AFM and force spectroscopy and show how they have evolved to allow solutions to previously intractable problems in food science. Although the AFM possesses many advantages it has certain limitations. The microscopy images are just 3D surface profiles and the use as a force transducer is really restricted to force measurements in the range 102-104 pN; which may exclude studies of certain molecular or weak colloidal interactions.
An alternative technology, known as optical tweezers (Neuman and Nagy, 2008), permits studies of these weaker forces covering the range 0.1 − 100 pN. Optical tweezers allow particles to be captured and positioned using laser beams. The technique was originally developed as a tool for manipulating particles (cells) but has emerged as a powerful tool in biology for measuring interactions over a wide range from the molecular to the colloidal (cellular) level. Optical tweezers have matured as a technique for probing forces but the use of force measurements to generate images has been less developed. By noting the change in the forces as the probes interact with surfaces, or move within interfaces or inside biological systems, it is possible to create maps of these structures based on non-specific or specific interactions. Within biological systems these will be true 3D images.
The use of optical tweezers in food science has suffered due to the lack of commercial instruments. At least one such instrument (the JPK NanoTracker™) is now available and it is anticipated that this will lead to new applications in food science. This chapter will look at optical tweezers as a technique and consider potential applications to solve problems in food science.
5.2 Methods
5.2.1 Atomic force microscopy
The structure and concept of the AFM is surprisingly simple for such a powerful and elegant instrument. Although called a microscope its mode of operation is unlike that of conventional light or electron microscopes. The AFM generates images by pressing on a surface and assessing the response. The most common analogy is that of a blind person forming an image by touching an object. In much the same way that a blind person obtains information on the texture of surfaces in addition to their shape and size, the AFM can image surface contours, but also map material properties such as adhesion, hardness or charge. To generate an image it is necessary to scan the sample relative to a sharp probe (Fig. 5.1). This can be achieved by scanning the probe in a raster fashion over the surface or by scanning the sample surface beneath the probe: the latter being the most common form of imaging. Piezoelectric devices are used to move the sample in three dimensions. The simplest type of piezoelectric device is a tube scanner (Binnig and Smith, 1986) but a new geometry piezoelectric scanner, called a flexure-stage, is emerging as a replacement for simple tube scanners in modern high-performance AFMs (Morris et al., 2010). However, the principle is the same and the sample is moved by controlling the expansion and contraction of the piezoelectric material. The practical resolution of the instrument is thus effectively determined by the noise level on the electrical signal used to control the shape of the piezoelectric devices. A range of tips and cantilevers are available for different types of applications. The most commonly used tips are microfabricated from silicon nitride (Albrecht and Quate, 1988) and they are pyramidal in shape, approximately 3 μm in height with a typical tip radius of approximately 30–50 nm (Fig. 5.1). The tips are positioned at the end of a cantilever. At the start of an experiment the tip is brought towards the sample surface and a predetermined force is applied to the surface. When the sample is scanned beneath the tip the distance between the tip and the sample surface changes, causing the force on the tip to change and the cantilever to bend and/or twist. The bending and twisting can be recorded by reflecting the light from a low power laser beam from the end of the cantilever onto the surface of a four-quadrant photodiode. This enables the bend or the twist to be defined in terms of a potential difference, or error signal. This error signal can be manipulated to generate a 3D image of the surface in several ways.
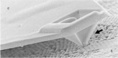
Fig. 5.1 Scanning electron micrograph of a typical tip-cantilever assembly, showing the pyramidal tip (p) at the end of a ‘V-shaped’ cantilever (c) positioned over a substrate surface (s). The tip is approximately 3 μm in height.
Imaging
Images are generally generated by raster scanning the sample beneath the probe. A typical scan involves a matrix of 256 × 256 points. At each image point the system dwells for a predetermined period of time before moving to the next image point. The total image is acquired by scanning the matrix line by line. Most images are generated from the error signal monitoring the up and down motion of the cantilever. The motion of the cantilever depends on the change in normal force experienced at each image point. For homogeneous samples the change in force results solely from the change in separation between the tip and the surface and the resultant error signal can be used to generate a topological map of the surface. If the sample is heterogeneous then changes in material parameters such as charge, adhesion or stiffness contribute to the image contrast. Imaging conditions can then be designed to enhance such contrast, and to map particular material characteristics of the sample surface.
Imaging modes
Modern AFM can be used in a number of pre-set imaging modes (Garcia and Perez, 2002; Holscher and Schirmeisen, 2005; Meyer, 1992; Morris et al., 2010). The simplest type of imaging mode to describe is ‘dc contact mode’. At the first image point the separation between the tip and the surface (the applied normal force) is pre-set. When the AFM moves to the next image point the resultant error signal is fed into a feedback circuit that controls the vertical displacement of the sample by the piezoelectric device. During the dwell time the motion of the sample is adjusted in order to try to reduce the error signal to zero. The actual vertical motion of the sample can then be amplified and used to provide an image of the surface. If the dwell time is long enough, and the sample is homogeneous, then the x, y and z motion of the sample produces a 3D map of the surface topography. For heterogeneous samples additional image contrast arises from material properties that alter the force between the tip and the surface.
An alternative form of imaging called the ‘deflection mode’results from switching off the feedback circuit and amplifying the error signal during scanning. The grey levels in the image correspond to changes in force and they are not direct measures of surface topography. However, they are an indication of the surface structure, and an advantage of this mode is that images can be acquired very rapidly, and high-speed video rate imaging can effectively be achieved by collecting and processing the analogue signal from the photodiode (Humphris et al., 2005).
For rough samples very long dwell times are needed in order to completely zero the error signal at each image point. Under these conditions the AFM can be operated in an intermediate mode, sometimes called the ‘error signal mode’. The feedback circuit is switched on, but the dwell times are not sufficient to completely zero the error signal, and the residual error signal at each image point is used to generate the final image. This mode of operation is particularly useful for imaging rough samples. Generally images are normalised in order to maximise the use of grey levels to display contrast in the images of the sample surface. In the case of rough samples, fine detail in the dc contact mode image can be obscured, because most of the grey levels are used to accommodate the relatively large, slowly varying background in the image. The feedback circuit can correct for this slowly varying background, and hence the feedback circuit effectively acts as a filter, removing the background and enhancing the fine detail in the image. Thus this type of image, although not a topological image, can provide a quick pictorial representation of the structure, which facilitates later processing of the true topographical images to remove the background and display the fine detail in the image.
If the cantilever is twisted then this is likely to arise from friction or localised adhesion between the tip and the sample surface. For heterogeneous samples the changes in adhesion can be monitored and then used to generate frictional or adhesive maps of the surface. If the adhesive forces between the tip and the sample become too large then the act of scanning the sample beneath the tip can damage the sample. Such effects can be serious if the AFM is used to image biological structures or single molecules deposited onto flat substrates: imaging in air can therefore distort, destroy or even displace deposited structures. The most common cause of adhesion when imaging in air arises from what are called ‘capillary forces’. When biological samples are deposited from solution onto a substrate then most of the aqueous solvent will evaporate leaving the ‘dry’ biological material on the substrate. In practice a thin layer of water remains, coating both the substrate surface and the surface of the tip. As the tip is brought into close ‘contact’ with the substrate, coalescence of these surface layers occurs, effectively gluing the tip onto the substrate. When the sample is scanned beneath the tip, it becomes very difficult to lift the tip over the deposited sample. This is also the reason why tips used to image biological systems, particularly in air, often have a finite lifetime, after which the image quality begins to decay. During scanning, the tips pick up debris from the sample which leads to localised adhesion with the substrate and the sample. The tip will then damage the sample, rip through the sample, or displace it across the substrate. Clearly, the effect of capillary forces can be eliminated if images are acquired under liquids or by using techniques (ac imaging modes) that inhibit the coalescence (Garcia and Perez, 2002; Holscher and Schirmeisen, 2005; Meyer, 1992; Morris et al., 2010).
Imaging under liquids requires that the sample and substrate are contained within a liquid cell. Different makes of AFM use different types of liquid cells. Images can be acquired under different types of liquids. If high-resolution images of biopolymers are required it is quite often useful to image the deposited molecules under a precipitant. This prevents any desorption from the surface and can, quite often, induce the molecules to adopt an ordered conformation which, in turn, restricts molecular motion and blurring of the image. When the liquid used is a solvent for the molecules, it is necessary to develop methods which pin the molecules onto the substrate surface and thus prevent desorption or motion of the molecules on the substrate surface.
Even in air it is possible to eliminate the effects of capillary forces by reducing the contact time between the tip and the sample surface: this can be achieved through the use of what are called ‘ac imaging modes’ (Garcia and Perez, 2002; Holscher and Schirmeisen, 2005; Meyer, 1992; Morris et al., 2010). In this mode an external stimulus is used to excite the cantilever to oscillate close to its resonant frequency. Interactions between the tip and the sample will alter the amplitude and the phase of the oscillation and both these factors can be employed to generate images of the sample. The detailed acquisition and display of such images differs for different makes of commercial AFM. Energy loss in different regions of the sample during imaging will give rise to changes in phase, and thus the phase images are often very sensitive to differences in material properties of the samples, and hence give enhanced contrast in the images. However, the interpretation of such images is still not straightforward.
Nowadays the most common form of ac imaging is ‘Tapping mode™’ (Garcia and Perez, 2002). In this mode the amplitude of the oscillation is large and the tip only momentarily ‘taps’ onto the sample surface. Through the use of stiff cantilevers it is possible to effectively prevent adhesion, and hence to limit damage to the sample. The use of ‘Tapping mode’ largely eliminates frictional or adhesive forces, but it is more difficult to control the applied normal force, and this can still lead to some sample damage. However, Tapping mode is currently the best method for imaging in air. Tapping and ac images can also be obtained under various liquids, although it becomes harder to select the optimum imaging conditions.
Force, chemical and affinity mapping
At a given image point the variation of the tip–sample separation can be used to generate force–distance curves. For standard tips the initial slope of the force–distance curve has the dimensions of a modulus and can be used to map the mechanical properties of the surface. If the tips and the surfaces are modified by the attachment of molecules then it is possible to use adhesive events to identify and characterise specific chemical or molecular interactions. Through the use of modified tips it is possible to alter and select the type of interaction between the tip and the sample, and this introduces new types of contrast into the images. Standard tips can be altered by chemical treatments or by attaching different molecular species to the tip. With such modified tips it is then possible to locate or map specific structures on a surface. Such procedures are called ‘chemical or affinity mapping’ (Dufrene and Hinterdorfer, 2008). Particular examples are the use of antibody-labelled tips to locate particular molecular species on a sample surface, or the use of chemically modified tips to map hydrophilic or hydrophobic areas on surfaces.
The high resolution of the AFM results from the ability to control the displacement of the sample by small increments using piezoelectric devices. However, each piezoelectric scanner will have a finite scan range and the higher the achievable resolution the lower the maximum scan size. For studies on individual molecules this will not be a problem. However, this causes inconvenience when trying to obtain high-resolution images of more complicated biological structures, because it is difficult to locate the region of interest within the biological specimen. Hybrid AFM-optical microscopes were developed to overcome this problem. In the first-generation instruments an AFM was added onto an inverted optical microscope. The optical microscope was used to identify areas of interest which were then imaged by AFM. The design of the instruments compromised the mechanical stability of the AFM attachment and introduced noise which restricted the achievable resolution. In the design of the latest second generation of hybrid microscopes the AFM is now an integral part of the microscope, and it is now possible to achieve a resolution as good as that for a stand-alone AFM.
Image reconstruction
The resolution achieved by using the AFM is equivalent to that obtained through the use of the transmission electron microscope (TEM). However, the nature of the images obtained using the two types of instrument are very different. The AFM can be used to image under more natural conditions because it images by pressing on the surface of the sample: this can be achieved in air or in a liquid medium. The AFM delivers a surface profile, in contrast to the image obtained in the electron microscope, where the image is generated by passing an electron beam through the object. Thus there is potentially sufficient information in the electron microscope images to allow a 3D reconstruction of the object. Clearly this is not possible with AFM images and, in addition, the AFM image will be modified by the shape and size of the probe tip used to generate the image, and the size of the object being scanned. This effect is called ‘probe broadening’ and it arises because different parts of the tip can interact with the sample during the scan process. The effect can be corrected using calibration standards or simple geometric models (Vesenka et al., 1996) allowing determination of true sample widths. The chief advantages of the AFM are the ability to image under more natural conditions and to produce 3D images from which heights can be directly measured. However, because the imaging process involves pressing the tip onto the sample, the sample will be compressed to some degree during scanning, and the measured height will be smaller than the true height. This effect depends on the deformability of the sample and can be reduced by optimising the normal force applied to the sample during scanning. Surface roughness is an important parameter in food science because it determines the reflection and scattering of light and, as such, the appearance of food samples. The AFM can be used qualitatively or quantitatively to measure surface roughness for quality control, or as a scientific tool to understand the effects of processing on surface structure.
5.2.2 Atomic force spectroscopy
The AFM generates images by pressing on samples. As such it can be thought of as a very delicate mechanical testing instrument. At a given image point on the sample the variation of the tip-surface separation can be used to generate force-distance curves. The measurement of these curves is called force spectroscopy. For standard tips the initial slope of the force-distance curve has the dimensions of a modulus and measurements of this initial slope can be used to map the mechanical properties of the surface. In addition the AFM can also be used as a force transducer to study the mechanical properties of individual macromolecules, or to probe interactions between biological molecules or surfaces. This is achieved by attaching biological molecules to the tip and/or surface. If colloidal particles are attached to the tip it becomes possible to measure and analyse colloidal interactions between particles. The methodology and the interpretation of such force data are still in development and are not as well advanced as for imaging techniques. However, this is a rapidly growing area of interest and it is likely to rival the use of AFM as an imaging tool in the near future. The use of AFM in food science has led to important new insights into the nature of food structure. It is likely that force spectroscopy will have a similar impact in the near future.
Calibration
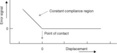
The measurement of force-distance curves requires absolute measurements of force and distance. For hard samples the plot of error signal-distance will be of the form shown in Fig. 5.2. The point of contact of the tip with the sample is clear from the abrupt change in slope of the plot. This defines the zero point and the absolute distance of approach or retraction can be determined from the potential difference applied to the piezoelectric device, knowing the calibration constant for this material. To calculate the force exerted on the tip-cantilever assembly it is necessary to determine the absolute deflection of the cantilever and the force constant (spring constant) of the cantilever. When the tip is pressed onto the hard surface the degree of bending of the cantilever will be linearly dependent on the incremental change in the distance of approach of the sample to the tip: this is known as the constant compliance region. The slope of the plot in the constant compliance region can be used to calibrate the error signal from the photodiode in terms of an absolute deflection of the cantilever: the so-called InvOLS or inverse optical lever sensitivity factor (Meyer and Amer, 1988). It is important to perform the calibration in the liquid medium in which the force measurements are to be made, because the properties of the optical lever deflection system will be dependent on the refractive index of the liquid. This approach is fine for normal tip-cantilever assemblies, but may damage or destroy derivatised tips. An alternative approach is to measure and analyse the thermal noise spectrum of the cantilever as revealed in the photodiode output signal: the different modes of vibration of the cantilever are excited by Brownian collisions between solvent molecules and the cantilever (Higgens et al., 2006). The force constant of the cantilever is normally determined by measuring the resonant frequency of the cantilever. This can be done by exciting the cantilever into resonance or by analysis of the thermally driven excitation of the cantilever. These dynamic calibration procedures have been found to be most appropriate for rectangular shaped cantilevers (Sader et al., 1995, 1999), and use of such cantilevers is best for force spectroscopy studies, particularly for molecular studies. The InvOLS factor and the force constant can be used to convert the measured error signals into forces and to plot force–distance curves. In most of the current generation of AFMs the calculation of the InvOLS factor and the force constant have included in the software modules as semi- or fully automated procedures, and the raw output is presented directly as force-distance curves.
5.2.3 Molecular force spectroscopy
Molecular force spectroscopy can be divided into two types of related studies: the stretching of individual macromolecules and interactions between macromolecules.
Single molecules
Studies on the stretching of individual molecules usually involve depositing the molecules onto a suitable substrate within a liquid cell, and then pressing the tip down onto the surface and measuring the force-distance curves on approach and retract. Biological molecules such as proteins and polysaccharides are fairly sticky and usually bind quite well to the surface and tip. In the biological community most of the studies have been made on the unfolding and refolding of multidomain proteins and model polypeptide structures (Morris et al., 2010; Ng et al., 2007), and the main contentious issue is whether such forced unfolding/refolding events are representative of the processes observed in traditional chemical unfolding experiments. An alternative approach is to pick up a protein and then hold it clamped between the tip and the surface at a relatively low force. It is then possible to monitor the thermally induced changes in structure with time by recording the thermal noise spectra of the cantilever. This type of approach may provide a more representative means of monitoring the types of structural changes seen in solution studies.
Most studies relevant to the food area have been made on polysaccharides (Marszalek et al., 1998, 2001; Morris et al., 2010). The common approach involves ‘fishing’ for adsorbed molecules and, when one is ‘hooked’, the retract curves reflect the extension of the molecule and the rupture point where the molecule breaks or, more usually, where the molecule detaches from the tip or surface (Fig. 5.3). The rupture length provides a measure of the ‘contour length’ of the segment of the molecule attached between the tip and the surface. Fishing will result in random attachment of molecules at different points along the molecules and a range of apparent contour lengths. This can be addressed by normalising the data at a given force value (Zou et al., 2006). This normalisation treatment can be quite useful because often the fishing process results in more than one molecule attached to the tip. Clearly the combined force-distance curves for several molecules will not fit onto the normalised curve, allowing multiple binding events to be detected and discarded from analysis. Individual biopolymers adsorbed to surfaces may have several long-lasting attachment points to the surface with the remainder of the molecule (loops) mobile within the aqueous phase. This type of attachment will give rise to multiple detachment events and this may need to be considered in the analysis of the data. The simplest form of analysis for the extension curves for individual molecules is the use of worm-like coil (Kratky and Porod, 1949) or freely jointed chain models (Beuche, 1962; Smith et al., 1996), which allow an estimate of the persistence length (the localised stiffness of the chain) of the macromolecule. When the contour length of the molecules is large with respect to the persistence length then the stretching will be largely entropic in character, with enthalpic effects appearing at large extensions. The transition region will depend on the molecular weight and the secondary structure of the polysaccharide. In principle the persistence length can be measured under a range of ionic conditions as used for bulk solution studies. In practice a puzzling feature of the analysis is that the values deduced from force spectroscopy measurements appear to be substantially lower than those values determined from bulk solution studies, or by an analysis of the shape of the molecules, as determined from AFM or TEM studies.

Molecular interactions
Ideally, for the stretching of single molecules, it would be useful to attach one end of the molecule to the tip, and then to derivatise the surface with a ligand that binds to the other end of the molecule. This is difficult to do and is seldom used in stretching studies of individual polysaccharides. However, covalent attachment of molecules to the tip and surface is essential if one wishes to probe specific interactions between macromolecules. An example might be a study of potential carbohydrate-lectin interactions (Touhami et al., 2003). In this case the tip would be suitably derivatised and incubated with the carbohydrate: the coupling chemistry can be chosen to attach the carbohydrate at the reducing end, allowing the remainder of the carbohydrate to dangle, offering the non-reducing end for binding to the lectin. An alternative is to attach the carbohydrate to a derivatised sphere, and then to glue the sphere to the tip-cantilever assembly. The lectin can be covalently attached to a suitably derivatised surface: it is important to protect the binding site of the protein during the attachment. This can be done by attaching a lectin-inhibitor complex, protecting the binding pocket, and then, after attachment, releasing the inhibitor by dialysis or washing (Gunning et al., 2009). Finally, it is useful to cap any free ends of the coupling agents prior to binding studies. The potential binding between the two molecules can be probed by raster scanning the sample surface relative to the modified tips. When a binding event is detected the retract curve shows adhesion and a rupture event (Fig. 5.4). For a polysaccharide binding to a lectin the area under the retract curve, in the hysteresis region, provides a measure of the energy required to extend the polysaccharide chain and then to break the carbohydrate-lectin bond, and the force required to break the linkage can be determined at the rupture point. Although care should be taken in the design of the experiment in order to eliminate non-specific interactions, these may sometimes occur. The need to extend the polysaccharide chain, prior to breaking the linkage, allows non-specific interactions, which will occur at the point of zero separation, to be distinguished from specific interactions, which will occur a distance characterised by the contour length of the polysaccharide. Specific interactions can also be identified by the addition of an inhibitor molecule, which should compete for binding with the lectin, and thus eliminate, or markedly reduce, carbohydrate–lectin binding. For smaller oligosaccharides it may be useful to add a spacer molecule as part of the coupling reaction when attaching either the protein or the oligosaccharide to surfaces (Hinterdorfer et al., 1996, 2002). Suitable polyethylene glycol (PEG) molecules of various lengths are available: these PEG spacers provide freedom of movement of the oligosaccharides or proteins allowing them to find and bind to each other. In addition they provide a defined extension region allowing the specific interactions to be identified. Interactions can be probed at different approach and retract speeds. This can be used to probe the dynamics of the interactions within the binding pockets: the rupture force scales linearly with the natural logarithm of the loading rate, and hence several slopes in the plots of rupture force versus loading rate will indicate the existence of several energy barriers within the binding site, and the widths of energy barriers can be determined. By extrapolating loading rates to slower speeds one can probe infinitely slower interactions, approaching equilibrium conditions, and hence extract equilibrium binding constants for the interaction.
Colloidal particle interactions
By attaching colloidal particles to the tip and to a surface it is possible to probe interactions between these particles in a range of media (Ralston et al., 2005). The surfaces of the particles can be modified and the nature of the bulk medium can be changed to study the forces of interaction and the consequences in detail. The studies of such interactions, between hard or soft particles, are now part of the emerging field of ‘Soft Matter’. The studies allow us to understand better the behaviour of dispersions, emulsions and foams. In studying colloidal interactions the AFM has to compete with the other more established techniques of the surface force apparatus (SFA) and total internal reflectance microscopy (TRIM), and with the emerging technique of optical tweezers. Each of the techniques has its own advantages and disadvantages. TRIM allows dynamic measurements on particles that are free to rotate and translate but the charges on the particles often have to be heavily screened in order to allow the particles to approach close enough to the surfaces of interest. The absolute separation of the surfaces can be determined by interferometry. The SFA is limited to the cross-cylinder geometry and the substrate needs to be silvered mica in order to measure the absolute separation between the surfaces.
AFM is a versatile technique in that, because the particle can be attached to the cantilever, there is more choice in the types of particles and particle surfaces that can be studied. Furthermore, it is possible to probe directly interactions between two particles in an aqueous medium. Like the SFA the particles are driven together and, for hard particles, the point of contact can be determined. Thus the absolute separation between the surfaces can be defined. The main limitations in the use of AFM is the poor ability of the AFM to study very low speed interactions, due to problems with piezoelectric drift and creep of the scanners, and the difficulties associated with maintaining the high standard of cleanliness required for these studies, when using small AFM liquid cells. Despite this the field has continued to grow and has led to new insights into the understanding of colloidal systems (Ralston et al., 2005).
A recent and interesting aspect of the use of AFM has been the ability to study interactions between deformable (soft) particles such as air bubbles (Vakarelski et al., 2010) and oil droplets (Dagastine et al., 2004, 2006; Gromer et al., 2010; Gunning et al., 2004a; Woodward et al., 2010a). Some of the difficulties involved in these studies involve the attachment of the particles to the AFM cantilevers and other surfaces, determination of drop size and area of contact with the surfaces and, most importantly, definition of the point of contact between the surfaces. Despite these experimental problems this field is growing and it has already led to new insights and findings relative to food research.
Colloidal probes
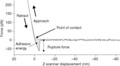
Colloidal probes formed from hard particles are prepared by gluing the particle to the tip-cantilever assembly: this is easier to do than it sounds. One approach involves using fine wires and a micromanipulator to transfer glue and then the particles onto the cantilever. An alternative approach is to dust the particles, usually silica spheres onto a hydrophobic surface, such as the lid of a plastic Petri dish, and then prepare a glass slide with a strip of a recently mixed slow-setting two-part epoxy adhesive. The tip can be lowered down onto the glue until it snaps into the liquid, pulled away, and then pressed down onto the particles, locating them near the end of the cantilever. Once the AFM snaps onto the particle it can be pulled away dislodging the particle from the surface. The idea is to attach the particle without engulfing the particle entirely with glue. In this context it is useful to examine the modified cantilevers by scanning electron microscopy (SEM) after the colloidal studies are complete (Fig. 5.5). For chemically modified beads it can be more difficult to dislodge them from the surface after attachment to the cantilever. However, this can be done if a small level of shear is introduced as the tip is retracted from the surface.
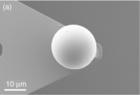
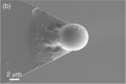
Fig. 5.5 Scanning electron micrographs of colloidal probed glued to tip-cantilever assemblies. Examples of (a) a well-prepared sample, and (b) a poorly prepared sample where too much glue has been used and it has coated the sphere. Images obtained by Kathryn Cross.
Similar approaches can be used to attach deformable particles such as oil droplets (Gunning et al., 2004a) or air bubbles (Vakarelski et al., 2010) to cantilevers and surfaces. For oil droplets it is possible to spray oil droplets onto a ‘cleaned’ glass surface and then carefully add ultrapure water to the slide without dislodging the droplets. The low-power optical microscope of a hybrid optical/AFM can be used to position the AFM tip over a droplet and the tip can then be driven down into the droplet. The cantilever is then retracted, carrying the captured droplet away from the surface (Fig. 5.6). The exercise is carried out directly in an aqueous medium. Once the droplets are present on the tip and the surface the bulk composition can be varied and used to adsorb different interfacial structures onto the droplets. This has to be done after attachment because, once the droplets are coated, they are impossible to transfer from the surface onto the cantilever. The process works best for V-shaped cantilevers but can be used for rectangular cantilevers, although the assembly has less lateral stability. A similar procedure can be used to attach air bubbles to cantilevers. The air bubbles can be generated ultra-sonically on a mildly hydrophobised glass surface. In this case specialised cantilevers have been designed to attach the bubbles. These are rectangular tip-less cantilevers with a small gold-coated circular platform at the end of the cantilever. The gold surface of the tip platform is hydrophobised by dipping it into a solution of decanethiol in ethanol. These modified tips can then be used to capture an air bubble (Vakarelski et al., 2010).
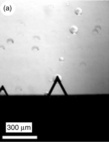

Fig. 5.6 Images illustrating the attachment of an oil droplet to a 200 μm long silicon nitride cantilever. (a) The tip has been driven into an oil droplet on the glass substrate. All of the droplets on the glass substrate are in focus. (b) The attached droplet has been lifted above the surface and the drops on the surface are now out of focus. Images obtained by Patrick Gunning.
Execution and analysis
Colloidal force spectroscopy using the AFM is now a quite well-established field (Leite and Herrmann, 2005; Liang et al., 2007; Ralston et al., 2005). Basically the interactions between charged surfaces are described by the DVLO theory. In addition, depending on the nature of the surface of the particles, other factors such as steric repulsion and bridging effects can affect behaviour at close approach. For particles in a fluid environment hydrodynamic forces are important. When the particles are far apart their translational diffusion depends on the viscosity of the bulk medium. As they approach closely the liquid has to drain out from between the particles. The nature of the interaction between the particles will depend on the rate of drainage, and hence bulk viscosity, and the size and approach speed of the particles. Similarly, as the particles move apart the interaction will be affected by the rate at which the fluid flows back between the particles. If the fluid contains small particulates or polymeric material then drainage leads to exclusion of this material from between the particles and osmotic interactions known as depletion forces. Because of the dependence of interactions between particles on the size of the particles it is common to normalise the force data with respect to particle size: the force data are usually plotted as force divided by particle radius versus distance.
A feature of the use of AFM, which is already generating new and unexpected results, is the ability to probe directly interactions between deformable particles in a fluid medium. For the first time this allows the deformation of the droplets or bubbles to be taken into account in describing the interaction. A major problem is to define the point of contact and hence the absolute separation of the surfaces. One approach is the development of an evanescent wave-AFM (Clark et al., 2004) but this suffers from limitations in the distance over which interactions can be studied. A second approach is to fit suitable theoretical models to the data in order to define the point of contact. To this end innovations, such as cantilevers with well-defined hydrophobic patches, which define contact areas, plus direct measurements of particle size are important (Vakarelski et al., 2010). Current research has evolved from early studies, in which the interactions between deformable bubbles or droplets were analysed by DVLO theory, to consider interactions between droplets or between bubbles in defined media, and to develop theoretical models to account for the effects of deformation of the structures on the interactions between the deformable particles (Dagastine et al, 2006; Manor et al., 2008). Experimentally force-distance curves can be generated at a single point on the particle surface or by scanning over a small area on the surface of the particle pinned to the substrate surface. Collection of large data sets can be an advantage because it allows the reproducibility of the data to be assessed and data can be averaged to reduce noise. The approach and retract speeds can be varied, and it is possible to impose a dwell time after approach, before the particles are pulled apart: the latter offers the chance to study transient effects and to probe relaxation behaviour.
It is likely to be these two-particle interactions which lead to new insights into the behaviour of foams and emulsions in the near future. As well as taking into account the deformation of the particles on approach and retract, the methodology allows the correct self-assembly of interfacial structures to be investigated under natural conditions and the viscoelastic nature, and the structure of the interface to be considered in detail.
5.2.4 Optical tweezers
Optical tweezers (Neuman and Nagy, 2008) are a device which is attached to an optical microscope in order to manipulate or observe the behaviour of particles trapped in a focused laser beam (Fig. 5.7). The essential features of the technique are a suitable optical microscope with, for a single optical trap, an attached trapping laser and a high numerical aperture (NA) microscope objective. In order to create the optical trap the laser beam is focused to a diffraction-limited spot using the objective lens. In the vicinity of the focused spot a three-dimensional force acts to move dielectric particles towards the focal point of the laser beam. The magnitude of the force depends on the laser power and the polarisability of the particle. The laser used to trap the particles should have a Gaussian intensity profile in order to achieve the smallest size focused spot and hence the largest optical gradient. For the trap to be stable the microscope objective lens should have an NA of at least 1.2, which requires the use of water or oil immersion objectives. An advantage of water objectives is that they do not suffer from the spherical aberration effects experienced with oil immersion objectives and hence they allow particles to be trapped deep within the solution. The lasers used to trap particles are usually near infrared lasers in order to minimise optical-induced damage to biological samples. Other factors that influence the choice of the laser are the level of fluctuations in laser power, and any movement of the focused spot, since both of these factors will lead to noise in the experimental data. For biological samples the laser of choice is usually a diode-pumped neodymium yttrium aluminium garnet (Nd:YAG) laser which has a wavelength of 1.064 μm. The choice of microscope objective will be determined by the wavelength of the laser.
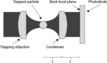
Fig. 5.7 The key elements of an optical tweezers apparatus. f is the focal length of the condenser lens.
Operational modes
The original and simplest use of optical tweezers is as a nano-manipulator to collect and position particles. An optical assembly positioned between the laser and the microscope is used to steer the laser beam and hence to locate the position of the optical trap in three dimensions within the biological sample. The objective lens of the microscope focuses the laser beam and is used to view the trapped particle. However, laser tweezers can also be used to follow the motion of particles within biological systems.
If the image of the trapped particles is focused onto a four-quadrant photodiode then it becomes possible to monitor the movement of a trapped particle: the back focal plane of the microscope condenser lens is imaged on the photodiode. The interference pattern generated between the reflected and transmitted light on the photodiode will alter as the particles move, and hence provides information on the position of the particles in three dimensions. When the displacement of the particles from their equilibrium position within the trap is small (~ 150 nm), then the restoring force will be linearly proportional to the displacement. However, the restoring force is asymmetric. Along the direction of the laser beam the restoring force is determined by the degree of focus of the laser beam, and hence depends on the laser power and the NA of the objective lens. However, within the image plane, which is perpendicular to the beam direction, the restoring force will be dependent on the Gaussian profile of the laser and hence will be axially symmetric. Knowledge of the ‘spring constant’, or stiffness of the system, is needed to use the measured displacement data to calculate the forces acting on the particle as it probes its local environment. Optical tweezers can be used to measure forces in the range of 0.1-100 pN and this can be achieved at a temporal resolution of 10- 4 s. The resolution that can be obtained will depend on the dielectric properties of the trapped particles and the detailed characteristics of the optical trap.
In addition to simply monitoring the changing position of the particles, it is also possible to use the apparatus to control the position of the trap in the specimen plane, and hence the position of the trapping chamber. This is achieved through the use of a feedback circuit. As with the AFM it then becomes possible to maintain constant force acting on the particle or to compensate for problems such as thermal drift. There are two ways that this can be achieved. Firstly, the position of the trap can be moved relative to the sample chamber through the use of piezoelectric controlled mirrors or an acousto-optic deflector. The trap can be displaced very quickly (~ 10 μs) but the extent to which it can be displaced within a single axial plane is limited to distances of a few micrometres. Alternatively, piezoelectric devices can be employed to move the trapping chamber relative to the trap. This allows the effective 3D displacement of the particles to be controlled over a larger spatial range (~ 100 μm) but in this case the temporal resolution is reduced (~ 10 ms).
In order to use the optical tweezers as a force transducer it is necessary to accurately determine the position of the particles and to determine the stiffness of the optical trap. The position detector can be calibrated by directly observing the motion of a bead over a known distance. There are several methods which can be used to determine the stiffness of the trap. The most commonly used approaches involve either modelling the thermal motion of the particle within the trap, or using Stokes law to compare the trapping force with the viscous drag exerted on the particles undergoing motion within their liquid environment.
5.3 Applications
5.3.1 Atomic force microscopy
The use of AFM in food science has provided new information on food structure and has led to the solution of a number of previously intractable problems. The following account is intended to illustrate the type of information that can be obtained using the technique and to describe those areas where the use of AFM has generated significant new insights.
Biopolymers
The AFM is an ideal tool for imaging food macromolecules. Methodology has been developed to image food polysaccharides and proteins which generally involve depositing the molecules onto atomically flat substrates such as freshly cleaved mica (Morris et al., 2010).
Polysaccharides
The primary structure of polysaccharides determines the type of information that can be obtained from AFM images. Polysaccharides where there is free rotation about the inter-sugar linkages adopt a spherical, random coil configuration in solution. When deposited onto mica, and even when imaged in air, the polysaccharides are contained within a thin layer of solvent retained on the substrate. The molecules are able to access all configurations over periods of time which are rapid when compared to the scan time used to image the molecules. The AFM images obtained are time-averaged structures, and the molecules appear as blurred spherical objects, the size of which increases with the molecular weight of the polymer.
Certain polysaccharides show restricted motion about the inter-sugar linkages and exist as semi-flexible coils in solution. Examples of these types of polysaccharides are amylose, xyloglucans, arabinoxylans, alginates or pectin. After deposition onto mica, if these molecules are then imaged under buffers, the molecules will, with time, desorb from the substrate (Gunning et al., 2000). This process involves motion of the molecules and makes it difficult to obtain information on molecular structure. However, a range of strategies can be devised to pin the molecules onto the substrate: a common approach for negatively charged polysaccharides is the use of divalent ions to bind the polymer to the substrate. An alternative approach, which can be used for most polysaccharides, is to image the molecules under a precipitant such as butanol. Once the motion of the molecule has been frozen the images can be analysed to obtain contour length distributions and to estimate molecular weight distributions. By examining the shape and size of the molecules it is possible to obtain information on molecular stiffness, through the calculation of the persistence length. For such information to be meaningful it is important to establish that the method of deposition and imaging has not influenced the shape of the molecules. Imaging under butanol may induce the formation of ordered conformations but this can be assessed by comparing images obtained under precipitants and under buffer. Even if the images are obtained under buffer it is still necessary to establish that the procedures which are used to bind the molecules to the substrate do not alter the shape of the deposited molecules.
A feature of the use of AFM has been new information that has been obtained on the branching of polysaccharides (Fig. 5.8) (Gunning et al., 2003; Ikeda et al., 2005; Kirby et al, 2007; Round et al., 2001, 2010). Ifthe branches are due to the presence of short sidechains, if the sidechains are flexible, or if the sidechains are attached to the backbone via flexible linkages then they are difficult to visualise. However, the distribution of sidechains along the backbone will lead to local variations in height or stiffness of the polysaccharides. Certainly in the case of mucins it has been possible to analyse such variations to obtain information on the glycosylation patterns of mucins (Round et al., 2004). In principle such methods could be used to analyse branching distributions along individual polysaccharide chains. Heterogeneity of polysaccharide structures can be emphasised by binding molecules that recognise specific structural features. This type of approach has been used to analyse the heterogeneity of mucins and arabinoxylans by imaging and analysing the binding of antibodies (Round et al., 2007) or inactivated enzymes (Adams et al., 2004) to selected regions of the polymer chains. The presence and location of specific types of sidechains can be determined by selective enzymatic or chemical degradation of the polysaccharides. Pectin extracts are known to contain homopolymeric regions of polygalacturonic acid plus complex branched regions containing acid-labile neutral sugar sidechains: in most textbooks a composite structure is shown with the branched regions contained within the homopolymer sequences. However, imaging of such extracts during acid hydrolysis showed that the extract contained homopolymers of polygalacturonic acid, plus aggregated structures containing the neutral sugars. Breakdown of the aggregates by cleavage of the neutral sugar linkages released homopolymers, providing new information on the potential assembly of pectin within plant cell walls (Round et al., 2010).
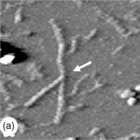
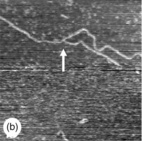
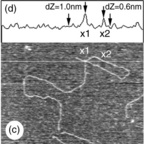
Fig. 5.8 AFM images ofbranched polysaccharides. The branch points are indicated by the white arrows. (a) A branched pectin molecule (scan size 230 × 230 nm). (b) A branched amylose molecule (scan size 500 × 500 nm). (c) At branch points (a & b) the height is unchanged, whereas on overlap of chains the height of the molecules increases: overlap of amylose chains (c − scan size 500 × 500 nm) leads to an increase in height (d).
Using AFM it has been possible to obtain new information on infrequent branching of the polysaccharide backbone for the polysaccharides pectin (Kirby et al., 2007; Round et al., 2001) (Fig. 5.8a), arabinoxylans (Adams et al., 2003) and also amylose molecules (Gunning et al., 2003) (Fig. 5.8b). Complex multi-branched structures have also been reported for the surface-active soya bean polysaccharide (Ikeda et al., 2005). For these structures new information can be obtained on the number of branches per molecule, the branch length distribution and the relative numbers of linear, branched or multi-branched molecules within a population. Certainly in the case of pectin the branching of the backbone was unexpected and the observed low levels of branching would be difficult to detect by chemical analysis. Knowledge of the shape and size of molecules, and the extent and distribution of branches, is important in understanding the viscosity and viscoelastic behaviour of these molecules in solution.
Some of the most familiar food polysaccharides are those that can be induced to adopt ordered conformations in solution: these materials are used to induce functional behaviour such as thixotropy and gelation. The helix-forming polysac-charides xanthan, gellan, agar and the carrageenans are examples of these types of polysaccharides. Most of these polysaccharides have been very well characterised by standard physical-chemical techniques. In this case the AFM has been used to generate new information on the modes of association of the polysaccharides responsible for generating thixotropy and gelation.
Proteins
Proteins, like polysaccharides, adsorb fairly easily to substrates such as mica and hence are relatively easy to image. The majority of food proteins are globular and have dimensions similar in size to the radius of curvature of the AFM tip. The structures of most of the proteins are known from TEM studies, or from crystal structures determined by X-ray diffraction, and the AFM images, complicated by probe broadening effects, are unlikely to yield valuable new information. For certain unusually shaped meat and plant proteins, such as collagen, actin, myosin, gelatin or soya proteins, the AFM provides similar information to that obtainable from TEM studies, although under milder preparative conditions. The area where the AFM has proved to be useful is in investigating the self-association of these molecules, in order to understand the nature of bulk protein gels, or the structures formed at air-water or oil–water interfaces and that are responsible for the stability of food foams and emulsions.
Protein–polysaccharide complexes
Proteins tend to be surface-active and they are used in the food industry to stabilise emulsions and foams. Most natural polysaccharides are not surface-active although they can be chemically modified to make them more hydrophobic. There are, however, a few natural polysaccharide extracts that do show useful surface activity. These include gum arabic, sugar beet pectin and water-soluble wheat pentosans (arabinoxylans). Gum arabic is a very important emulsifier for the food industry. A feature of all of these extracts is that they contain a detectable amount of protein which is difficult to remove from the extract and is believed to be present as protein–polysaccharide complexes. The complexes are considered to contribute, at least in part, to the surface activity of the extracts. Because AFM has the ability to image individual molecules under natural conditions it should be possible to visualise and characterise such protein–polysaccharide complexes. However, such ‘surface active polysaccharide extracts’ have proved to be difficult to image.
Studies on gum arabic illustrate the likely origins of this difficulty in obtaining images. Gum arabic extracts contain three fractions: arabinogalactan which is the major fraction, an arabinogalactan-protein complex (~ 10%) and a glycoprotein (~ 1%). When gum arabic extracts are deposited onto freshly cleaved mica results the AFM images show aggregated structures. This probably occurs because the complex becomes concentrated at the air-water interface leading to self-association of the protein component as the aqueous solvent evaporates. As will be discussed later in this chapter surfactants can disrupt such protein networks. Certainly if a neutral surfactant such as Tween 20 is added during drop deposition then small individual molecules can be seen. However, as suggested by the authors (Ikeda et al., 2005), it is believed that the molecules seen on the mica are the arabinogalactan and not the protein–polysaccharide complex.
For the water-soluble arabinoxylans and sugar beet pectin extracts, which also contain protein difficult to remove by conventional separation methods, it did prove possible to image the complexes. Both materials proved difficult to image after drop deposition, again possibly due to aggregation at the air–water interface during drying. Where images were obtained of the entire extract evidence was obtained for the existence of protein–polysaccharide complexes. In the case of the arabinoxylans enzymatic treatment to degrade the protein resulted in images of the polysaccharide component alone (Adams et al., 2003). In the case of the sugar beet pectin extracts it was difficult but possible to image the complexes. The images suggested that about ~ 67% of the pectin molecules in the extract contained what was attributed (Kirby et al., 2006a) to be a protein molecule attached to the end of the polysaccharide chain (Fig. 5.9). The direct observation of these complexes by AFM provided evidence for the presence of protein–polysaccharide complexes and provided a basis for understanding their role in stabilising food foams and emulsions.
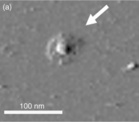
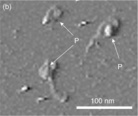
Fig. 5.9 AFM images of pectin-protein complexes present in sugar beet pectin extracts. (a) A complex (arrowed) with the pectin chain wound around the protein. (b) Several complexes with different levels of extension of the pectin chain. The position of the protein (P) is indicated by the arrows.
As has been discussed earlier, the binding of inactivated enzymes to polysaccharide chains can be used to assess the structural heterogeneity of the poly-saccharide molecules. Analysis of the binding patterns of inactivated xylanases to arabinoxylans suggested that the distribution of arabinose sidechains was random (Adams et al., 2004). Enzymatic treatment to remove sidechains led to non-random binding patterns. However, detailed analysis of the binding patterns to deduce the mode of action of the enzyme is complex and would require simulations in order to calculate the expected binding patterns of the inactivated probe.
Sometimes the nature of the complexes formed between proteins and poly-saccharides can yield new information on the mechanism of action of enzymes. A good example of the use of AFM to obtain and interpret such information is a study on the starch-binding domain (SBD) of glucoamylase, which facilitates the breakdown of crystalline starch structures. The AFM images of the starch poly-saccharide amylose provided information on the contour length distribution. AFM images of the complexes formed on the binding of amylose to the SBDs revealed novel cyclic structures (Fig. 5.10a). The dimensions of the cyclic complexes and the contour lengths of the amylose determined from the images provided enough information to uniquely describe the nature of the binding between the amylose and the SBDs (Fig. 5.10b). This model for the complex suggested a new molecular model (Fig. 5.11a-d) to describe how the glucoamylase can degrade crystalline starch (Morris et al., 2005). The SBDs were found to act as a template for the formation of an expanded amylosic double helix, suggesting that the SBD could recognise and dock onto the ends of amylosic double helices at the surface of starch crystals.

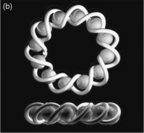
Fig. 5.10 Amylose-SBD complexes. (a) The circular complexes formed between amylose and the SBD (scan size 800 × 800 nm). (b) A model of the complex showing the binding of the amylose to the two binding sites on the protein.
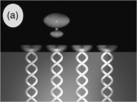
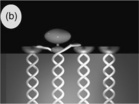
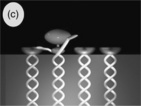
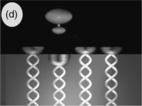
Fig. 5.11 Glucoamylase contains a catalytic domain linked to the starch-binding domain (SBD) through a flexible linker region. The diagram suggests a role for the SBD in the hysdrolysis of crystalline starch. (a) Approach of the glucoamylase to the end of an amylosic double helix at the surface of a starch crystal, the free ends of the amylosic chains are shown blurred indicating molecular motion. (b) Docking of the SBD onto the end of the helix locates the ends of the amylosic chains near the catalytic domain of glucoamylase. (c) The catalytic domain cleaves the ends of the amylosic chains. (d) Release of the SBD.
Biopolymer gels and networks
As discussed earlier, AFM methods developed for imaging individual proteins and polysaccharides can be used to probe the self-association of proteins and polysaccharides. These studies on gel precursors provide insights into the mechanisms of gelation (Morris, 2007a). In certain cases the AFM can be used to image the actual molecular networks formed by the bioplymers.122 Nanotechnology in the food, beverage and nutraceutical industries
Polysaccharide gels
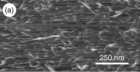
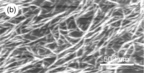
Thermoreversible gels are an important class of gelling agent used in the food industry. Such gels are formed by charged helix-forming polysaccharides such as the carrageenans and gellan. Gelation is triggered by helix formation on cooling from the sol state and the gels melt on heating (Morris, 2007a). The molecular changes that occur during gelation are similar and can be illustrated through studies on gellan gum, which can be regarded as a model system: unlike the carrageenans, which contain irregularities in their primary structure, gellan gum is a bacterial polysaccharide with a regular chemical repeat unit. For both gellan and the carrageenans there is a substantial literature on the physical chemical basis for gelation (Morris, 2007a). These studies suggest that gelation involves two discrete and separable steps: helix formation on cooling and helix aggregation. The polysaccharides are charged and increasing ionic strength screens the charge, promoting helix formation, stabilising the helix and raising the melting temperature of the helix. Certain ‘gel-promoting cations’ enhance helix aggregation and gelation. In the absence of ‘gel-promoting cations’ some association can occur but the networks formed are weak, often not self-supporting, and they are found to break easily at low deformation. The physical-chemical studies provide quite a lot of information on the local, ordered structures formed in the gel, but provide little information on the long-range network structure which is what determines the mechanical properties of the gels. AFM can be used to investigate the mechanism of gelation (Gunning et al., 1996a; Morris, 2007a, 2007b) by studying the structures formed by gel precursors, the network structures formed in films or, in certain cases, the actual structures within bulk gels (Fig. 5.12). In the absence of ‘gel-promoting cations’ the gellan gel precursors are thin branched fibrils (Fig. 5.12a). These structures show no hysteresis in their setting and melting temperatures and are believed to form solely through double helix formation, usually between gellan chains of unequal length. On addition of ‘gel-promoting cations’ the fibrils are seen to have associated into thicker branched fibres (Fig. 5.12b). The variable thickness of the fibres is attributed to a cation-induced side-by-side association of the fibrils.
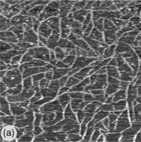
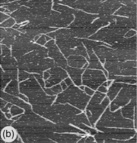
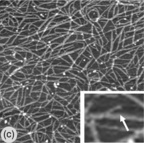
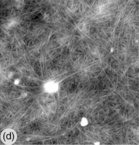
Fig. 5.12 AFM images of gellan gel precursors, films and gels. (a) A topography image of gellan fibrils formed in the absence of gel-promoting cations (scan size 1 × 1 μm). (b) A topography image of gellan fibres formed in the presence of gel-promoting (potassium) cations (scan size 800 × 800 nm). (c) A topography image of a hydrated gellan film formed on mica (scan size 800 × 800 nm). The inset shows a zoomed image of a fibre showing a fibril branch (arrowed) which has not developed further into a thicker fibre. (d) A topography image of the fibrous network structure at the surface of a hydrated bulk acid-set gellan gel (scan size 2 × 2 μm).
The AFM images of the gel precursors at sub-gelling concentrations suggest a basis for understanding the form of the association of the polysaccharides at the higher concentrations that lead to gel formation. Imaging the network structure formed in hydrated bulk gels is difficult because the tip will deform the network structure on scanning, blurring the image. An easier structure to image is a thin hydrated film formed on the mica substrate. The network structures formed in the films are easier to image because the imaging process compresses the polymer network down onto the hard mica substrate, leading to less deformation of the network. The long-range structure observed within the film is a continuous branched fibrous network composed of aggregated gellan fibrils (helices) (Fig. 5.12c). The inset in Fig. 5.12c shows a branch from a fibril that has not developed further into a fibre. For gellan it has been possible to find conditions to observe the networks directly in a bulk aqueous gel. Under acidic conditions gellan forms high-modulus gels which show negligible distortion on scanning. The high-resolution AFM image (Fig. 5.12d) of the network structure present on the upper surface of the gel is seen to be equivalent to the branched fibrous structure observed in hydrated films. The nature of the ordered junction zones formed in gellan gels have been extremely well characterised by physical chemical methods and through the modelling of X-ray fibre diffraction data. What the AFM images provide is new information on the long-range structure within the gels. The gels are fibrous networks in which the junction zones act as a glue creating sticky patches that bind the helices together into the fibres. This is in contrast with previous models of ther-moreversible gels where very little was known about the long-range structure, and the gels were generally pictured as rubber-like networks with extended junction zones linked by disordered polysaccharide chains.
This type of fibrous structure has also been observed by AFM in other gelling polysaccharides such as pectin (Morris et al., 2009) an example of a cold-setting, thermally irreversible gel. AFM images of gel precursors and fragments released from bulk gels reveal a branched fibrous network (Fig. 5.13). Once again the ordered junction zones appear to act as sticky patches linking the individual polysaccharides together into fibres.
Protein gels
Proteins form thermally irreversible heat-set gels (Morris, 2007a). Aggregation of the proteins begins when they are heated above a certain characteristic temperature where some degree of unfolding of largely intramolecular β-sheet structure occurs. Collisions between proteins are considered to lead to intermolecular β-sheet and this aggregation process continues on cooling the sample. Protein gels are usually thermally irreversible and opaque: cooked egg white gels are a familiar example. Opaque gels are formed when the repulsive interactions between the proteins are reduced or screened. TEM and light microscopy images suggest that these gels are largely colloidal or particulate networks formed from aggregated protein particles. Such gels are difficult to image by AFM. Even the gel precursors can be difficult to image by AFM because of their large size and the deformability of the aggregates (Ikeda, 2003a, 2003b). However, if the repulsions between proteins are not screened then the proteins can form transparent gels. Under these conditions, in the early stages of association, linear protein aggregates are formed (Gosal et al., 2004; Ikeda, 2003a, 2003b; Ikeda and Morris, 2002). These types of structure are generally easy to image and the images provide new information on the extent, and nature, of the aggregation process, as a function of preparative conditions. In the simplest case the aggregates are long chains of protein but more sophisticated structures, such as hollow tubes, have been reported and characterised for certain milk proteins. A puzzle is how these linear gel precursors ultimately associate to form gels. To form a transparent network they must aggregate further to form fairly open branched networks. At present there are no clear AFM data suggesting how this occurs, and there are very few AFM studies on the molecular microstructure in bulk films and gels. The use of AFM to study protein association is a growing area of research, mainly due to the interest in the nature of amyloid structures which are implicated in a number of disease processes.
Gelatin is still quite widely used as a thermoreversible gelling agent in the food industry. Gelation of gelatin is considered to be similar to that of gellan and the carrageenans. Like the polysaccharides the fibrous protein gelatin undergoes a reversible helix-coil-helix transition on heating and cooling. AFM studies have been used to study network formation both in the bulk and at air-water interfaces (Mackie et al., 1998). The aggregation and assembly process can be seen to involve helix formation and association. The networks are fibrous structures similar to those reported for thermally reversible polysaccharides.
Protein networks at interfaces
Protein adsorption at air-water and oil–water interfaces leads to the formation of 2D elastic networks that are important in stabilising food foams and emulsions. Studies on the structure of these networks is an area where AFM has made an large impact, mainly because it allowed imaging, for the first time, of such interfacial structures at the molecular level (Morris and Gunning, 2008).
It is not possible to image directly the networks formed at an air–water or oil–water interface: the tip would be sucked through the interface and would damage the protein network on scanning. Thus, in order to investigate the types of structures formed at interfaces, it is necessary to use a model system. Interfacial structures can be created on a Langmuir trough and Langmuir-Blodgett (LB) methods used to sample and visualise the interfacial structures by depositing them onto substrates: usually freshly-cleaved mica substrates. Both air-water and oil–water interfaces can be studied. The interfacial structures can be created by spreading the molecules at the interface or by allowing the proteins to adsorb from the bulk phase. The latter case is a more realistic representation of what will occur in real food systems. However, as the interfacial structure is pulled onto the mica substrate it can become obscured by passive adsorption of protein from the bulk phase. Because the proteins form elastic networks they will not desorb from the interface into the bulk. Therefore it is possible to perfuse the protein from the bulk phase prior to sampling the interfacial structure (Morris et al., 2010).
An unexpected and particularly important result of the use of AFM to image proteins networks formed at interfaces was the observation (Gunning et al., 1996b) that the networks contained defects (holes). This heterogeneity at the molecular level proved to be crucial in understanding the mechanism of competitive displacement of proteins by surfactants: a process of importance in determining the stability and lifetime of food foams and emulsions.
Protein-surfactant interactions
Competitive displacement of proteins from interfaces by surfactants is a very important process that leads to the destabilisation of foams and emulsions. Surfactants are more surface active than individual proteins and, given sufficient time and sufficiently high surfactant concentrations, the surfactants will eventually displace the proteins from an interface. By linking together to form networks the proteins make it harder for the surfactants to colonise the interface: they resist displacement. The use of AFM has illustrated how the surfactants overcome this resistance.
The AFM images in Fig. 5.14 show how films of the protein β-lactoglobulin are displaced from an air-water interface by the non-ionic surfactant Tween 20. The images show the progressive colonisation of the interface by the surfactant. The process can be driven by the addition of small incremental increases in bulk surfactant concentration, and visualisation of the ‘steady state’ interfacial structure formed at each step, or by the addition of a large bulk surfactant concentration, and sampling of the interfacial structure with time. In the earliest stages of displacement small surfactant domains nucleate within the holes in the protein structure. This is important because, without such defects, it is difficult to see how the surfactant would be able to invade the interface. Once nucleation has occurred the surfactant domains are seen to grow in size. An important result of the AFM images is the observation that the colonisation of the interface by surfactant is heterogeneous, rather than homogeneous, and the AFM data explain why this is so (Mackie et al., 1999).
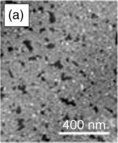
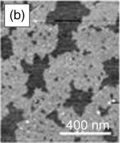
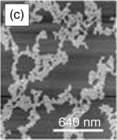
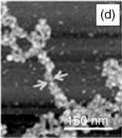
Fig. 5.14 Orogenic displacement of β-lactoglobulin (grey) from an air-water interface by the neutral surfactant Tween 20 (black) at different surface pressures (a) 18.6 mN/m, (b) 20.2 mN/m, (c) 22.5 mN/m and (d) 22.5 mN/m. The higher-magnification image shows individual proteins (arrowed) holding the network together.
The AFM images are more than just pictures of the interfacial structure: rather they are 3D representations of this structure. By analysing the images it is possible to determine both the area occupied by protein and also the height of the protein network. The images thus monitor changes in the protein volume, and hence the effective surface concentration of protein, during the displacement process. Such measurements clearly show that as the surfactant domains grow, the protein concentration remains unchanged and then, quite suddenly, at a certain surface pressure (concentration of adsorbed surfactant concentration), the protein is expelled from the interface into the bulk phase.
At the higher surfactant concentrations it is clear that the proteins form an elastic network and that this network structure resists displacement. The expanding surfactant domains compress the network until the protein strands surrounding the surfactant domains break. At that point protein can be expelled from the interface into the bulk phase. The original holes in the protein network are crucial for displacement to occur. These holes arise because the proteins partially unfold and interact when they adsorb onto the interface. As they adsorb and start to form networks the space which is available for further adsorption will begin to decrease. Eventually there will be insufficient room for further protein adsorption, leaving holes in the network.
Once the surfactant has gained a foothold on the interface more surfactant can enter the nucleated domains forcing them to expand. As the surfactant domains expand they compress the protein network. Energy is stored by refolding of individual proteins and then folding and buckling of the network structure.
The heterogeneity of the network is indicated by the irregular shape of the surfactant domains. The domains grow more easily at points where it is easier to refold the protein network, indicating variability in the unfolding and interaction between proteins. Eventually, the protein network breaks, releasing individual proteins, or protein aggregates, that can be displaced by the surfactant.
The use of AFM demonstrated the heterogeneity of the protein networks and heterogeneity in the displacement process at the molecular level. It was these factors that allowed this novel displacement mechanism to be discovered (Mackie et al., 1999). The process which involves the folding, buckling and eventual failure of the protein network has thus been termed ‘orogenic displacement’.
To date the mechanism of displacement appears to be generic for all proteins studied and for different types (neutral, charged, water soluble and oil soluble) of surfactants, at both air-water and oil–water interfaces: if the proteins form networks then the networks have to be broken in order to release and displace protein (Morris and Gunning, 2008). Some differences have been observed in the behaviour of charged and neutral surfactants. For charged surfactants domain nucleation is found to be favoured over domain growth and little expansion of the individual nucleated domains is seen to occur. However, the growing occupancy of the interface with surfactant domains still leads to compression of the protein network which eventually fails (Gunning et al., 2004b; Mackie et al., 2000).
The generic nature of the displacement process means that interfaces can be stabilised either by strengthening the protein network or by preventing surfactants reaching the interface. The earliest studies of this type were made on purified proteins and individual surfactants. Commercial food products will contain a mixture of proteins, surfactants and even possibly some surface-active polysaccharide extracts. The protein samples used as commercial foam stabilisers or emulsifiers will be isolates rather than pure proteins. Thus the interfaces in real foods will be quite complicated structures containing mixtures of proteins and other surface-active components. An important question is whether the simple models of protein displacement described above can be extended to accommodate this level of structural complexity.
To answer such questions more complex models are required. A difficulty in studying mixtures of proteins is that different proteins are hard to distinguish by AFM alone. However, by using a combination of AFM and fluorescence microscopy, together with proteins tagged with different coloured fluorescent labels, it has been possible to examine the structures formed by binary mixtures of proteins, and the displacement of such structures from interfaces by surfactants. The picture that emerges is that when mixtures of proteins adsorb at interfaces, they rapidly interact and become kinetically trapped in an immobile network, with little evidence of phase separation. Addition of surfactant leads to displacement through an orogenic mechanism. For mixed networks the different proteins appear to interact with each other to different extents and, as the surfactant domains expand, they appear to break the weakest links, preferentially displacing those proteins which, on their own, would form the weakest networks. For labelled proteins this is clearly evident from the change in colour of the network as displacement occurs. An important observation is that the final failure of the mixed network is actually dominated by the protein components which, on their own, would form the strongest network (Mackie et al., 2001; Morris and Gunning, 2008). What is perhaps surprising is that this appears to be true even if this protein is only a minor component of the mixture. Thus it is possible to predict the general behaviour expected for networks formed by protein isolates, provided the composition is known (Woodward et al., 2004). In practice the preparation and isolation of pure proteins and isolates will be different and this can modify the quality of the network formed.
So far the studies have been made on model systems where the interfacial structure is sampled from interfaces spread on a Langmuir trough. Do the conclusions apply to real interfaces and also to the finite curved surfaces present in real foams and emulsions? From the AFM measurements it is possible to predict the growth in the size of neutral surfactant domains. When the domains reach a certain size they should and have been observed directly at interfaces by Brewster angle microscopy, confirming that the displacement occurs at the interface and is not induced by the sampling methods. Studies made on liquid lamellae as models for foam drainage have shown the presence of domains of different thickness when both protein and surfactant are present at the interface (Clark et al., 1990, 1994; Wilde and Clark, 1993). Since the protein should form essentially immobile networks the molecular dynamics in the two types of domains should be very different. Dynamics studies made by fluorescence recovery after photobleaching (FRAP) measurements have revealed different rates of diffusion for the molecular species present in the domains of different thickness (Clark et al., 1990, 1994). Highly mobile molecules were found in the thinner ‘surfactant’ domains whereas the thicker ‘protein’ domains were found to contain immobile molecules, consistent with formation of a protein network. These studies suggest that the mechanisms observed in sampled interfaces are likely to apply in real foams. For finite sized, spherical oil droplets it is possible to monitor the surfactant-induced displacement of proteins by using a colorimetric method to determine protein content at the interface. An alternative approach, which can be used if the charged protein is displaced by a neutral surfactant, is to monitor the change in surface charge or potential during displacement. In both cases an abrupt ‘orogenic-like’ displacement process was observed (Woodward et al., 2010a). As will be discussed later, it is possible to use force spectroscopy to follow the breakdown of the interfacial protein network at the surface of an oil droplet on addition of surfactant. These studies have all shown orogenic displacement occurs from oil droplets and hence is applicable to the discussion of emulsion stability.
Protein–polysaccharide complexes at interfaces
Sugar beet pectin extracts have proved to be a useful model system for studying the type of structure formed at air-water and oil–water interfaces. AFM images of the pectin extract (Fig. 5.9) suggest a mixture of individual pectin chains (~ 33%) together with protein–pectin complexes (~ 67%) in which the protein appears to be attached at one end of the pectin chain (Kirby et al., 2006a, 2007). Alkali treatment can be used to break the protein-pectin linkage and the protein alone has been shown to form elastic interfacial networks. Studies suggest that the complex preferentially adsorbs at the interface and the structures formed depend on the concentration of pectin extract in the bulk phase. The AFM images suggest the formation of interfacial protein network in which the attached pectin chains protect and consolidate the strength of the protein network (Fig. 5.15). At the lowest bulk concentrations the interfacial structure is relatively flat containing a noticeable level of defects (holes). As the bulk concentration is increased the density of defects decreases and the roughness of the interfacial structure increases (Gromer et al, 2010). The effect of the interfacial structure on intermolecular interactions between coated oil droplets has been probed by force spectroscopy (Gromer et al., 2010).
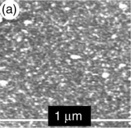
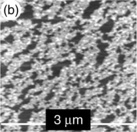
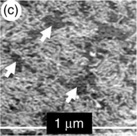
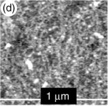
Fig. 5.15 AFM images of sugar beet pectin extracts. (a) The network formed by the isolated protein component. (b) Orogenic displacement of this protein network by Tween 20. (c) Network formed by the protein-pectin complex at 0.1% bulk concentration and (d) at 2% bulk concentration of sugar beet pectin extract. Image sizes are indicated on the images. Note the pectin chains consolidate the protein network and the size of the defects (arrowed) decreases as the bulk concentration increases.
Protein networks and digestion
A challenge to the food industry is to design rationally food structures that enhance health and protect against disease. Due to the consequences of the worldwide growth in obesity there is considerable interest in understanding and manipulating lipolysis to control fat intake. The use of nanoscience tools such as AFM is providing a basis for rational manipulation of food structure. A plausible approach is to manipulate interfaces, either in processed or naturally formed emulsions during digestion of fats, in order to slow the rate of lipolysis and to induce satiety. One approach is the introduction of ‘natural glycolipids’ into the diet. In this context AFM has provided valuable information on the effects of galactolipids on the adsorption of bile salts, co-lipase and lipase into model phospholipid interfacial layers providing valuable new information on the role of galactolipids (Chu et al., 2010). Bile salts locate the lipase–colipase complexes that hydrolyse fats during digestion. Recent AFM studies have shown that the biosurfactants present during digestion (e.g. bile salts) can, and do, displace interfacial protein networks by an orogenic mechanism (Maldonado-Valderrama et al, 2008). These observations suggest that by controlling the rate of growth of bile salt domain on the surface of food emulsions it should be possible to reduce the surface adsorption of lipase in the small intestine, and thus to slow the rate of lipolysis. Preliminary in vitro model studies, using enzymatic means to strengthen a model interfacial protein network, have shown that it is possible to limit orogenic displacement and slow lipolysis under simulated duodenum conditions (Woodward et al., 2010b). For such an approach to be used in real foods it is necessary for interfacial protein networks and/or modified networks to survive gastric conditions on consumption. Systematic studies using AFM, together with a range of interfacial techniques, are beginning to define what happens during digestion and how to design and control food structure (Maldonado-Valderrama et al., 2008, 2009, 2010a, 2010b). The results have led to unexpected findings. The changes in ionic strength, pH and temperature encountered in the gastric environment weaken interfacial protein networks but the networks remain intact. The effects at oil–water interfaces are less severe than at the oil–water interface and the nature of the oil phase and its influence on the assembly of the network is important. In the absence of surfactants or bio-surfactants proteolysis (pepsinolysis) under gastric conditions leads to partial degradation of all surface-adsorbed proteins but the protein networks remain intact and strong. Partial displacement by surfactants enhances proteolysis and can weaken and destroy the protein networks. However, strengthening networks to reduce bile salt domain growth will also reduce orogenic displacement in the stomach, inhibiting the weakening effects of proteolysis, suggesting potential applications for this approach to moderate rates of lipolysis and fat uptake (Maldonado-Valderrama et al., 2009, 2010a).
Self-assembled structures
The carbohydrate structures present in plant material provide examples of self-assembled biopolymer structures. Two key structures of interest to the food industry are starch and plant cell walls. The self-assembled structures and the changes arising on processing and digestion are key to understanding digestion and establishing claims for the health benefits of these materials in the diet. In particular there is interest in screening for natural structures or rational manipulation of processing conditions to enhance the potential health benefits considered to arise from the bacterial fermentation of resistant starch and dietary fibre in the colon and large bowel. With the advent of new hybrid optical/AFM microscopes, it is becoming increasingly possible to characterise such structures by AFM.
Starch
Starch is the major plant carbohydrate consumed by mankind. Plants store energy as water-insoluble spheroidal shaped starch granules, the shape, size and size distribution of which are found to vary considerably with the plant source (Morris, 2007a). The granules are partially self-assembled structures and are ordered and partially crystalline. Disruption of the granule structure yields two distinct species of polyglucan: amylose, an essentially linear polysaccharide, and amylopectin, a highly branched polysaccharide. The chain length of the branches of the amylopectin is regulated during biosynthesis, resulting in crystalline lamellae which are ~ 9 nm in size. Cross-linking of the amylosic chains on the surface of the crystal lamellae is considered to give rise to the structure called amylopectin. These crystallites are aligned with their molecular axes oriented in a radial direction within the granule. Starch granules show a long-range structure called growth rings. In the presently accepted model of the starch granule structure (Daniels and Donald, 2003; Waigh et al., 2000) the growth rings are considered to consist of alternating amorphous and partially crystalline bands. In normal starches, within the partially crystalline growth rings, the crystallites (amylopectin) are considered to be embedded in a matrix of largely amorphous amy lose.
An alternative model has emerged for the granule structure, based largely on high-resolution TEM studies, which allow visualisation of the crystal structure within the granules. These studies suggest that the crystallites are organised into a higher-order structure called a blocklet, and that the blocklets are themselves aligned radially within the growth rings (Gallant et al., 1997). The use of AFM provides a new less invasive approach for visualising the internal structure of the starch granule and thus testing models for granular structure. In order to interpret AFM images of starch it is necessary to identify and explain the origin of contrast in the AFM images. In order to image the internal structure of the granule it is necessary to cut open the granule. Isolated starch granules can be encased in a suitable non-penetrating, rapidly setting resin, cast into small cylindrical blocks and the top of the block honed down with a freshly prepared glass knife to produce a flat, shiny surface, consisting of starch granules with cut exposed internal surfaces (Ridout et al., 2002). In the case of plants which produce dry seeds it is possible to use the natural encasement of the starch within the seeds to allow in situ imaging of the starches. The seeds can be cut open and the cut face honed down to a flat surface using a glass knife (Parker et al., 2008).
The contrast in the AFM images has been shown to arise as a result of preferential absorption of water into certain regions of the exposed face of the cut granules (Parker et al., 2008; Ridout et al., 2004): dry samples show little evidence for internal structure (Fig. 5.16). Minimal wetting reveals a banded structure and, at higher resolution, the globular blocklet structure (Fig. 5.17).
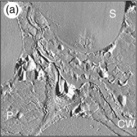
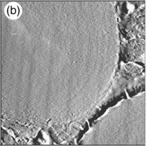
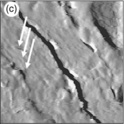
Fig. 5.16 AFM error signal mode images of the cut surface of a dry pea seed. (a) Scan size 18.5 × 18.5 μm revealing the presence of starch granules (S), cell walls (CW) and protein bodies (P). (b) The higher-resolution image 10.0 × 10.0 μm shows starch granules but in this unwetted state no growth rings are visible. (c) A higher-resolution image showing the cell wall region, image size 3.0 × 3.0 μm. The arrows indicate layers of cellulose fibres in two cell walls pushed together.
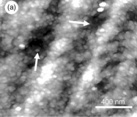
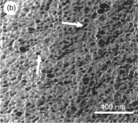
Fig. 5.17 High-resolution AFM images of the internal structure of pea starch granules naturally encased within the dry seed. (a) A topography image showing spheroidal blocklet contained within the growth rings of the granule. Alternate rings contain bright swollen regions and dark, unswollen patches (identified by arrows). (b) A phase image of the same region within the starch granule. The blocklets are seen to be uniformly distributed throughout the granules even in the dark unswollen patches where the contrast between the blocklets and surrounding media is much reduced.
AFM studies (Parker et al., 2008) have provided independent support for the blocklet model (Gallant et al., 1997). An important observation is that the blocklets are distributed uniformly throughout the granule and that all the growth rings are semi-crystalline (Parker et al., 2008). The contrast in the images is attributed to the preferential absorption of water in the amorphous regions of the exposed face of the granule leading to preferential swelling and softening of these areas. Thus the growth ring structure results from slightly different swelling of the amorphous regions in alternate growth rings due to variations in the level of crystallinity in alternate growth rings. High-resolution topography and phase images (Fig. 5.17) reveal that the growth rings can be heterogeneous containing poorly swelling amorphous patches (Parker et al., 2008). The detailed explanation for the heterogeneous distribution of amorphous regions throughout the granule is at present unclear.
The AFM studies of the granular structure do not show evidence for alternate crystalline and amorphous bands as assumed in the conventional model. Rather they suggest a model containing alternate bands with different crystalline/amorphous ratios (Fig. 5.17). In this context it is useful to consider the original microscopy studies which led to the concept of alternate amorphous and crystalline bands. These studies were made on granules treated with acid or α-amylase: the etching removed alternate growth rings. These treatments were considered to cleave preferentially amorphous regions, suggesting the presence of alternate amorphous and crystalline bands. The new AFM data suggest that this explanation may not be quite so clear-cut. Bands with a higher amorphous/crystalline ratio will contain regions which will swell most when treated with aqueous solutions. These regions and bands will therefore absorb preferentially acid or enzyme solutions, leading to a more rapid breakdown of these regions, and allowing the release of the blocklets from these bands. This preferential etching of the most swollen bands could account for the selective removal of material from alternate bands and the structures seen in the original microscopy studies.
As well as providing new insights into the structure of native starch granules the methodology can be extended to explore structural changes resulting from mutations in starch biosynthesis (Ridout et al., 2003). The ability to image starch within single seeds provides a method for screening for interesting changes in starch structure. This approach has been tested by investigating isogenic pea mutants, where the mutations in individual biosynthetic enzymes are expressed in a constant genetic background. Mutations at the r loci (r mutants) affect a branching enzyme involved in the synthesis of the amylopectin-like structures within the granule (Bogracheva et al., 1999; Ridout et al., 2003). This mutation leads to marked changes in the properties of the extracted starches. Gelatinisation of the wild-type starches occurs at ~ 65 °C but, for the r mutant, the gelatinisation of the starch is broadened and complete gelatinisation and swelling of the granules only occurs for temperatures above 100 °C. Unlike the images of the native starches the AFM images (Ridout et al., 2003) of wetted sections, cut from the blocks of encased r mutant pea starch, showed that the granules are fractured and lack visible growth rings. Very little swelling occurs on wetting the samples which remained flat making it difficult to see detail in the image: the contrast was poor. For cut sections deposited onto mica, the surface was mapped using force spectroscopy to emphasise the local hardness of the surface, in order to try and localise the hard crystalline regions and the softer amorphous regions within the granule. These types of images are difficult to obtain and can be subject to artefacts, but the results obtained appeared to show an unexpected and novel fine ‘crystalline’ network structure permeating throughout the granule (Ridout et al., 2003).
The existence of such novel crystalline networks within the granule would explain the changes in properties of these ‘high-amylose’ starches mutants. Disruption of the self-assembly process, by the reduced level of branching activity, could disrupt the regulation of the control of the amylosic chain lengths within the crystals, and lead to the observed broadened gelatinisation behaviour: the length of the chains in the crystals determines the melting point of the crystals (Moates et al., 1997). The presence of such high melting point networks within granules would mean that the granular structure would be retained on processing. Thus these starches are an example of an in planta form of intrinsic resistant starch and would be expected to show interesting nutritional properties. The ability to screen granular structures in isolated starches or seeds offers a method for screening for starches with novel interesting properties.
Plant cell walls
When dry seeds are cut open and imaged by AFM the images reveal other structures besides starch (Fig. 5.16). Even in the dry state it is possible to distinguish between starch granules, protein bodies and cell wall structures (Fig. 5.16a-c). In these samples the contrast in the AFM images arises due to the different hardness of the different regions, and the way different regions are affected when the face is exposed by honing the surface with the glass knife. In the images (Fig. 5.16c) it is possible to see two cell walls pushed together and even to visualise individual cellulose layers within the cell wall. More detail can be obtained on the structure of the cell walls if the cell wall fragments are extracted and deposited onto substrates such as glass and then imaged whilst still wet (Kirby et al, 1996; Round et al, 1996). Images can now be obtained ofregions perpendicular to the planes containing the cellulose fibres (Fig. 5.18a-c). The raw images are disappointing showing little molecular detail. This is because of the roughness of the cell wall fragments (Fig. 5.18a). However, molecular detail can be seen in error signal mode images (Fig. 5.18b) or if the topography images are shadowed. True height images (Fig. 5.18c), emphasising the fine detail in the images, can be obtained by constructing and subtracting a background, representing the general roughness of the cell wall fragment, from the raw images (Round et al., 1996).
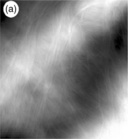
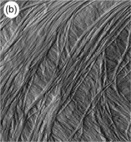
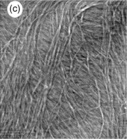
Fig. 5.18 AFM images (scan size 2 × 2 μm) of isolated fragments of wet Chinese water chestnut cell walls fragments showing the layers of cellulose fibres. (a) A topography image in which the grey levels are dominated by the roughness of the sample. (b) An error signal mode image of the same region revealing the layers of cellulose fibres. (c) An image obtained by subtracting the rough background to produce a topographic image showing the layered cellulose structure.
For non-graminaceous plant cell walls the AFM images reveal the stacking of the cellulose fibres within the cell wall. The xyloglucan tethers between the fibres, and the interpenetrating pectin network, are too flexible to image directly, presumably because they undergo rapid thermal motion and are deformed on scanning by the tip. The cellulose fibres are fairly close-packed and the spacings in the swollen networks are consistent with quoted lengths for the xyloglucan tethers. By selectively and sequentially removing these non-cellulosic components the resultant effects on the cellulose networks can be visualised by using the AFM to monitor the interfibre spacing in the hydrated cell wall fragments. Removal of the pectin network was found to lead to shrinkage, consistent with a role for the polyelectrolyte pectin network in swelling the cell wall (Kirby et al., 2006b).
Surface roughness
For solid food structures surface roughness determines the reflection and scattering of light and the visual appearance of food samples. AFM is an ideal measurement tool for qualitative or quantitative assessment of surface roughness. This approach can be used for quality control, or as a scientific tool to understand the effects of processing on surface structure. Examples of this type of study are the use of AFM to monitor changes in surface structure for products such as chocolates and confectionary. The AFM can be used to characterise the presence of surface pores, the presence of embedded cocoa butter or sugar crystals, and to follow phase transitions or crystallisation and growth, during processes such as tempering or storage of chocolate (Rousseau, 2007). Although these types of studies are seldom published in the scientific literature the use of AFM provides a tool for quality control that can be used in industrial laboratories for investigating origins of production problems and for underpinning internal product research and development.
There is also potential for and growing interest in product development in the food industry for the rational preparation of surface coatings by sequential deposition of different molecular layers (Guzey, 2006). This is a form of nanotechnology which can be applied to the design of novel possibly environmentally responsive interfacial structures, coatings or barriers. Although involving the deposition of individual molecular layers the actual preparation of such structures is relatively straightforward, using conventional methods and materials. AFM provides a useful tool to characterise these structures. If the layers are prepared on hard, atomically flat substrates such as mica then, whilst the number of layers is small, it is possible to obtain images of the structures at relatively high resolution. The imaging process and the quality of images obtained are similar to those shown earlier for hydrated gellan films or interfacial protein structures. As the number of layers becomes larger the multilayer structures diffuse and tend to deform on scanning. There is also a tendency for the tips to contaminated, making imaging difficult and causing artefacts. With very diffuse layers the AFM will eventually only provide an indication of surface thickness and roughness, or possibly new information on the softness of the multilayer.
5.3.2 Force spectroscopy
The use of force spectroscopy is still in its infancy and there are only a few examples where it has led to new insights of importance in the food area.
Individual biopolymers
There are a growing number of studies on the unfolding of proteins and the stretching of polysaccharides and this work is reviewed elsewhere (Morris et al., 2010). Much of this work is very elegant but it has not led to new insights relevant to food science. For polysaccharides the stretching studies provide molecular fingerprints of the molecules because the stretching of the molecules depends on the details of the primary and secondary (helical) structure of the polymers. Analysis of the curves generally yields persistence lengths that are significantly less than the values measured in solution, or from AFM or TEM images. Force spectroscopy has been explored as a tool for characterising the heterogeneity of alginates by monitoring the signatures of the different conformational changes from the different ‘blocks’ within the polysaccharide (Williams et al., 2008). It seems most likely that studies of molecular extension will be used to provide new understanding of the molecular origins of friction and adhesion, and the role of surface or interfacial molecular structures on drainage or lubrication, rather than contributing directly to a further understanding of the functionality of individual polysaccharides.
Inter-molecular interactions
Instead of using the AFM to pick up and stretch individual macromolecules, it is also possible to use the AFM to bring two molecules together and then pull them apart in order to characterise the binding between the macromolecules. An example of the type of interaction which can be probed is the specific binding between carbohydrates and lectins (Touhami et al., 2003). In this type of study the carbohydrates or proteins are covalently attached to either the substrate or the tip. Tips can prove difficult to derivatise directly and an alternative approach is to covalently attach one of the molecules to a silica sphere, using suitable coupling chemistry, and then glue this sphere to the tip-cantilever assembly. Such studies can be performed on model systems at the molecular level (Gunning et al., 2009), they can be used to probe interactions between molecules and receptors on cellular systems under physiological conditions (Gunning et al., 2008), or by using suitable probes to map particular molecules, such as adhesins, on bacterial surfaces (Dupres et al., 2005). The molecules are brought together and then pulled apart. The adhesive force (or energy) required to separate them can be used to characterise the specific interaction (Fig. 5.19).
![]()
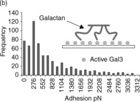
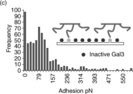
Fig. 5.19 Force spectroscopy data showing the binding between a pectin-derived galactan and the mammalian lectin Gal 3. (a) The force-distance curve. (b) Multiple binding events. (c) Individual carbohydrate-lectin binding revealed by inactivating some of the Gal 3 molecules by addition of an inhibitor.
A number of plant cell wall carbohydrates such as β-glucans or modified pectins are claimed to be bioactive and there are suggestions that this type of bioactivity may result from the consequences of specific interactions between fragments of the carbohydrates and mammalian lectins expressed on the surface of cells. Force spectroscopy provides one of a number of methods for testing such molecular mechanisms (Gunning et al., 2009). A good example is the evidence for the anti-cancer activity of chemically modified pectins (Nangia-Makker et al., 2002; Glinsky and Raz, 2009). The modified pectins are taken orally and appear to show a broad spectrum action against the development and spread of a range of cancers. The proposed molecular mechanism is that the modification procedure releases, or predisposes the release during digestion, of fragments that bind to and inhibit the roles of a key regulatory protein galectin 3 (Gal 3): Gal 3 controls key stages in the differentiation of normal cells and the development of primary and secondary tumours. Using force spectroscopy (Gunning et al., 2009) it has been possible to demonstrate that the only fragment that can be released from pectin and that will bind specifically into the carbohydrate recognition site of Gal 3 is a pectin-derived galactan (Fig. 5.19). These studies support the molecular hypothesis for the role of modified pectin. Testing the origins of bioactivity at the molecular level is crucial to establishing health claims for food products and for defining foods or food supplements that can deliver protection against the onset and spread of chronic diseases such as cancers
Colloidal forces
As described earlier the AFM can be adapted to measure colloidal interactions (Leite and Herrmann, 2005; Liang et al., 2007; Ralston et al., 2005) by coupling colloidal particles, usually spheres, to the end of a tip-less cantilever. The majority of the studies of colloidal interactions have been made by measuring the force between the sphere and a flat substrate in a defined liquid medium. The force between the surfaces is monitored as the sphere approaches or is retracted from the substrate surface. Adhesive forces, if present, are determined from the finite force (rupture force) required to detach the colloidal probe from the surface (Leite and Herrmann, 2005). The types of particles used, or the nature of the surface of the sphere and the substrate, can be modified in a variety of ways, and the interactions are studied in liquid media. Experiments can be performed to model the effects of biological surfaces on interparticle interactions. For example, spores or bacteria have been glued onto tips in order to investigate their attachment to surfaces (Bowen et al., 2002; Ong et al., 1999). Simple model colloidal systems, created by coating spheres and surfaces with protein or surfactant layers, can be used to investigate the role of such interfacial layers on the forces between colloids which determine their stability.
In the case of foams and emulsions a better model system can be achieved by studies on deformable particles. Spheres attached to tip-less cantilevers can be used to probe the deformation of air bubbles and oil droplets. Recently it has become possible to attach bubbles or oil droplets to tip-less cantilevers, and also to suitable surfaces, allowing one to probe the interaction between them in a liquid medium (Gromer et al., 2010; Gunning et al., 2004b; Vakarelski et al., 2010). These types of AFM-based studies are providing new insights into the factors that control the stability of foams and emulsions.
Recent direct studies have been made of the time-dependent interactions between two bubbles under controlled conditions in a liquid media (Vakarelski et al., 2010). These studies provide direct information on the effects of surface deformation and hydrodynamic flow on the time-dependent interactions between the bubbles and on coalescence. The behaviour in the thin films formed between the interacting droplets is important in modelling film drainage and the stability of foam structures. The converse effect on the retraction of the bubbles, under conditions where coalescence does not occur, is also important in understanding lubrication behaviour between soft surfaces. The results on the interactions of the bubbles have been modelled by newly developed theories describing the effects of hydrodynamic flow and particle deformation on the interactions between the particles (Dagastine et al., 2006; Manor et al., 2008). These experimental studies and their analysis show new and unexpected results which would not have been deduced from model studies made using rigid particles. In particular these studies have shown that there are no specific ion effects at high ionic strength and that there is no need for thermal fluctuations to trigger the onset of coalescence between the bubbles.
Similarly, the direct measurement of the deformability of oil droplets and the time-dependent interactions between oil droplets has also led to new and unexpected findings that are important for understanding the stability of emulsions (Gromer et al., 2010; Gunning et al., 2004b; Woodward et al., 2010a). If a rigid particle is attached to the tip-cantilever assembly and pressed against a hard surface then, at the point of contact, the slope of the force-distance curve changes. This is termed the constant compliance region (Fig. 5.2 and 5.20). If the rigid particle is replaced by a deformable oil droplet then there is a change in slope in the region previously called the constant compliance region. The change in slope is a measure, albeit a complex one, of the deformability of the droplet and, if two droplets are pressed together the effect is enhanced. Once the droplets are attached to the cantilever and surface, it is possible to control the interfacial structure by adsorption onto the interfaces from the bulk media. Conventionally, any adsorption that lowers the interfacial tension should lower the Laplace pressure within the droplets, and the droplets should therefore become more deformable. As can be seen in Fig. 5.20 the adsorption of protein, and the ageing of the protein network, makes the droplets harder. Later addition of surfactant softens the droplets. These studies show that the elasticity of the ‘protein skin’ formed on the surface of the droplets dominates the deformation of the droplets. Conversely, by using the deformability of the droplets to follow the viscoelastic behaviour of the interfaces, it has been possible to demonstrate surfactant-induced ‘orogenic’ displacement of protein networks from the surface of finite sized oil droplets in an aqueous medium (Gunning et al., 2004b; Woodward et al., 2010a)
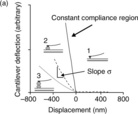
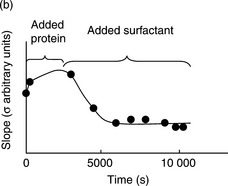
Fig. 5.20 Droplet deformation: in the region known as the constant compliance region for rigid particles the slope of the curve (σ) decreases and can be used as a measure of droplet deformability (a1-a3). The slope (σ) can be used (b) to monitor adsorption of material at the oil–water interface. Addition of protein (β-lactoglobulin) hardens the droplets and subsequent addition of surfactant (Tween 20) makes them softer.
Time-dependent interactions between oil droplets stabilised with surfactants can be modelled using theories which accommodate droplet deformation and hydrodynamic drainage. However, when polymeric material was added to the aqueous medium, and allowed to adsorb onto the bare droplets, the time-dependent interactions revealed new and totally unexpected effects, which could not have been predicted from studies made using hard spheres. Extensive studies have been made using sugar beet pectin extracts (SBP) as an emulsifier (Gromer et al., 2010). At high bulk concentrations of SBP imaging of the interfacial structures showed rough interfaces consisting of a protein network shielded by the attached pectin chains (Fig. 5.15). These interfacial structures led to repulsive interactions between the droplets which occurred over a longer distance to that seen for the interactions between uncoated droplets. This was attributed to steric effects of the carbohydrate coat. Addition of Ca2 + ions into the bulk media was found to induce bridging of the droplets through cation-induced interactions between pectin chains on neighbouring droplets.
The most interesting and novel effects were observed at low bulk SBP concentrations. Imaging of the interface suggested a flat interfacial film. The observed force-distance curves were characteristic of depletion interactions. As the drops approach they flatten and the bulk fluid drains from between the droplets, with the loss of SBP generating an attractive interaction between the droplets. On perfusion to remove the SBP from the bulk phase the interaction between the droplets was seen to return to that of a repulsive interaction, characteristic of uncoated droplets. In order to finally confirm that the effect was due to depletion, and not adsorbed polymer, the studies were repeated using the non-adsorbing polymer polystyrene sulphonate (PSS). Similar depletion effects were seen with PSS. Completely novel and unexpected results were observed when the approach and retract speeds were varied (Fig. 5.21). At the slowest approach speeds the droplets deform as they approach each other and then show a characteristic ‘snap-in’ indicating adhesion but not coalescence. On retraction there is a hysteresis effect with a larger amount of energy required to pull the drops apart. As the approach speed increases the snap-in moves up the approach curve, and then over to, and down the retract curve: the adhesive interaction only then arises as the drops start to move apart. Furthermore, the energy required to pull the drops apart gets smaller as the approach speed is increased. The theoretical models used to explain the behaviour of surfactant-stabilised droplets, which consider droplet deformation and hydrodynamic drainage can be modified by the addition of a depletion interaction, and such models account for the generic aspects of the interactions (Gromer et al., 2010). Essentially, as the droplets approach they flatten and liquid drains from between them, eventually creating a depleted region where they snap together. As the drainage continues this region grows, increasing the energy which will eventually be required to pull the droplets apart. As the approach speed increases relative to the rate of drainage, the point at which the depletion region forms appears to occur later, explaining the motion of the ‘snap-in’ up the approach curve and then down the retract curve. There is also less time for the depletion region to grow, explaining the reduction in rupture energy with increasing approach speed. Clearly force spectroscopy provides a means of examining the effects of interfacial structures on the interactions between deformable particles providing new insights into the mechanisms of stability.
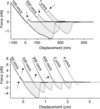
Fig. 5.21 Novel depletion effects observed with polystyrene sulphonate (PSS) in the bulk phase. As the bulk polymer concentration and the loading rate increase the ‘snap-in’ (arrowed) moves up the approach curve and then down the retract curve. With increasing load rate the adhesive energy (shaded area) and the rupture force decrease.
5.3.3 Optical tweezers
The use of optical tweezers as a tool in food science has been limited by the lack of commercial instruments. At least one commercial instrument has become available and it is expected that the use of this technique will grow in the near future. The primary advantage of the use of optical tweezers is for measuring forces which are too small to measure by AFM (typically 0.1–100 pN). A second advantage is the ability to probe the forces acting on particles in complex environments such as inside cells or complex food structures such as gels. Finally, by sensing the interactions of probes with their environment it is possible to build a picture of the structures containing the probe allowing applications as a 3D or 2D microscope.
In the simplest ‘passive’ mode of operation the apparatus can be used to monitor the motion of particles as they sense their local environment. The optical trap determines the local volume within which the particles can diffuse. By probing the thermally induced 3D motion of the particles within a simple fluid it is possible to monitor the diffusional motion of the particle and measure the local viscosity. If the probe particle is moving in a medium which is viscoelastic then information can be obtained on both the viscous and elastic components: the rate of diffusion reflects the viscous term and the size of the local displacements is dependent on the local elasticity of the medium (Gisler and Weitz, 1998; Furst 2005). If the behaviour of the probe is followed with time then it is possible to follow the development of structure within a sample. An example would be the development of elasticity during gelation. In structured media the type of information that can be obtained will depend on the probe size relative to the pore size of the network. If the probe size is small compared with the pore size of the network, then the probe particles can diffuse through the pores of the network, but they will be excluded from the regions occupied by the polymer network. In this way it is possible to use the motion of the particles to map the 3D network structure within the gel (Tischer et al., 2001). Large particles will become trapped in the gel network. The motion of the particles will be caused by thermally induced distortions of the network and this can be used to monitor the viscoelasticity of the gel.
The original intention was to use optical tweezers as a micro-manipulator. Hence they can be used to move a trapped particle close to a surface and then monitor the interaction between the particle and the surface. In food science there is a growing interest in particulate interactions in complex environments such as the gut. Examples include studies to determine the means by which pathogens invade or ‘friendly’ bacteria colonise the gut, studies on the interactions involved in drug delivery, or the uptake of nutrients from particulate food samples. Optical tweezers can be used to probe particulate interactions with surfaces or model surfaces. An example is the use of the technique to study bacterial adhesion to surfaces (Aspholm et al., 2006; Camesano et al., 2007). Through the use of optical tweezers both specific and non-specific particle interactions with surfaces can be monitored and quantitative information obtained on the nature of the interactions. These studies could involve complex model systems mimicking behaviour in the gut or on more well-defined surfaces in an effort to probe the initiation and growth of biofilms. There have been studies of the interaction of virus-coated particles with erythrocytes (Mammen et al., 1996) and, through using beads derivatised with particular molecular species, it would be possible to monitor and map specific interactions with receptors on cellular surfaces.
If molecules are attached to the surfaces of beads then the motion of the bead can be used to follow the motion of the molecule or, conversely, the bead can be used to move the molecule to promote molecular interactions. Derivatised beads on the surface of a membrane can be used to probe molecular motion within the membrane or observe interactions between the probe molecule and the molecular components of the membrane. Similarly, such tethered molecules could be used to explore specific molecular interactions involved in recognition processes, or to test molecular models of the bioactivity of certain food molecules. Beads derivatised with tethered molecules can be used to ‘fish’ for interactions with other molecules on natural or model surfaces. Alternatively, through the use of two optical traps, it is possible to measure molecular interactions between beads derivatised with interacting pairs of molecules.
At present most researchers use home-built optical tweezers designed for particular applications. As commercial instruments become available the use of this technique should become more widespread.
5.4 Future trends
The AFM has matured as an imaging tool in food science. The technique is now widely used even if the imaging process is still not routine. For single molecules there is increasing interest in understanding how they interact on processing and the nature of the aggregates or gel structures they form. A future challenge is to characterise heterogeneity of individual molecules and between molecules in a population. This could be done to investigate the effects of chemical or enzymatic modification or to characterise different plant extracts modified by natural or genetic manipulation. By combining imaging with simulations it may be possible to test mechanisms of action of enzymatic, chemical, physical or genetic modification. Similarly, the use of the newer hybrid optical/AFM microscopes offers the prospect for using AFM in combination with a range of other microscopic methods to follow the effects of genetic (natural or induced) mutations on self-assembled structures such as starch. Here there is growing evidence that the simple mutations can lead to complex heterogeneous populations and it may be possible to map the evolution of such structures during development and growth of the plant tissue. As imaging becomes routine it is becoming possible to use AFM to follow the effects of processes such as digestion on a range of complex food structures.
Whereas imaging is maturing, force spectroscopy is in its infancy but shows great promise. There is clearly further scope for measuring and quantifying specific interactions between macromolecules. There appears to be scope for the technique to be used to probe the molecular origins of particulate adhesion and the effects of interfacial surface layers on adhesion, friction and lubrication. The use of colloidal force spectroscopy to probe interactions between bubbles or oil droplets has already led to new phenomena and new insights into the nature of the interactions that stabilise foams and emulsions. This offers new areas for experimentation and theoretical modelling of these soft matter systems. In the future these methods offer the prospect of following the effects of processing, and even complex phenomena such as digestion, on the structure and stability of model food systems.
The use of optical tweezers both as a force transducer and as a microscopic tool is largely unexplored in the food area. The arrival of commercial instruments will allow such work to be developed. The immediate applications are likely to be in the study of microrheology in structures such as cellular tissue, mucin and complex food structures such as polymer gels and concentrated particulate dispersions.
5.5 References
Adams, L.L., Kroon, P., Williamson, G., Morris, V.J. Characterisation of heterogeneous arabinoxylans by direct imaging of individual molecules by atomic force microscopy. Carbohydrate Research. 2003; 338:771–780.
Adams, E.L., Kroon, P.A., Williamson, G., Gilbert, H.J., Morris, V.J. Inactivated enzymes as probes of the structure of arabinoxylans as observed by atomic force microscopy. Carbohydrate Research. 2004; 339:579–590.
Albrecht, T.R., Quate, C.F. Atomic resolution with the atomic force microscope on conductors and nonconductors. Journal of Vacuum Science and Technology A: Vacuum, Surfaces, and Films. 1988; 6:271–274.
Aspholm, M., Kalia, A., Ruhl, S., Schedin, S., Arnqvist, A., Linden, S., Sjostrom, R., Gerhard, M., Semino-mora, C., Dubois, A., Unemo, M., Danielsson, D., Teneberg, S., Lee, W.-K., Berg, D., Boren, T. Helicobacterpylori adhesion to carbohydrates. Method. in Enzymology. 2006; 417:293–339.
Beuche, F. Physical Properties of Polymers. New York: Interscience; 1962.
Binnig, G., Quate, C.F., Gerber, C. Atomic force microscope. Physical Review Letters. 1986; 56:930–933.
Binnig, G., Smith, D. Single tube three-dimensional scanner for scanning tunneling microscopy. Review of Scientific Instruments. 1986; 57:1688–1689.
Bogracheva, T.Y., Cairns, P., Noel, T., Hulleman, S., Wang, T.L., Morris, V.J., Ring, S.G., Hedley, C.L. The effect ofmutant genes at the r, rb, rug3, rug4, rug5 and lam loci on the granular structure and physico-chemical properties of pea seed starch. Carbohydrate Polymers. 1999; 39:303–314.
Bowen, W.R., Fenton, A.S., Lovitt, R.W., Wright, C.J. The measurement of Bacillus mycoides spore adhesion using atomic force microscopy, simple counting methods, and a spinning disk technique. Biotechnology & Bioengineering. 2002; 79:170–179.
Camesano, T.A., LIU, Y.T., Datta, M. Measuring bacterial adhesion at environmental interfaces with single-cell and single-molecule techniques. Advances in Water Resources. 2007; 30:1470–1491.
Chu, B.S., Gunning, A.P., Rich, G.T., Ridout, M.J., Faulks, G.M., Wickham, M.S.J., Morris, V.J., Wilde, P.J. Adsorption of bile salts and pancreatic colipase and lipase onto digalactosyldiacylglycerol and dipalmitoylphosphatidylcholine mono-layers. Langmuir. 2010; 26:9782–9793.
Clark, D.C., Coke, M., Mackie, A.R., Pinder, A.C., Wilson, D.R. Molecular-diffusion and thickness measurements of protein-stabilised thin liquid-films. Journal of Colloid and Interface Science. 1990; 138:207–219.
Clark, D.C., Mackie, A.R., Wilde, P.J., Wilson, D.R. Differences in the structure and dynamics of the adsorbed layers in protein-stabilised model foams and emulsions. Faraday Discussions. 1994; 98:253–262.
Clark, S.C., Walz, J.Y., Ducker, W.A. Atomic force microscopy colloid-probe measurements with explicit measurement of particle-solid separation. Langmuir. 2004; 20:7616–7622.
Dagastine, R.R., Stevens, G.W., Chan, D.Y.C., Grieser, F. Forces between two oil droplets in aqueous solution measured by AFM’. Journal of Colloid and Interface Science. 2004; 273:339–342.
Dagastine, R.R., Manica, R., Carnie, S.L., Chan, D.Y.C., Stevens, G.W., Grieser, F. Dynamic forces between two deformable oil droplets in water. Science. 2006; 313:210–213.
Daniels, D.R., Donald, A.M. An improved model for analyzing the small angle X-ray scattering of starch granules. Biopolymers. 2003; 69:165–175.
Dufrene, Y.F., Hinterdorfer, P. Recent progress in AFM molecular recognition studies. Pflugers Archiv – European Journal of Physiology. 2008; 456:237–245.
Dupres, V., Menozzi, F.D., Locht, C., Clare, B.H., Abbott, N.L., Cuenot, S., Bompard, S., Raze, D., Dufrene, Y.F. Nanoscale mapping and functional analysis of individual adhesins on living bacteria. Nature Methods. 2005; 2:515–520.
Furst, E.M. Applications of laser tweezers in complex fluid rheology. Current Opinion in Colloid & Interface Science. 2005; 10:79–86.
Gallant, D.J., Bouchet, B., Baldwin, P.M. Microscopy ofstarch: Evidence of a new level of granule organization. Carbohydrate Polymers. 1997; 32:177–191.
Garcia, R., PEREZ, R. Dynamic atomic force microscopic methods. Surface Science Reports. 2002; 47:197–301.
Gisler, T., Weitz, D.A. Tracermicrorheology in complex fluids. Current Opinion in Colloid & Interface Science. 1998; 3:586–592.
Glinsky, V.V., Raz, A. Modified citrus pectin anti-metastatic properties: One bullet, multiple targets. Carbohydrate Research. 2009; 344:1788–1791.
Gosal, W.S., Clark, A.H., Ross-murphy, S.B. Fibrillar beta-lactoglobulin gels: Part 1. Fibril formation and structure. Biomacromolecules. 2004; 5:2408–2419.
Gromer, A., Penfold, R., Gunning, A.P., Kirby, A.R., Morris, V.J. Molecular basis for the emulsifying properties of sugar beet pectin studied by atomic force microscopy and force spectroscopy. Soft Matter. 2010; 6:3957–3969.
Gunning, A.P., Kirby, A.R., Ridout, M.J., Brownsey, G.J., Morris, V.J. Investigation of gellan networks and gels by atomic force microscopy. Macromolecules. 1996; 29:6791–6796.
Gunning, A.P., Wilde, P.J., Clark, D.C., Morris, V.J., Parker, M.L., Gunning, P.A. Atomic force microscopy of interfacial protein films. Journal of Colloid and Interface Science. 1996; 183:600–602.
Gunning, A.P., Mackie, A.R., Kirby, A.R., Kroon, P., Williamson, G., Morris, V.J. Motion of a cell wall polysaccharide observed by atomic force microscopy. Macromolecules. 2000; 33:5680–5685.
Gunning, A.P., Giardina, T.P., Faulds, C.B., Juge, N., Ring, S.G., Williamson, G., Morris, V.J. Surfactant mediated solubilisation of amylose and visualisation by atomic force microscopy. Carbohydrate Polymers. 2003; 51:177–182.
Gunning, A.P., Mackie, A.R., Wilde, P.J., Morris, V.J. Atomic force microscopy of emulsion droplets: Probing droplet-droplet interactions. Langmuir. 2004; 20:116–122.
Gunning, P.A., Mackie, A.R., Gunning, A.P., Woodward, N.C., Wilde, P.J., Morris, V.J. The effect of surfactant type on surfactant-protein interactions at the air–water interface. Biomacromolecules. 2004; 5:984–991.
Gunning, A.P., Chambers, S., Pin, C., Man, A.L., Morris, V.J., Nicoletti, C. Mapping specific adhesive interactions on living intestinal epithelial cells with atomic force microscopy. FASEB Journal. 2008; 22:2331–2339.
Gunning, A.P., Bongaerts, R.J.M., Morris, V.J. Recognition of galactan components of pectin by galectin-3. FASEB Journal. 2009; 23:415–424.
Guzey, D. Formation, stability and properties of multilayer emulsions for application in the food industry. Advances in Colloid & Interface Science. 2006; 128:227–248.
Higgens, M.J., Proksch, R., Sader, J.E., Polcik, M., Mcendoom, S., Cleveland, J.P., Jarvis, S.P. Noninvasive determination of optical lever sensitivity in atomic force microscopy. Review of Scientific Instruments. 77, 2006. [article number 013701.].
Hinterdorfer, P., Baumgartner, W., Gruber, H.J., Schilcher, K., Schindler, H. Detection and localisation ofindividual antibody-antigen recognition events by atomic force microscopy. Proceedings of the National Academy of Sciences Usa. 1996; 93:3477–3481.
Hinterdorfer, P., Gruber, H.J., Kienberger, F., Kada, G., Riener, C., Broken, C., Schindler, H. Surface attachment of ligands and receptors for molecular recognition force microscopy. Colloids and Surfaces B: Biointerfaces. 2002; 23:115–123.
Holscher, H., Schirmeisen, A. Dynamic force microscopy and spectroscopy. Advances in Imaging and Electron Physics. 2005; 135:41–101.
Humphris, A.D.L., Miles, M.J., Hobbs, J.K. A mechanical microscope: Highspeed atomic force microscopy. Applied Physics Letters. 86(3), 2005. [article number 034106.].
Ikeda, S. Torsional fracture properties of heat-induced whey protein gels and microstructures of gel precursors visualized by atomic force microscopy. Nippon Shokuhin Kagaku Kogaku Kaishi. 2003; 50:237–242.
Ikeda, S. Heat-induced gelation of whey proteins observed by rheology, atomic force microscopy, and Raman scattering spectroscopy. Food Hydrocolloids. 2003; 17:399–406.
Ikeda, S., Morris, V.J. Fine-stranded and particulate aggregates of heat-denatured whey proteins visualized by atomic force microscopy. Biomacromolecules. 2002; 3:382–389.
Ikeda, S., Funami, T., Zhang, G.Y. Visualizing surface active hydrocolloids by atomic force microscopy. Carbohydrate Polymers. 2005; 62:192–196.
Kirby, A.R., Gunning, A.P., Waldron, K.W., Morris, V.J., Ng, A. Visualisation of plant cell walls by atomic force microscopy. Biophysical Journal. 1996; 70:1138–1143.
Kirby, A.R., Macdougall, A.J., Morris, V.J. Sugar beet pectin-protein complexes. Food Biophysics. 2006; 1:51–56.
Kirby, A.R., Ng, A., Waldron, K.W., Morris, V.J. Afm investigations of cellulose fibres in Bintje potato (Solanum tuberosum L) cell wall fragments. Food Biophysics. 2006; 1:163–167.
Kirby, A.R., Macdougall, A.J., Morris, V.J. Atomic force microscopy of tomato and sugar beet pectin molecules. Carbohydrate Polymers. 2007; 71:640–647.
Kratky, O., Porod, G. Röngenuntersuchung gelöster Fadenmoleküle. Recueil des Travaux Chimiques des Pays-Bas – Journal of the Royal Netherlands Chemical Society. 1949; 68:1106–1122.
Leite, F.L., Herrmann, P.S.P. Application ofatomic force spectroscopy (Afs) to studies of adhesion phenomena: A review. Journal of Adhesion Science and Technology. 2005; 19:365–405.
Liang, Y., Hilal, N., Langston, P., Starov, V. Interaction forces between colloidal particles in liquid: Theory and experiment. Advances in Colloid & Interface Science. 2007; 134–135:151–166.
Mackie, A.R., Gunning, A.P., Ridout, M.J., Morris, V.J. Gelation of gelatine: Observations at the air/water interface and in the bulk. Biopolymers. 1998; 46:245–252.
Mackie, A.R., Gunning, A.P., Wilde, P.J., Morris, V.J. The orogenic displacement of protein from the air/water interface by competitive adsorption. Journal of Colloid and Interface Science. 1999; 210:157–166.
Mackie, A.R., Gunning, A.P., Wilde, P.J., Morris, V.J. The competitive displacement of ß-lactoglobulin from the air-water interface by Sds. Langmuir. 2000; 16:8176–8181.
Mackie, A.R., Gunning, A.P., Ridout, M.J., Wilde, P.J., Morris, V.J. Orogenic displacement in mixed β-lactoglobulin/β-casein films at the air/water interface. Langmuir. 2001; 17:6593–6598.
Maldonado-Valderrama, J., Woodward, N.C., Gunning, A.P., Ridout, M.J., Husband, F.A., Mackie, A.R., Morris, V.J., Wilde, P.J. Interfacial characterisation of betalactoglobulin networks: Displacement by bile salts. Langmuir. 2008; 24:6759–6767.
Maldonado-Valderrama, J., Gunning, A.P., Ridout, M.J., Wilde, P.J., Morris, V.J. The effect of physiological conditions on the surface structure of proteins: Setting the scene for human digestion of emulsions. European Physical Journal E: Soft Matter and Biological Physics. 2009; 30:165–174.
Maldonado-Valderrama, J., Gunning, A.P., Ridout, M.J., Woodward, N.C., Wilde, P.J., Morris, V.J.Williams P.A., Phillips G.O., eds. Characterisating effects on interfacial structures during simulated human digestion of emulsions. Proceedings of the 15th Gums & Stabilisers for the Food Industry Conference, 22nd-26th June 2009. Glyndwr University, Wrexham. 2010:384–394.
Maldonado-Valderrama, J., Gunning, A.P., Wilde, P.J., Morris, V.J. In-vitro gastric digestion of interfacial protein structures: Visualisation by Afm. Soft Matter. 2010; 6:4908–4915.
Mammen, M., Helmerson, K., Kishore, R., Chai, S.K., Phillips, W.D., Whitesides, G.M. Optically controlled collisions of biological objects to evaluate potent polyvalent inhibitors of virus-cell adhesion. Chemistry & Biology. 1996; 3:757–763.
Manor, O., Vakarelski, I.U., Stevens, G.W., Grieser, F., Dagastine, R.R., Chan, D.Y.C. Dynamic forces between bubbles and surfaces and hydrodynamic boundary conditions. Langmuir. 2008; 24:11533–11543.
Marszalek, P.E., Oberhauser, A.F., Pang, Y.P., Fernandes, J.M. Polysaccharide elasticity governed by chair-boat transitions of the glucopyranose ring. Nature. 1998; 396:661–664.
Marszalek, P.E., Li, H., Fernandes, J.M. Fingerprinting polysaccharides with single molecule atomic force microscopy. Nature Biotechnology. 2001; 19:258–262.
Meyer, E. Atomic force microscopy. Progress in Surface Science. 1992; 41:3–49.
Meyer, G., Amer, N.M. Novel approach to atomic force microscopy. Applied Physics Letters. 1988; 53:1045–1047.
Moates, G.K., Noel, T.R., Parker, R., Ring, S.G. The effect ofchain length and solvent interactions on the dissolution of the B-type crystalline polymorph of amylose in water. Carbohydrate Research. 1997; 298:327–333.
Morris, V.J. Gels. In: Belton P.S., ed. The Chemical Physics of Food. Oxford: Blackwell; 2007:151–198. [Chapter 6].
Morris, V.J. Atomic force microscopy (Afm) techniques for characterising food structure. In: McClements D.J., ed. Understanding and Controlling the Microstructure of Complex Foods. New York: Crc Press; 2007:209–231. [Chapter 8].
Morris, V.J., Gunning, A.P. Microscopy, microstructure and displacement of proteins from interfaces: Implications for food quality and digestion. Soft Matter. 2008; 4:943–951.
Morris, V.J., Gunning, A.P., Faulds, C.B., Williamson, G., Svensson, B. Afm images of complexes between amylose and Aspergillus niger glucoamylase mutants, native and mutant starch binding domains: A model for the action of glucoamylase. Starke. 2005; 57:1–7.
Morris, V.J., Gromer, A., Kirby, A.R. Architecture ofintracellular networks in plant matrices. Structural Chemistry. 2009; 20:255–261.
Morris, V.J., Kirby, A.R., Gunning, A.P. Atomic Force Microscopy for Biologists, 2nd ed. London: Imperial College Press; 2010.
Nangia-Makker, P., Conklin, J., Hogan, V., Raz, A. Carbohydrate-binding proteins in cancer and their ligands as therapeutic agents. Trends in Molecular Medicine. 2002; 8:187–192.
Neuman, K.C., Nagy, A. Single-molecule force spectroscopy: Opticaltweezers, magnetic tweezers and atomic force microscopy. Nature Methods. 2008; 5:491–505.
Ng, S.P., Randles, L.G., Clarke, J. Single studies of protein folding usingatomic force microscopy. Methods in Molecular Biology. 2007; 350:139–167.
Ong, Y.L., Razatos, A., Georgiou, G., Sharma, M.M. Adhesion forces between E-coli bacteria and biomaterial surfaces. Langmuir. 1999; 15:2719–2725.
Parker, M.L., Kirby, A.R., Morris, V.J. In situ imaging ofpea starch in seeds. Food Biophysics. 2008; 3:56–76.
Ralston, J., Larson, I., Rutland, M.V.V., Feiller, A.A., Kleijn, M. Atomic force microscopy and direct surface force measurements (Iupac technical report). Pure and Applied Chemistry. 2005; 77:2149–2170.
Ridout, M.J., Gunning, A.P., Wilson, R.H., Parker, M.L., Morris, V.J. Using Afm to image the internal structure of starch granules. Carbohydrate Polymers. 2002; 50:123–132.
Ridout, M.J., Parker, M.L., Hedley, C.L., Bogracheva, T.Y., Morris, V.J. Atomic force microscopy of pea starch granules: Granule architecture of wild-type parent, r, and rb single mutants, and the rrb double mutant. Carbohydrate Research. 2003; 338:2135–2147.
Ridout, M.J., Parker, M.L., Hedley, C.L., Bogracheva, T.Y., Morris, V.J. Atomic force microscopy of pea starch: Origins of image contrast. Biomacromolecules. 2004; 5:1519–1527.
Round, A.N., Kirby, A.R., Morris, V.J. Collection and processing of Afmimages of plant cell walls. Microscopy and Analysis. 1996; 55:33–35.
Round, A.N., Rigby, N.M., Ring, S.G., Morris, V.J. Investigating the nature of branching in pectins by atomic force microscopy and carbohydrate analysis. Carbohydrate Research. 2001; 331:337–342.
Round, A.N., Berry, M., Mcmaster, T.J., Corfield, A.P., Miles, M.J. Glycopolymer charge density determines conformation in human ocular mucin gene products: An atomic force microscope study. Journal of Structural Biology. 2004; 145:246–253.
Round, A.N., Mcmaster, T.J., Miles, M.J., Corfield, A.P., Berry, M. The isolated MUC5AC gene product from human ocular muc in displays intra molecular conformational heterogeneity. Glycobiology. 2007; 17:578–585.
Round, A.N., Rigby, N.M., Macdougall, A.J., Morris, V.J. A new view of pectin structure revealed by acid hydrolysis and atomic force microscopy. Carbohydrate Research. 2010; 345:487–497.
Rousseau, D., The microstructure of chocolateMcClements D.J., ed. Understanding and Controlling the Microstructure of Complex Foods. New York: Crc Press, Chapter; 2007;24:590–648.
Sader, J.E., Larson, I., Mulvaney, P., White, L.R. Method for calibration of atomic force cantilevers. Review of Scientific Instruments. 1995; 66:3789–3798.
Sader, J.E., Chon, J.W.M., Mulvaney, P. Calibration of rectangular atomic force microscope cantilevers. Review of Scientific Instruments. 1999; 70:3967–3969.
Smith, S.B., Cui, Y., Bustamanate, C. Overstretching B-Dna: The elastic response of individual double-stranded and single-stranded Dna molecules. Science. 1996; 271:795–799.
Tischer, C., Altmann, S., Fisinger, S., Horber, J.K.H., Stelzer, E.H.K., Florin, E.L. Three-dimensional thermal noise imaging. Applied Physics Letters. 2001; 79:3878–3880.
Touhami, A., Hoffman, B., Vasella, A., Denis, F.A., Dufrene, Y.F. Probing specific lectin-carbohydrate interactions using atomic force microscopy imaging and force measurements. Langmuir. 2003; 10:1745–1751.
Vakarelski, I.U., Manica, R., Tang, X., O’shea, S.J., Stevens, G.W., Grieser, F., Dagastine, R.R., Chan, D.Y.C. Dynamic interactions between microbubbles in water. Proceedings of the National Academy of Sciences Usa. 2010; 107:11177–11182.
Vesenka, J., Marsh, T., Miller, R., Henderson, E. Atomic force microscopy of G-wire Dna. Journal of Vacuum Science and Technology B. 1996; 14:1413–1417.
Waigh, T.A., Kato, K.L., Donald, A.M., Gidley, M.J., Clarke, C.J., Riekel, C. Side-chain liquid-crystalline model for starch. Starke. 2000; 52:450–460.
Wilde, P.J., Clark, D.C. The competitive displacement ofbeta-lactoglobulin by Tween 20 from oil–water and air-water interfaces. Journal of Colloid and Interface Science. 1993; 155:48–54.
Williams, M.A.K., Marshall, A., Haverkamp, R.G., Graget, K.I. Stretching single polysaccharide molecules using Afm: A potential method for the investigation of the intermolecular urinate distribution of alginate? FoodHydrocolloids. 2008; 22:18–23.
Woodward, N.C., Wilde, P.J., Mackie, A.R., Gunning, A.P., Gunning, P.A., Morris, V.J. The effect of processing on the displacement of whey protein: Applying the orogenic model to a real system. Journal of Agricultural and Food Chemistry. 2004; 52:1287–1292.
Woodward, N.C., Gunning, A.P., Maldonna-Valderrama, J., Wilde, P.J., Morris, V.J. Probing the in situ competitive displacement of protein by nonionic surfactant using atomic force microscopy. Langmuir. 2010; 26:12560–12566.
Woodward, N.C., Gunning, A.P., Wilde, P.J., Chu, B.S., Morris, V.J., Engineering interfacial structures to moderate satietyWilliams P.A., Phillips G.O., eds. Royal Society of Chemistry, special publication 325. Proceedings of the 15th Gums & Stabilisers for the Food Industry Conference, 22nd-26th June 2009. Glyndwr University, Wrexham. 2010:367–376.
Zou, S., Korczagin, I., Hempenius, M.A., Schönherr, H., Vancso, G.J. Single molecule force spectroscopy of smart poly(ferrocenylsilane) macromolecules: Towards highly controlled redox-driven single chain motors. Polymer. 2006; 47:2483–2492.