
Chapter 5
Network Analysis
Introduction
Today an examiner can easily utilize network capable forensic applications to conduct a network analysis. EnCase Enterprise[1], FTK[2] and even X-Ways[3] with the help of F-Response[4], can connect to any network attached device that is capable of having the tools particular agent installed on it.
Probably the most valuable piece of the puzzle you can get is the network traffic captured during the time of the incident. This is the ideal situation because it allows you observe the actual data being passed between the attacker and the victim, most of the time. There are many tools available that can capture and be used to analyze network capture data. There is a slight problem getting this data for a few reasons which we will discuss in this chapter.
To conduct a complete network analysis, the examiner must have a firm understanding of both the physical and logical topology of the network in question. One piece of information that can be of great value is a network diagram. The diagram, if up to date, will provide you with both the physical and logical layout of the network. I say up to date because in today’s fast and ever evolving network environment, the diagram is usually the last thing on the minds of the network administrators. Having access to this information is relatively easy if you are an employee of the company, it becomes a little more difficult if you are a consultant coming in from the outside. This knowledge will help determine the location of potential witness devices and other sources of valuable data. The data obtained from witness devices will help the examiner correlate data found on victim machines and network traffic. Again, as the networks you are examining become more complex and larger, this task becomes more difficult.
The majority of the network data that you will encounter will be logs. Logs, logs, and more logs in either binary or text format will need to be analyzed for clues. The challenge here is that these logs are usually very large and can be collected in different formats and include different content. Most text based logs are in the English language encoded as 7-bit ASCII. Binary logs pose another challenge. Binary logs contain non-text data, while they can contain some text based data, the majority of the data will be encoded in a non-text format. Binary logs are usually encoded in a proprietary format created by the vendor of the product that created the log. To analyze these logs, the examiner needs an application that is capable of understanding and interpreting the format. We will look at one such tool in this chapter.
Methodology
The starting point of the network analysis will be dictated by the event or device that reported the incident in the first place. In a large network, this could come from a number of sources. An alert could come from an Intrusion Detection System, an employee, a Security Information and Event Management System, or any number of monitoring applications that may have been put in place. As an example, take our attack from Chapter 2. Let’s say that our victim, Harry suddenly observes a command prompt appear on his desktop and then disappear. Our victim notifies his manager, who in turn notifies network security. Depending on what type of information the examiner receives about the incident will help determine the steps taken.
Starting from the source of the report and working your way out is usually the best approach. Find a piece of potential evidence and follow the trail to see where it leads. The main points are to be methodical, take good notes as you go and stay focused. It is very easy to lose track of where you are during the examination due to the vast amount of data. Avoid at all costs the temptation to immediately start gathering logs and data from every device you can think of. The only data that you need to be concerned about collecting immediately is the volatile data discussed in previous chapters.
Network Traffic
As stated earlier, in my humble opinion, probably the most informative, evidence laden data that you can get your hands on is network traffic captures. The problem is that getting this data is the exception not the rule. It is simply not feasible for most networks to have the resources needed to be able to capture, store and manage the massive amount of data that would be collected. That is not to say that network traffic is not being monitored, it is just not being saved.
If you do receive a capture file, it may be too big for your GUI tool to handle. Well, it can probably handle it; the processing may just bring the application to a crawl. This makes analyzing somewhat frustrating. Luckily for us, Wireshark in particular comes with a variety of command line tools that can be used to help alleviate that problem. One of the tools that get installed in the Wireshark directory is “tshark”. Tshark is essentially the command line version of Wireshark. Tshark is capable of handling much larger capture files. This allows you to use tshark to do some pre-analysis filtering. There is an HTML help file for tshark that will show all the available options. One of the abilities of tshark is that it can read in a capture file, filter based on your specifications and save that filtered data out into another capture file. This newly created file can then be brought in Wireshark or Netwitness for further analysis.
Take some time to explore the additional command line tools that come with Wireshark.
What do you do if you are handed a case, a capture file, an image of a possibly compromised machine, some volatile data and simply told, “We know something happened, not sure what, so see what you can find”? Believe it or not this can and may just happen. Where do you begin?
Snort
One suggestion I have is to use another open source tool, Snort. Snort is a network intrusion prevention and detection system (IPS/IDS) that was developed by Sourcefire. Snort[5] can be downloaded from <http://www.snort.org>. In addition to downloading the Snort installer, you will also have to download the Snort rules. To download the rules, you will have to register for an account. If you are going to be running snort on a Windows box, as I am, you will need to do some editing of the snort.conf file. It is pretty straight forward and self-explanatory. One of the settings I always like to add is the CSV out put option. I do this so that once I run a capture file through Snort, I end up with a .csv log that I can then open in Excel and easily sort.
To add the CSV output, add the following line in the output plugin section of the snort.conf file (see Figure 5.1).
![]()
Figure 5.1 CSV Output with Default Setting
In the above example, I have configured Snort to create a log in CSV format, place the log in the provided directory and use the default columns. This works just fine, however, the default output will provide you with 27 columns of data. Twenty seven columns of data is way too much information for what I am using this for. Luckily, we can configure this output to only provide the columns we want. This can easily be accomplished by simply specifying the columns we want as seen below (see Figure 5.2).

Figure 5.2 CSV Output with Custom Setting
Here you can see that I have replaced the word default and added just the columns that I wanted separated by colons. I have also added another output that will create an alert.ids file which we will take a look at using a different program in this chapter. Refer to the Snort manual located in the doc directory for help.
Once we have Snort setup the way we want it, it is a straight forward procedure to run Snort against a capture file. The syntax for running Snort against a capture file is as follows:
The –c switch points to the snort.conf file you want to use. The –l switch points to the log directory you want to use. The –y switch tells Snort to add the year to all the entries. The –r switch tells Snort to read in the provided capture file. Snort will run and do its thing. Don’t get concerned if it appears that Snort has stopped working, it takes time to process all those packets. One thing I like about Snort is that it will tell you if there is a misconfiguration. Below is an example of a CSV output file. I have already filtered the output to show only a few of the entries (see Figure 5.3).

Figure 5.3 CSV Output Sample
As you can see, by using Snort in this manner we can quickly find potential victim IP addresses as well as attacker IP addresses. The results will also help us determine possible methods of attacks as well as what type of artifacts we might want to be looking for. This is by no means a “Find All” method. It is just merely a technique to start you down an investigative path when you have nothing to start with.
Packet Analysis Tools
We are going to look at two tools that can be used to analyzed network traffic; Wireshark and Netwitness Investigator.
Wireshark
Wireshark®[6] is available under the GNU General Public License version 2. See the General Questions section of the FAQ for more details. Wireshark can be obtained from http://www.wireshark.org.
There are a few things that I like to change regarding the interface before I start. These are just my personal preference so by all means don’t take them as gospel.
One of the first things I will do is change the time format. By default, Wireshark will display the time in seconds since the beginning of the capture. I change the time setting to display the actual date and time of the capture (see Figure 5.4).
Note
The time displayed in the capture is derived from the date and time as it was on the machine that did the capturing. Keep this in mind if you are in a different time zone.

Figure 5.4 Time Display Format Settings
The next thing I do is stop Wireshark from trying to perform name resolution. This is accomplished in the Preferences window found under the Edit menu. Simply uncheck the three boxes as seen below. My reasoning for this is that I do not want Wireshark to determine the protocol associated with a particular port. This can be misleading as you will see later in the chapter (see Figure 5.5).

Figure 5.5 Removing Name Resolution Options
The third change is to add additional columns for the Source and Destination ports. This is accomplished in the Preferences window found under the Edit menu. Select; Columns in the left menu (see Figure 5.6).

Figure 5.6 Adding Port Columns
Click on the Add button and a new column will appear in the list. In the Field type drop down, find and select; Src port (unresolved). Remember we want the actual port number and we turned off resolution. As you can see above, the displayed title for the Dest port (unresolved) is New Column. To change that, left click on “New Column” and you can label the title to whatever you want. As you can see below, I change both the Source and Destination ports to SrcPort and Dstport accordingly. I was also able to move the columns easily by holding down the left mouse button on one of them and dragging it to the position I wanted them in (see Figure 5.7).

Figure 5.7 Arranging the Columns
The fourth items I like to change are the default colors. As you will notice when you open your first capture file are the multitude of colors that will be displayed in the top window. These colors are determined by the default coloring rules. To access the coloring rules, simply select the color rules icon located in the Main toolbar (see Figure 5.8.

Figure 5.8 Coloring Rules Icon
The following image shows what the default color rules window will look like (see Figure 5.9).

Figure 5.9 Default Coloring Rules
I prefer to have a lot less colors to deal with. I select all the rules listed and delete them. I then create my own. I only create two which are really easy to create. The first rule will color the initial TCP connection request, the SYN request. The second rule will color the second part of the three way TCP handshake, the SYN-ACK from the second party. To accomplish this I create the following rules as seen below (see Figure 5.10).

Figure 5.10 Custom Coloring Rules
To create the rules, select New. The color filter will be displayed. Enter a name for your rule. In the string window, type the first string as shown above. Select a background color. Depending on the chosen background color you may need to change the foreground color so the data in the actual packet can be seen in the Wireshark display. When you are finished, select OK. Select New again to create another rule. You can also use the Expression builder to help you create your own rules. You can also visit the Wireshark Wiki at <http://wiki.wireshark.org/> ColoringRules for examples. I encourage you to experiment on your own (see Figure 5.11).

Figure 5.11 Creating a Custom Coloring Rule
That is all I do to my default install of Wireshark. Let’s analyze some traffic. Remember the captures we created in Chapter 2? Let’s take a look at the first one we created.
Analyzing Data with Wireshark
How you approach analyzing the capture file is entirely up to you. What I like to do is let the information I already have, decide my course of action. As an example, we already know the IP address of our victim from Chapter 2, so we can filter on all the traffic coming to and from that IP address. We may have even learned the attackers IP address, so we could filter on that. A word of caution here, the attacker can and may have, set up several connections from different IP addresses so keep that in mind as you filter. What is nice about both Wireshark and Netwitness is that you can always “step backwards” with your filters.
To create a display filter in Wireshark is somewhat simple. We need to enter our filter in the filter window located at the top of the window. You can use the Expression button to open the Expression builder window. From here you can build your filter and apply it (see Figure 5.12).

Figure 5.12 Expression Builder Window
Once you have used Wireshark and built filters enough times, you tend to remember the ones you use most often and can simply type them in the filter window. One feature which is a great help is the fact that the filter window will change color, letting you know if the filter you are creating is correct or not. As you type in your filter, the window will turn almost a reddish pink color indicating that the statement is incorrect. Once you have fixed or finished your statement and it is correct, the window will be green. In the below example, I created a simple filter that will only show me the packets that pertain to the listed IP address. In this instance, Wireshark will display the packets that the listed IP address was either the sender or receiver. Once you are satisfied with your filter, click Apply (see Figure 5.13).

Figure 5.13 IP adress Filter in Display Filter Window
You can add additional filters, combined filters or clear existing filters and start from scratch. You can also create compound filters and even use a negative filter, that is, remove the item from displaying. As an example, you might want to remove all DNS queries from view. To accomplish this we simply use the exclamation mark before the item. So to remove DNS traffic, our filter would be like following picture (see Figure 5.14).

Figure 5.14 A Negative Filter to Remove All DNS Traffic
One more filter that is worth mentioning here is Wiresharks ability to perform keyword searching from within the filter window. To accomplish this you can use the “frame contains” filter (see Figure 5.15).

Figure 5.15 Frame Contains as a Keyword Search Function
OK, yes I cheated. I knew that meterpreter was used in this capture. But as you can see, using the “frame contains” filter with a keyword of choice, you can find any packets that contain that word in the data portion of the frame.
I encourage you to explore all the available filters and syntax as there are a lot of them.
Once we have our capture file filtered so that we are only looking at what we want, we can now look at the remaining streams. As you can see in the picture below, I have filtered my capture file by using a single IP address and the first two packets listed are the SYN and SYN-ACK of a connection. These two packets are colored according to my created coloring rules. To view the entire TCP stream, I right click on either one of the packets and select, Follow TCP stream, from the drop-down menu. A new window will open containing the contents of the entire TCP stream (see Figure 5.16).

Figure 5.16 Follow TCP Stream Window
As you can see, you have some options as far as saving, printing, finding, and filtering the stream. These options come in handy when you have found evidence in the stream. In Fact, you can even carve out an entire executable, picture, document or whatever directly from here. You also have the ability to view the entire conversation (default) or view only one side at a time. This is accomplished by clicking on the drop-down arrow on the far right of the window displaying “Entire conversation (13,099 bytes) in our example. I am going to scroll through this stream and see what I can find that might be of interest.
That particular stream had nothing of interest so I clicked on the “Filter Out This Stream” button and removed it (I should say “hid” it) from view. I moved on to the next stream I came across and followed the same procedure. While reviewing the stream, I came across some interesting artifacts. The first item I found can be seen in the following picture (see Figure 5.17).

Figure 5.17 Meterpreter Dll being Loaded
This is a dead giveaway that meterpreter has come to play on the victim machine. That should set off many red flags.
Note
If you are running Wireshark against the capture file we collected in Chapter 2, you may not find this artifact. In fact, depending on what version of meterpreter you were using, you will not be able to see any traffic in plain text. Meterpreter communications are encrypted by default. OUCH! But, don’t let that discourage you. The attacker may have dropped into a command shell and in which case, everything is in plain text. After creating the captures using the latest version of BackTrack and as such Meterpreter, I went back and ran the attack again using an older version that would not be encrypted.
Getting back to my stream, I continue to examine it. After scrolling through what seemed like forever, I came across the following artifacts (see Figure 5.18).

Figure 5.18 Password Hashes being Sent over the Wire
You can see that our attacker asked for and received the SAM database. You will notice that our “hacker” and “Administrator_” accounts are already there. Remember, I re-hacked the box after we had in Chapter 2 to get an unencrypted capture. The remainder of this stream shows the attacker snooping around the directory structure and seeing what the first attacker had done. From the below picture, you can see that there was more than one attacker playing on this machine (see Figure 5.19).

Figure 5.19 Evidence of More than One Hacker?
It looks like we had a “second banana” as well as a third.
This was just a small example and as you can see, reviewing and analyzing packets can be a long tedious task. This is where you must be diligent and patient. You can help the cause by using other filters including the “frame contains” filter. Not only can packet analysis provide you with valuable evidence as to how the attack occurred, from where the attack occurred and against whom it occurred, it can tell you for what and where to look on the victim.
Netwitness Investigator
Netwitness[7] is freeware however; it does have an annual renewable license. After a year from activation date you will be prompted to login to the registration portal and validate your registration information. You simply use your existing account (you create one when you first install the product) and follow the prompts.
The Netwitness interface has a familiar look that we are all accustomed to. The main menu bar provides access to the majority of the functions. You also have the option to change the theme of the interface itself. Take some time and review all the options available in the main menu bar.
Analyzing Data with Netwitness
Netwitness identifies the contents of a capture session as a collection. A collection can be created as a result of a live network capture or by importing packets from a capture from an earlier time or another application.
The creation of a collection is a very simple process. Click on the Collection menu. From the drop-down menu, select New Local Collection. In the New Local Collection window, provide a name for the new collection and set any additional options. Click OK. The new collection will be displayed in the Collection pane.
Importing packets from a previous capture into a collection is a simple process as well. In the Collection pane, select the collection you want to import packets into. Right click the selected collection. Select Import Packets from the drop-down list. Navigate to the desired capture file and select Open. Try this with one of our previously saved capture files from Chapter 2 (see Figure 5.20).

Figure 5.20 Importing Packets into Netwitness
Collection Summary
The collection Summary is accessed from the Collection pane menu. It provides you with a graphical breakdown of Sessions, Bytes, and Packets over Time. You have the ability to zoom in and out of each graph. You also have the ability to navigate a particular time slice from the Summary View (see Figure 5.21).

Figure 5.21 Netwitness’ Summary View
Filtering
Filtering is the process of eliminating unnecessary sessions from a collection. Netwitness provides you with several ways to accomplish this task. Rules can be created that will filter traffic during a live capture or file import.
Custom Drills can also be created within a collection while in Navigation view from the Report icons. There is also a Custom Drill icon in the Navigation toolbar menu.
Rules
The Rule Configuration window is accessed through the Edit menu. The Rules Configuration window allows you to create Net Rules or App Rules. Rules created here will be available for any collection. The rules can be created for either a Network Capture or File Import.
Let’s create a rule.
From the Netwitness menu bar, select Edit and Rules. In the Rules Configuration window, select Net Rules. Click on the New Rule icon and select For File Import.
In the Add Rule window, provide a name for the new rule. In the Definition window, enter the following:
ip.addr=192.168.8.128 (this is the address of our victim). Select the Packet Data action and Session Options, click OK. The Rule will now be listed in the Rules Configuration window. You can click on the Disable Rule icon to disable the rule until needed. Click OK to close the Rules Configurations window. Just like Wireshark filters, Netwitness also provide the same visual clue as you type in the rule definition, red is bad, green is good (see Figure 5.22).

Figure 5.22 Rule Creation in Netwitness
Drilling
Drilling is the process of focusing the view on a specific subset of the chosen metadata report. You are narrowing down the amount of data displayed and focusing on suspect sessions. There are several ways to drill in Netwitness.
Custom Drill
The Custom Drill icon is located in the Navigation toolbar. Clicking on the icon will open the Custom Drill window. You can define the filter desired and it will be applied only to the current view. The result of the filter is a new Navigation pane displaying only those sessions matching the filter. Filter expressions can be combined.
Let’s create a Custom Drill.
From the Navigation Pane tool bar, select the Custom Drill icon. In the Custom Drill window, define the filter. In the Definition window type the following:
• ip.src=192.168.8.128 (our victim). Click OK (see Figure 5.23).

Figure 5.23 Custom Drill Feature in Netwitness
Intellisense
Intellisense helps you create a drill definition by providing possible choices and displaying the Definition window background in green or red, depending on if the Definition is valid.
Report Icon
You can also access a Custom Drill menu from any Report icon in the Navigation view.
Options
The options available under the drop-down arrow depend on the Report type. Some of the choices include; =, =, exists, contains or begins. Once you supply the desired parameter, you can chose to Drill, Copy to Clipboard, Open Report, Close Report, Close other Reports, More Results, and All Results.
Copying to Clipboard allows you to paste the results into a new file. Choosing the Drill option will modify the Navigation view to only display the sessions associated with that chosen parameter.
Report Value
You can also drill down into a collection by clicking on a Report Value within a Report. Next to each Report Value there will be a number enclosed in parenthesis. This number represents the number of sessions associated with that particular Report Value. As an example, the following entry indicates that there are 292 sessions associated with the HTTP service located under the Service Report (see Figure 5.24).

Figure 5.24 Service Type Statistics
When using this method to drill, you have the ability to generate a new tab containing the associated Report Value data or change the existing tab. To generate a new tab, press the CTRL key while selecting a Report Value.
Session List
Clicking on a Session List number next to a Report Value will open the Session View Pane and display all the sessions associated with that Report Value.
Breadcrumbs
As you drill down into a collection, Netwitness displays the path you have taken in the path window located beneath the main menu bar. Netwitness refers to this window as breadcrumbs. A user can simply click on any element in the path to jump back up to that level. This also applies when you create new tabs when drilling.
Searching
Netwitness allows you to perform searches for keywords and regular expressions. You can create a new keyword or expression search or you can choose one of the precompiled expressions. Netwitness provides a simple search in addition to an advanced search.
Accessing the Search Function
The search function window becomes active once you have opened the Navigation pane of a collection. Using this search window conducts a simple search without being able to edit the preferences (see Figure 5.25).

Figure 5.25 Simple Keyword Search
You can also access the search function by right clicking anywhere in the Navigation Pane and the Session View Pane. The Content View Pane provides a Find feature.


Search Preferences
Search preferences dictate where and how Netwitness will search for the designated keyword or regular expression. The default setting is to just search content. You must check the regular expression box, if necessary. Otherwise, the search engine treats the search string as a keyword.
Simple Search
A simple search is conducted by entering in the keyword or expression, selecting your desired options and clicking the Search button. Netwitness will conduct the search and the results will be displayed in a Session View Pane. The matching keyword will be displayed as bold text.
Netwitness will not save a simple search term or expression for future use. You must use the advanced search if you want to save the term or expression. Netwitness keeps track of the last several searches run. This allows you limited access to previous terms. The search term history will only be available for that particular collection.
Advanced Search
The advanced search window is accessed by clicking on the small icon in the top left corner of the search window (see Figure 5.28).
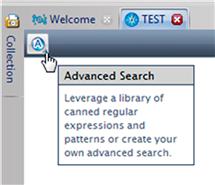
Figure 5.28 Simple/Advanced Search Toggle button
The advanced search window allows you to create and save for later use custom search expressions and keywords. You can also access the precompiled search terms for use (see Figure 5.29).

Figure 5.29 Precompiled Search Terms
Advanced Search
An advanced search is conducted by selecting a precompiled expression or creating a new one, selecting your desired options, and clicking the Search & Export button or Search button.
Netwitness will conduct the search and the results will be displayed in a Session View Pane. The matching keyword will be displayed as bold text.
The advanced search window also provides an ASCII to Unicode convertor.
Exporting Sessions
Exporting can be accomplished either from the Session View Pane or the Content View Pane.
Exporting from the Session View Pane exports all the sessions associated with a particular drill. Exporting from the Session View Pane provides allows you to export to a new pcap file or new collection.
Exporting from the Content View Pane exports only the packets associated with the currently selected session. In the Content View Pane, you can either export the currently loaded session to a new pcap file or open the session as a pcap file in your default pcap application.
From the Session View Pane, select either the Export to a File icon or Export to Collection icon from the menu bar. Provide a name for the file or collection and select OK (see Figure 5.30).

Figure 5.30 Exporting the Current Session to a New Collection
You can also Export Sessions by right clicking anywhere in the Session View Pane. Select either Export Sessions to a File or Export Sessions to New Collection, provide a name for the file or collection and select OK.
Try all these steps with one of your previously captured files from Chapter 2 and see what you can, or can’t find. You can also Google for “sample packet captures” and use those to become more familiar with these two tools.
Log Analysis
Logs come in many flavors and as such it can be a nightmare trying to analyze them. Depending on the network setup, these logs can reside in many places. You may get lucky and they all reside on a Syslog server, or at least a majority of them. Our goal with log analysis is to systematically search through what will seem like volumes of data for entries that may contain information regarding the incident you are investigating. Here again, just like packet filtering, the ability to create filters will help you tremendously.
You can quiet easily use some form of command line tool such as gawk, ask, grip, and grip. We are not going to get into these tools here. I suggest you do a little research on their use for log analysis. They do work great.
We are going to look at one tool in particular. This tool is called Sawmill[8]. Sawmill can be obtained from http://www.sawmill.net. You can download a 30-day trial version which lets you use all three versions. Sawmill has the ability to interpret and supports 900 log formats. I think you should be covered. The folks at Sawmill will even create a log format descriptor for you if need a custom one. Let’s take a look at Sawmill in action. This is a great tool for a minimal cost.
Once installed, Sawmill opens in a browser and you must create an account.
We are going to be analyzing a Snort.ids log file. The file is not very big but you will get the idea of Sawmills capabilities. Once we log in, we are presented with the following screen. (see Figure 5.31).

Figure 5.31 Start Screen Used to Create a Profile
As you can see there are menus across the top of the window. Take some time and review what options are available to you. To begin analyzing, we need to first create a new profile. The number of simultaneous profiles you can have is dependent upon your license. Click the big yellow button and the New Profile window will open (see Figure 5.32).

Figure 5.32 New Profile Wizard
We will need to select the log source location. In this instance, I am using the Professional edition. My choices for the log source are shown below. We can then browse to the location of the log file we want to analyze. As you can see, I selected our alert.ids file. We then select Next (see Figure 5.33).

Figure 5.33 Identifying the Location of the Log File to be Analyzed
The next window will display Sawmill determining the log format and presenting you with the formats it has found. You will be given the option to see ALL available formats. As you can see in the below picture, Sawmill has detected that the alert.ids file is a Snort file however, it only gives us the formats that require a Syslog. Know that this is just a standalone log so we select the “Show all log formats..” and click Next (see Figure 5.34).

Figure 5.34 Detected log File Types. Note: Show all Log Formats
The list is very long. Thankfully, Sawmill provides us with a search window. I entered in the word “Snort” and you can see all the formats matching (see Figure 5.35).

Figure 5.35 Selecting the Correct Log Format
We know that we used the “y” switch when we ran Snort against our capture file. So, we select the standalone, mm/dd/yy dates format and select, Next.
The next window will allow you to select the type of database to save the data to. Your choices are the same for both Professional and Enterprise. We will just use the default of Internal (see Figure 5.36).

Figure 5.36 Selecting the Database Type
We then provide a name for our profile and select, Finish (see Figure 5.37).

Figure 5.37 Naming the New Profile
We then choose what we want to do with our newly created profile. In this case we want to Process Data & View Reports (see Figure 5.38).

Figure 5.38 Processing the Data and Viewing Reports
The next window to open will have a menu along the top as well as one along the left side (see Figure 5.39).

Figure 5.39 Analysis Window
Selecting one of the menus on the left will display the statistics for that particular selection. For example, I selected the Destination IPs and as you can see in the below picture, Sawmill will display the statistics associated with the destination IPs in the log (see Figure 5.40).

Figure 5.40 Viewing Statistics for Various Views
We could select one of the destinations IPs by clicking in the magnifying glass icon to the left of the desired IP. We can then select another left menu item and the result would only be for that selected IP. In other words, it filters everything else out.
In this log we only had 19 entries so there really wasn’t any need to filter. Select the Log Detail option from the left menu. This option will display the full log detail. It is hard to see in the below picture but the table contained all 27 columns just like in our CSV output. Sawmill allows us to customize the log detail output so that we can eliminate any extra columns. To do this we select the Customize icon in the upper right corner (see Figure 5.41).

Figure 5.41 Log Detail View of Previous Destination IP Filter
The Customize Report Element window will appear. We can select/deselect any of the available columns. In our case, we want to deselect everything after the Event column. The table options tab will change depending on which option you choose from the left menu (see Figure 5.42).

Figure 5.42 Customizing Report Elements
If we look at the log detail report now, we can see it is a little easier to read and contains the data that we need (see Figure 5.43).

Figure 5.43 Customized Log Detail Report
We select the Export Table icon and choose the number of rows and the report is exported out (see Figure 5.44).

Figure 5.44 Export Table Options
The report is exported out in a CSV format and opened in Excel. As you can see in the below picture, meterpreter was detected (see Figure 5.45).

Figure 5.45 Exported Log Detail Report
Sawmill has a lot more configuration abilities that you should try out. We just barely scratched the surface.
Witness Devices
Witness devices are any network device that was in the path of the intrusion. Witness devices can include; routers, switches, proxy servers, IDS’s, other servers and even other workstations. The data you get off of them is dependent upon the device itself and the degree of logging that was setup. The artifacts that they can provide can come in a variety of forms. These artifacts can provide valuable corroborating evidence in an investigation. The issue you will run into here is that some of these devices store their data in a proprietary format. Here is where the abilities of an application like Sawmill can prove to be extremely valuable.
Another important consideration is the witness devices configuration settings. This data can prove interesting especially when dealing with routers. The routers running configuration can be different than the startup configuration. Analyzing both these may provide clues suggesting that the router itself was compromised. You should verify any differences found with the routers administrator to confirm that these changes were not authorized. Changes to access control lists and other settings are sometimes made by the administrator and not saved to the startup configuration.
In larger Enterprise networks, there can many systems in place to monitor and record suspicious traffic. Each system might be configured to monitor and report on a single or certain type of activity. These systems may or may not copy/capture the data that triggers an event. That is all dependent upon the application being used and the settings that were selected. The point I am trying to drive home here is that as an investigator, you must ask questions. A vital piece of information could be sitting in a database or log somewhere that had you asked about all the systems in use, you would have. That makes your job a lot easier.
Note
Keep in mind that not all devices will have their clock synchronized. You must make note of any time discrepancies so that you can accurately report on events and correlate appropriately.
Viewing, Acquiring, Triaging Devices over the Network
Today’s forensic tools have come a long way from where they started. The big three, as I like to refer to them as, all offer some form of Network forensics. Guidance Software, Inc. has EnCase Enterprise, Access Data latest addition of FTK and even X-Ways Software Technology AG’s, X-Ways Forensics with the help of F-Response is suited for providing the ability to reach out over the wire to gather evidence, acquire images and examine memory live. Any network device that is capable of having any of these tools mechanism for making the connection installed can be viewed. We will be discussing these tools in more depth in the next Chapter, Host Analysis.
There is one application that I would like to discuss in this chapter. Guidance Software, Inc. has a great tool that has taken network intrusion investigations to the next level. The application is EnCase CyberSecurity.
EnCase CyberSecurity[1]
CyberSecurity’s goal is to proactively protect your network in a number of ways. CyberSecurity’s capabilities are far advanced of any other product currently on the market today. The goal of CyberSecurity is to simplify and automate as much as possible network protection against ever evolving advanced threats.
This will be just a brief overview of how CyberSecurity works.
To use CyberSecurity you must have EnCase Enterprise and its required Safe. You will also need to install EnCase Command Center (ECC), which is the main interface for CyberSecurity. CyberSecurity also uses a database to store all case and settings data.
The main components of CyberSecurity are to set up sources, custodians and targets. These are the locations, users, and machines on your network. An example of a source would be Home Shares and Exchange servers.
The main functions of CyberSecurity are conducted in jobs. Jobs are created and configured to run specific tasks as defined in the job. Jobs are essentially a group of Conditions and Criteria that define what the job is looking to accomplish. Jobs can be schedule to run immediately or at a later specified time. They can also be scheduled to run on recurring bases, much like you schedule backup jobs to run.
Some of the jobs that you can configure are; System Profiles, Snapshots, Remediation, Entropy, Internet Artifacts, Personal Identifying Information (PII).
Probably one of the most powerful jobs is the Remediation job. Once malware has been identified by using a System Profile and Analysis job and an Entropy job, the data can then be used to create a Remediation job. This Remediation job can be pointed to any number of targets and if the malware is found, it will be wiped. You can also create a matching files hash set to be used for Remediation.
This function alone will save network personnel countless hours of time. Anyone who has had to try and track down every machine on a network that is infected and remove the malware can appreciate this.
Another very important aspect of CyberSecurity is the ability to integrate with ArchSite ESM and other alerting applications to provide you with immediate preconfigured job initiation. This helps your response team by providing them with needed data quickly.
Again, this is just a brief overview and doesn’t even come close to explaining the complete functionality of CyberSecurity. I suggest you visit http://www.guidancesoftware.com for more information.
References
1. EnCase Forensics, EnCase Enterprise, EnCase Command Center, CyberSecurity. Guidance Software, Inc.
2. FTK. Access Data Group, LLC.
3. X-Ways Forensics. X-Ways Software Technologies AG.
4. F-Response. Agile Risk Management, LLC.
5. Snort. Sourcefire, Inc.
6. Wireshark, T-shark. Wireshark Foundation.
7. Netwitness Investigator. RSA Netwitness, EMC Corporation.
8. Sawmill. Flowerfire, Inc.