Chapter 7. Automation Is as Good as the Data Models, Their Related Metadata, and the Tools: For the Network Architect and Operator
This chapter covers
How to make sense of a YANG module’s structure
Which YANG module to use to perform configuration changes and gather network data
What metadata is available for a YANG module and how it helps with network management and automation decisions
What tools to use to test YANG-modeled protocols such as NETCONF and RESTCONF
How to learn from others when creating your own YANG modules
How to test your own YANG modules
Introduction
Thus far you’ve taken a hard look at the thinking leading up to the creation of data model–driven management, as well as the structure and syntax of YANG modules. This chapter shifts focus to how to use these paradigms and modules practically in support of network management and automation. In order to do that, you need to look at the tools and module metadata to help you understand how to turn the modeled data into useful actions. There is a growing number of both commercial and open source tools for model-based management and automation. Some commercial tools are mentioned, but the primary focus of this chapter is on the open source offerings.
This chapter begins by taking a practical look at the YANG module structure, the rich metadata around those modules, and the tools needed to understand modules and use them to automate configuration changes to and gather data from the network.
By the end of this chapter, you will have a good understanding of how to identify pertinent YANG modules in order to perform management and automation tasks within their network. You’ll know what metadata and tools to use both as a module consumer and as a module designer to make their tasks easier and less error-prone. Finally, as either a network administrator or operator, you will be familiar the commonly available tools that can help get you started down the path of model-driven network automation.
Getting to Know the Structure of a YANG Module
The first thing you must do is find the modules you want to use. If you have access to the device(s) you will be automating (and they are running the right version of code, of course), the modules they support may be fetched directly from the devices. This approach is explored later in this chapter. Here, you will look at finding modules independent from devices. While different vendors and standards-definition organizations (SDOs) post modules in various locations, many are centralizing around GitHub and linking to the https://github.com/YangModels/yang repository specifically. Generally speaking, there are two main directories in this repository where modules are found: vendor and standard. The vendor directory contains either links to other GitHub repositories or directories that contain actual modules themselves. The standard directory contains the same, but for various SDOs.
Clone this repository and then start to walk through the various available modules. Since this repository contains links to other repositories, be sure to clone it recursively, pulling in all git submodules, like so:
$ git clone --recurse-submodules https://github.com/YangModels/yang.git
Next, choose a common, standards-based module and take a look at it. Say that you want to automate the collection of routes from a device. Under the standard/ietf/RFC subdirectory, you find [email protected]. This module, as its description states, defines essential components for managing a routing subsystem. Example 7-1 shows an excerpt of text from this module.
Example 7-1 Excerpt of [email protected]
/* Type Definitions */

typedef route-preference {
  type uint32;
  description
    "This type is used for route preferences.";
}

/* Groupings */

grouping address-family {
  description
    "This grouping provides a leaf identifying an address
     family.";
  leaf address-family {
    type identityref {
      base address-family;
    }
    mandatory true;
    description
      "Address family.";
  }
}

grouping router-id {
  description
    "This grouping provides a router ID.";
  leaf router-id {
    type yang:dotted-quad;
    description
      "A 32-bit number in the form of a dotted quad that is used by
       some routing protocols identifying a router.";
    reference
      "RFC 2328: OSPF Version 2";
  }
}
So where do you begin? As you saw in Chapter 3, “YANG Explained,” YANG modules can get complex quickly. When you just read through a YANG module, it is difficult to get a good overview of its structure. As you see in Example 7-1, there are identities, typedefs, and groupings. While these are useful for module authors to create extensible and reusable constructs, they make it more difficult to understand the exact path to a data element you may want to extract from or configure on a device.
Fortunately, there are tools to help with this. One such tool—and this will likely be a go-to utility in your tool belt for many things—is pyang. Pyang is an open source, Python-based application and set of libraries that make working with YANG modules much easier by allowing you to transform modules into different formats. Additionally, pyang provides ways to validate module syntax and check for backward incompatibilities between two modules.
Pyang is available in GitHub from https://github.com/mbj4668/pyang, and it is also in the PyPI package index, which means it can be installed with the Python pip command:
$ pip install pyang
Pyang has the -f argument, which prints a module in a variety of output formats. In order to better understand the structure of the ietf-routing module, use the “tree” format:
$ pyang –f tree [email protected]
This command produces the tree output shown in Example 7-2.
Example 7-2 Tree Structure of the ietf-routing Module
module: ietf-routing
    +--rw routing
    |  +--rw router-id?                 yang:dotted-quad
    |  +--ro interfaces
    |  |  +--ro interface*   if:interface-ref
    |  +--rw control-plane-protocols
    |  |  +--rw control-plane-protocol* [type name]
    |  |     +--rw type             identityref
    |  |     +--rw name             string
    |  |     +--rw description?     string
    |  |     +--rw static-routes
    |  +--rw ribs
    |     +--rw rib* [name]
    |        +--rw name              string
    |        +--rw address-family    identityref
    |        +--ro default-rib?      boolean {multiple-ribs}?
    |        +--ro routes
    |        |  +--ro route*
    |        |     +--ro route-preference?   route-preference
    |        |     +--ro next-hop
    |        |     |  +--ro (next-hop-options)
    |        |     |     +--:(simple-next-hop)
    |        |     |     |  +--ro outgoing-interface?   if:interface-ref
    |        |     |     +--:(special-next-hop)
    |        |     |     |  +--ro special-next-hop?     enumeration
    |        |     |     +--:(next-hop-list)
    |        |     |        +--ro next-hop-list
    |        |     |           +--ro next-hop*
    |        |     |              +--ro outgoing-interface?   if:interface-ref
    |        |     +--ro source-protocol     identityref
    |        |     +--ro active?             empty
    |        |     +--ro last-updated?       yang:date-and-time
    |        +---x active-route
    |        |  +--ro output
    |        |     +--ro route
    |        |        +--ro next-hop
    |        |        |  +--ro (next-hop-options)
    |        |        |     +--:(simple-next-hop)
    |        |        |     |  +--ro outgoing-interface?   if:interface-ref
    |        |        |     +--:(special-next-hop)
    |        |        |     |  +--ro special-next-hop?     enumeration
    |        |        |     +--:(next-hop-list)
    |        |        |        +--ro next-hop-list
    |        |        |           +--ro next-hop*
    |        |        |              +--ro outgoing-interface?   if:interface-ref
    |        |        +--ro source-protocol    identityref
    |        |        +--ro active?            empty
    |        |        +--ro last-updated?      yang:date-and-time
    |        +--rw description?      string
    o--ro routing-state
       +--ro router-id?                 yang:dotted-quad
       o--ro interfaces
       |  o--ro interface*   if:interface-state-ref
       o--ro control-plane-protocols
       |  o--ro control-plane-protocol* [type name]
       |     o--ro type    identityref
       |     o--ro name    string
       o--ro ribs
          o--ro rib* [name]
             o--ro name              string
             +--ro address-family    identityref
             o--ro default-rib?      boolean {multiple-ribs}?
             o--ro routes
             |  o--ro route*
             |     o--ro route-preference?   route-preference
             |     o--ro next-hop
...
This output makes understanding the module’s structure much easier. Looking at a module this way for the first time gives you a good, “in a nutshell” view of the module’s content. It strips away the identities and typedefs and presents the groupings exactly where they get referenced within the module’s containers. Therefore, it’s clearer as to what the path will be to a given element.
However, there are a number of new symbols here that require some explanation so you can fully understand the tree. These symbols and the tree structure itself are explained in detail in RFC 8340. Let’s look at a breakdown of the various relevant symbols used in the tree view in Example 7-2.
The leading “+” indicates a current node in the tree. The “o” instead of a “+” indicates that the node is obsolete and should not be used. The “rw,” “ro,” and “x” indicates the type of access you have for a given node. The “rw” indicates that this is configuration data, and thus it is writable (as well as readable). The “ro” indicates state or operational data, and that it can only be read. The “x” is short for “executable,” and in the context of YANG, this points to either a remote procedure call (RPC) or an action (in the case of active-route, this is an action).
A “?” at the end of a node name indicates that the node is optional. An “*” next to a node name indicates that the node is either a list or a leaf-list. Whereas a leaf-list does not have any child nodes, a list has child nodes and typically has key elements. A list’s key elements, which must be present if the list contains keys, is shown in “[ ]” at the end of the list’s node name (for example, the rib list has a key of name of rib* [name] ).
The node name within “( )” signifies a choice, with the “:(...)” notation indicating a specific case for the choice. For example, in the tree just mentioned, next-hop-options is a choice and simple-next-hop is one of its cases.
Let’s get back to the case of wanting to enumerate the routes on a device. Using the preceding tree structure, you know that the path to do so, for all Routing Information Bases (RIBs), is routing → ribs → rib → routes.
Pyang and its tree output are discussed again later in this chapter when you start to construct queries and configuration requests.
Finding the Right Modules Using the YANG Catalog
What if you did not know that ietf-routing was the right module for what you wanted to do? There are many modules in the “YangModules” GitHub repository, and many more in the industry in general. Even if you know the specific platform for which you will be automating, finding the right module can be a challenge. Fortunately, there is help. An open source project called the YANG Catalog was created to be a central point to search for YANG modules across multiple vendors, SDOs, and open source projects. The YANG Catalog is a collection of tools that allow you to search for modules and nodes based on keyword, visualize the modules’ relationships, inspect metadata, and determine which modules are supported in a given platform from a given vendor. It is not a repository from which you can download YANG modules. However, it does provide links to the canonical locations from where modules can be downloaded. The YANG Catalog project is found at https://yangcatalog.org.
The YANG Catalog project began at the Internet Engineering Task Force (IETF) at the hackathons that started ahead of regular meetings. Its mission is to help the industry, network operators, and equipment vendors. For the industry, the YANG Catalog provides a record of what was created to help share best practices. For the network operator, it helps with finding the right YANG module to use for a given task. For the equipment vendors, it eases end-user adoption of the YANG modules.
At first, it was completely developed by a small group of volunteers with a passion for YANG and giving back to the community at large (Benoit Claise, Carl Moberg, and Joe Clarke); later, it received some private funding but was still developed with the broader community in mind. Over time, more tools (such as a regular expression validator as well as the YANG Suite tool discussed next) were added. YANG Catalog is still evolving, and the interfaces shown are likely to change as the suite of tools matures.
YANG Search
The YANG Search feature of YANG Catalog allows you to find modules and nodes based on keywords in the node name, module name, or module description. This is useful if you do not know exactly what module to use for your purposes. Even if you readily have access to devices, it is difficult to search the YANG modules on those devices to find exactly what you want. While the Unix grep command is your friend for searching text, it is not always the most efficient tool when dealing with structured data like YANG modules. Additionally, YANG Catalog’s search feature exposes metadata that shows you what devices (and their versions of code) support specific YANG modules. This metadata is composed of elements that provide more context as to the module and its nodes’ usability and applicability to help you identify the right solution. More details on the types of metadata are provided next.
Therefore, YANG Search is a good place to start if you are drafting a request for proposal, building a composite YANG service module, or are simply interested in what might be the best model for configuring or gathering data from a feature.
The search form offers a number of options; however, the default functionality searches for module names, node names, and node descriptions that match a given keyword, and this is usually sufficient to get started. As before, you want to print the routes on a given device. If you search for “routes,” you get a large number of results. So how can you pare down these results to identify the most relevant nodes and modules?
The search returns the following columns:
The name of the node that was matched
The revision of the YANG module that contains that node
The matching node’s schema type
The XPath notation for the node (useful when wanting to query a device)
The name of the YANG module that contains the matched node
Links to additional YANG Catalog tools
Whether or not the module that contains the matched node is vendor specific or industry defined
The organization that produced the related YANG module
The maturity of the YANG module (more on this later)
The number of times the module has been imported by other modules
The module’s compilation status
The description of the node that was matched
Some of these metadata fields are described in more detail later in this chapter when you look at metadata with a designer’s eye. From a user’s perspective, the origin and maturity indicate how supported and stable the module is. For example, a module that originates from an SDO and ratified was reviewed extensively and could potentially be supported by multiple vendors’ devices.
The default result set, sorted by matching node name, may seem unwieldy, especially with such a generic term like “routes.” However, there are some features of the search that can help you identify good candidates for further exploration. For example, if you are looking to get routes from a specific vendor’s device (and you cannot query the device in question directly), further filter the results based on that vendor’s organization. If you are looking to gather routes across multiple vendors’ devices, using a standards-based module is preferable. Using the search filter field, the modules can be pared down to just those whose origin is “Industry Standard.” You can also uncheck the search option “Node Description” so that only node names and module names are searched. However, even that may leave a lot of results. How can the set be winnowed down even further?
While you could scan through the descriptions of each node, it would first be desirable to identify the most “trustworthy” sources of modules. This is where YANG Catalog’s store of metadata comes into play. While having a module along with its nodes and their descriptions is valuable, there are numerous other properties of that module that factor into its usability. Some of these properties (like revision, references, organization, and author) can be extracted directly from the contents of the module itself. Others (like a module’s maturity, how many times it has been imported by other modules, whether or not it has expired, and its compilation status) cannot be directly ascertained. Fortunately, YANG Catalog collects all of these extractable and non-extractable metadata values.
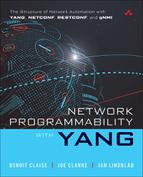
Some of the metadata fields are shown in the search results. Specifically, once you’ve narrowed the results down to Industry Standard modules, sort on Maturity to prioritize those modules that were ratified—or fully standardized—by their authoring body. The IETF is a well-known organization where vendors collaborate to define Internet standards (including YANG modules), so any modules—especially those about routing—authored by that organization that were ratified have had a number of very well-trained eyes look at them. Now you’re looking at a much shorter list. If you also consider those modules that were imported by other modules a greater number of times, you have a set that is much easier to scan to find interesting modules. This prioritized short list is shown in Figure 7-1.

Figure 7-1 Filtered and Sorted YANG Catalog Search Results
Note that the “routes” container (the bottom node in Figure 7-1) is what you looked at in the previous section. So, you’ve arrived at the ietf-routing module that you looked at before. You also have an XPath notation for this same element that you can use in other tools. Under the Module column, take a deeper look at the ietf-routing module by using other tools within the YANG Catalog. These include Tree View, which provides a graphical tree view of the module; Impact Analysis, which shows how this module is affected by other modules, as well as how this module affects other modules (discussed later in this chapter); and Module Details, which allows you to browse all of the module’s metadata.
The Module Tree
The tree view, shown in Figure 7-2, is perhaps a prettier—and definitely more detailed—version of pyang’s “tree” output plug-in, with another important feature missing in pyang: XPaths for each node. Once you find a node or module in which you are interested, the node’s XPath notation is a handy way to query a device for the data at that node, as well as critical for subscribing to telemetry streams.
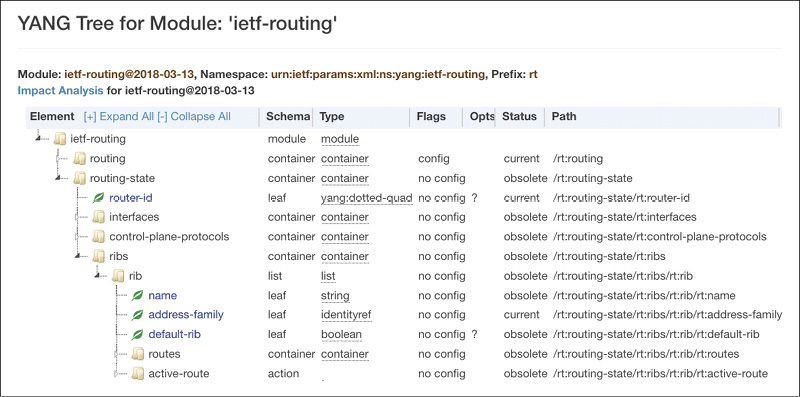
Figure 7-2 YANG Catalog Tree Output of the ietf-routing Module
Module [Metadata] Details
Following the Module Details link from the search results page shows the metadata details for a given module seen in Figure 7-3. These metadata fields are themselves defined in a YANG module that was created as a backing store for the YANG Catalog.
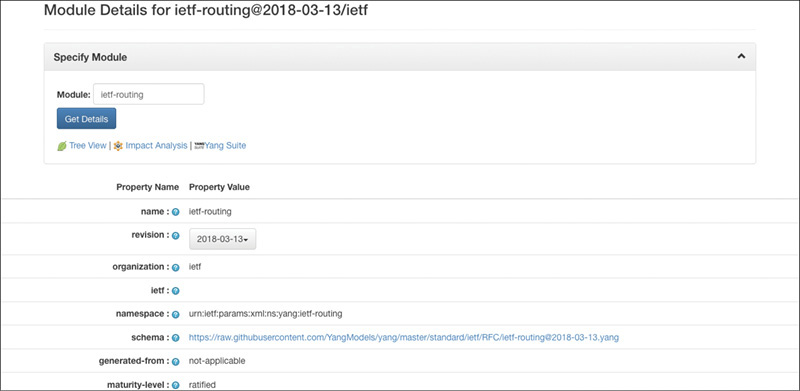
Figure 7-3 Module Details Page for ietf-routing
The full set of metadata available is defined in the yang-catalog.yang module, which is described at https://tools.ietf.org/html/draft-clacla-netmod-model-catalog-03 and enumerated in the following list (note that some of these fields are discussed in more detail in the next section):
Module name
Module revision
Organization that produced the module (if this is “ietf,” the IETF workgroup that developed the module is also provided)
Module namespace
Link to download the module
From where the module was generated (if a native module)
Module maturity level
Document name that further describes or defines the module
Module author’s email
Link to the module’s related document
Module classification (for example, a network device model or a network service model)
Module’s compilation status
Link to the module’s compilation output (if a failure occurred)
Module prefix
YANG version used by the module
Description of the module
Contacts for the module
Type of module (for example, submodule or main module)
Parent module (if current module is a submodule)
Tree type (for example, nmda-compatible, openconfig, split tree, and so on)
Link to the pyang -f tree output for the module
When the module expires (if it expires)
List of any applicable submodules
List of module dependencies
List of dependent modules
The module’s embedded semantic version (if it exists)
The module’s derived semantic version
List of known implementations of the module
On the metadata details page, within the “Specify Module” box, there are links to the same Tree View and Impact Analysis tools shown in the search results. The YANG Suite link is new. This tool is covered from a module exploration perspective in a subsequent section.
Quite a few fields here are of value to a module consumer. First and foremost, the “schema” field offers a canonical link from which you can download the module itself. Extracting modules directly from devices is described later on in this chapter, but if you need an alternate source, the YANG Catalog provides an excellent resource for this. The module’s dependencies (if any) are also found here. Therefore, the YANG Catalog allows you to get all the module components needed to load into a network management system.
The next piece of interesting metadata is the supporting reference document. This is generally only available for modules that were created by a standards body. This reference provides additional details to help clarify certain nodes, explain the reasoning behind design choices, and so on. Combine this with the contact field, and you have both a document that explains the module as well as a group to which you can reach out for more help or information about the module.
The implementations, semantic-version, and derived-semantic-version fields provide important details as to where the module is implemented in various vendors’ devices, as well as how this module compares from a backward-compatibility standpoint. If you were working with a specific module previously, and you find that a new revision is implemented in your platform, how do you know if that revision is backward compatible with previous revisions? This is where semantic-version and derived-semantic-version come into play. Essentially, the semantic version fields are a dotted set of three numbers: MAJOR.MINOR.PATCH. If the MAJOR number changes between different revisions of the same module, then there are non-backward-compatible changes between those two revisions. This means you should inspect the differences between the two module revisions to determine if there are changes needed to your automation scripts and applications. If the MINOR version changes, then new features were added, but the later revision is still backward compatible with the earlier revision. Likewise, if the PATCH version changes, the later revision of the module is backward compatible with the earlier revision, but the later version has additional bug fixes. More details on the structure of semantic versions can be found at semver.org. With respect to the YANG Catalog, the semantic-version field reflects the version taken directly from the YANG module. Not all YANG modules provide this (as of this writing, only Openconfig modules have it). The derived-semantic-version is computed automatically by the YANG Catalog when new revisions of a module are added. In this example, the ietf-routing module at revision 2018-03-13 has a derived-semantic-version of 11.0.0. This means that since the first revision of ietf-routing, there were two additional major, non-backward-compatible changes.
Notice that the automation is as good as the data models, their related metadata, and the tools. Understanding that, metadata enables better use and integration of the module into network management and automation systems. YANG Catalog is revisited later on both from a module author perspective as well as from a developer perspective.
Moving from Nodes to RPCs and Scripts with YANG Suite
Following the YANG Suite link from the Module Details page launches the YANG Suite tool hosted on yangcatalog.org. While this tool can be launched directly from the yangcatalog.org home page by clicking the “YANG exploration” link, invoking it from within Module Details automatically imports the current module (and its dependencies) into YANG Suite. In this example, ietf-routing is preloaded into YANG Suite, allowing you to explore and interact with its various nodes. Figure 7-4 shows the YANG Suite user interface (UI) with the ietf-routing module preloaded. In this section, YANG Suite is used to explore a YANG module or set of YANG modules.
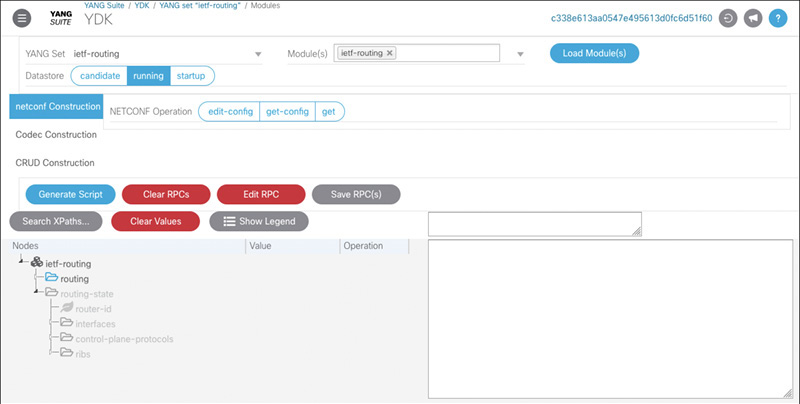
Figure 7-4 YANG Suite with the ietf-routing Module Loaded
Note
At the time of writing, YANG Suite is part of the industry-centric yangcatalog.org. It may move to a Cisco-specific instance of the Catalog at https://yangcatalog.cisco.com, however.
In the next section, YANG Suite is used to interact directly with devices.
The tree diagram looks very similar to the one that is directly linked from the module search results. However, in addition to being able to expand and collapse nodes, this tree allows you to interact with individual module nodes, set values, and then generate RPCs and scripts.
By default, the YANG Suite interface starts by showing the selected module tree (ietf-routing in this example) in the YANG exploration mode. In the version of YANG Suite on yangcatalog.org at the time of writing, this mode allows you to generate Python scripts that use the YANG Development Kit (YDK)1 and ncclient to perform get, get-config, and edit-config NETCONF operations. YDK is covered in much more detail in Chapter 9, “Automation Is as Good as the Data Models, Their Related Metadata, and the Tools: For the Application Developer,” along with other development tools. For now, click Protocols > NETCONF from the YANG Suite menu on the left and select the “ietf-routing” YANG Set and load the “ietf-routing” module. The same tree hierarchy is drawn, and from this interface, raw NETCONF RPCs can be created. Figure 7-5 shows YANG Suite’s NETCONF interface.
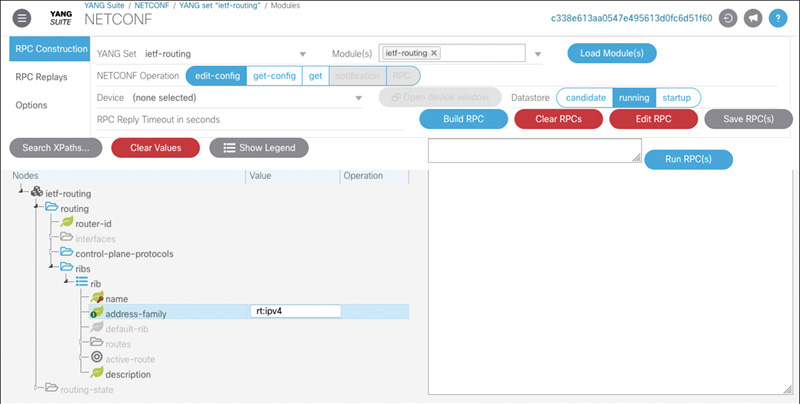
Figure 7-5 YANG Suite’s NETCONF Protocol Screen with ietf-routing Loaded
In this view, the default operation is edit-config; notice that some of the ietf-routing tree is disabled. For example, the entire routing-state subtree is grayed out. This is because all of these nodes are marked config false and thus do not apply to edit-config and get-config operations.
To see what you can do with an edit-config operation, expand the /ietf-routing/routing subtree, click the Value cell next to the router-id leaf, and enter 192.168.1.1. In the Operation cell next to the value, select “merge” from the pull-down list. What you are telling YANG Suite is that you want to merge in a new router ID of 192.168.1.1. On the top left of the screen, there is an Options tab below the selected RPC Construction tab. Click this to reveal additional parameters to control the RPC generation. Once you perform one task, it should become a bit clearer as to what the different options do. For now, leave the parameters with their default values. Click back to RPC Construction and then click the Build RPC button.
The text area below the buttons now has XML in it corresponding to the operation you defined in the tree to the left. That code is shown in Example 7-3.
Example 7-3 RPC Body to Change the router-id Leaf
1. <rpc xmlns="urn:ietf:params:xml:ns:netconf:base:1.0" message-id="101">
2.  <edit-config>
3.    <target>
4.      <running/>
5.    </target>
6.    <config>
7.      <routing xmlns="urn:ietf:params:xml:ns:yang:ietf-routing">
8.        <router-id xmlns:nc="urn:ietf:params:xml:ns:netconf:base:1.0"
nc:operation="merge">192.168.1.1</router-id>
9.      </routing>
10.    </config>
11.  </edit-config>
12. </rpc>
The numbers next to each line are added here to break down the RPC to see how the different options in YANG Suite affect the results.
This XML is exactly what would be sent from a client to a NETCONF server to perform the desired edit-config operation. Since you clicked the Add RPC button, it makes sense that line 1 define an RPC. Line 2 indicates that this is an edit-config operation. Lines 3 through 5 specify that the target for this operation is the candidate datastore. This makes sense given that you left the Datastore pull-down at the default, “candidate,” and why you were prompted to add a commit operation. Lines 6 through 10 define the meat of the operation. In this case, you are using the ietf-routing module (as shown on line 7) to merge a new router ID of 192.168.1.1 (shown on line 8). If you change the value of some of the options in YANG Suite (for example, if you change “merge” to be “remove”), clear, and add a new RPC, you will note how the RPC changes.
YANG Suite also makes it easy to craft RPCs and scripts for getting data from a device. Change the “NETCONF operation” from edit-config to get, and the whole tree becomes active. As you know, the NETCONF get operation allows you to retrieve configuration and operational data from a NETCONF server. To build a get RPC, you need to select the elements from the module that you want to see in the resulting output. For example, if you want to retrieve all of the routing state from a device, click the Value box next to the /ietf-routing/routing-state subtree. A check appears in the box. Now click the Build RPC button on the right. The resulting raw RPC is shown in Example 7-4.
Example 7-4 Get RPC Body Filtering on routing-state
<rpc xmlns="urn:ietf:params:xml:ns:netconf:base:1.0" message-id="101">
  <get>
    <filter>
      <routing-state xmlns="urn:ietf:params:xml:ns:yang:ietf-routing"/>
    </filter>
  </get>
</rpc>
While these raw RPCs illustrate what a NETCONF server sees and help to crystalize some of the different options surrounding YANG-based management, they are not ideal for automating actual configuration or monitoring tasks. Use the script generation capabilities of YANG Suite to help move from learning a YANG module to automating operations for it. As was mentioned before, the default YANG Suite view on yangcatalog.org allows you to create YDK scripts. This view allows you to create scripts that use the Python ncclient package. More of ncclient is explained in Chapter 9. Back under the Options tab, select Display RPC(s) as “Python ncclient script” from the pull-down, return to the RPC Construction tab, and click the Build RPC button again. The RPC text area displays the Python code shown in Example 7-5.
Example 7-5 Python Script Generated from YANG Suite
#! /usr/bin/env python
import lxml.etree as et
from argparse import ArgumentParser
from ncclient import manager
from ncclient.operations import RPCError

payload = [
'''
<get xmlns="urn:ietf:params:xml:ns:netconf:base:1.0">
  <filter>
    <routing-state xmlns="urn:ietf:params:xml:ns:yang:ietf-routing"/>
  </filter>
</get>
''',
]

if __name__ == '__main__':

    parser = ArgumentParser(description='Usage:')

    # script arguments
    parser.add_argument('-a', '--host', type=str, required=True,
                        help="Device IP address or Hostname")
    parser.add_argument('-u', '--username', type=str, required=True,
                        help="Device Username (netconf agent username)")
    parser.add_argument('-p', '--password', type=str, required=True,
                        help="Device Password (netconf agent password)")
    parser.add_argument('--port', type=int, default=830,
                        help="Netconf agent port")
    args = parser.parse_args()

    # connect to netconf agent
    with manager.connect(host=args.host,
                    port=args.port,
                    username=args.username,
                    password=args.password,
                    timeout=90,
                    hostkey_verify=False,
                    device_params={'name': 'csr'}) as m:

        # execute netconf operation
        for rpc in payload:
            try:
                response = m.dispatch(et.fromstring(rpc))
                data = response.data_ele
            except RPCError as e:
                data = e._raw

            # beautify output
            print(et.tostring(data, encoding='unicode', pretty_print=True))
Note that the payload variable is set to the same value as the raw RPC you saw in your get operation. This script is designed to be executed by specifying a few command-line parameters, and it performs the requested NETCONF operation. For example, if you save the script as get-routing.py and you have a device with IP address 10.1.1.1 with a user account called “admin” with a password of “admin,” you can run the script in the following way:
$ ./get-routing.py -a 10.1.1.1 -u admin -p admin
Note
These scripts demonstrate how to make use of these modules at the network element level. They serve as simple examples of code based on YANG modules, providing a nice educational, testing, and troubleshooting set of tools. The YANG Catalog toolchain, including YANG Suite, provides excellent documentation over the API that is the zoo of YANG modules so that you can focus more on the YANG API and less on the YANG language. However, more than just a few scripts are required for robust network automation.
YANG Suite, because of the interactivity it provides, offers a great way to get to know specific YANG modules. By generating RPCs and scripts, you can understand how various configuration and monitoring operations will look on the wire and begin to think through potential use cases. More of YANG Suite is included in the next section as you transition from YANG module exploration to interacting with devices using YANG.
Interacting with Devices
Thus far, you focused on tooling to explore and dissect YANG modules. The reason these modules exist, though, is so you can manage your devices in well-defined, machine-consumable ways. Additionally, you will want to further abstract things so that you can manage the network holistically and enable end-to-end automation.
This section highlights some tools used to interact with devices using model-driven protocols such as NETCONF and RESTCONF, as well as tools to consume telemetry streams from devices. These tools provide a good introduction to how these protocols work and how the YANG-modeled data is turned into practical device-level operations. They are good additions to your model-driven toolbelt. Some of these tools are command line-based while others present a graphical user interface (GUI). The tools you use will depend on your use cases. Command-line tools work well within scripts, while GUI tools offer a human ease-of-use angle, especially useful for wrapping your head around YANG, NETCONF, RESTCONF, and telemetry concepts. Some basic functionality is explained here, and more in-depth, real-world examples of device interactions are covered in Chapter 10, “Using NETCONF and YANG.”
NETCONF Tools
The tools described in these next sections allow you to interact with devices through NETCONF. This includes typical operations such as fetching configurations and operational data and modifying configurations, as well as some “meta” operations such as determining what modules a network element supports and obtaining local copies of those modules directly from the network elements themselves.
YANG Suite
Previously in this chapter you looked at YANG Suite as a tool offered in the YANG Catalog, which enables you to explore YANG modules and generate sample RPCs and scripts. In addition to offering a graphical interface to device interactions, it has a number of features aimed at easing the exploration of device capabilities and creating useful subsets of YANG modules to accomplish specific tasks. YANG Suite is also available as a Python package that can be installed on Linux, macOS, and Windows so that you can use it as a way to directly interact with devices using a web-based interface.
Note
At the time of writing, the distribution plans for YANG Suite are still being determined. The latest information is that YANG Suite is expected to be released as a downloadable product in calendar year 2019. Some of the screen images and instructions may change between now and then, but the underlying capabilities and intent behind YANG Suite will remain the same.
Install YANG Suite using the instructions found in its included README file. YANG Suite runs a web server on port 8480 by default. Use a browser to connect to http://localhost:8480, log in using the username and password you created during installation, and then begin to use the YANG Suite features locally.
With YANG Suite on the YANG Catalog site, the module you wanted was automatically added to YANG Suite with all of its dependencies from the other YANG Catalog tools. Since you are now running it locally, you are responsible for finding the modules and adding their dependencies. Fortunately, YANG Suite has a feature to retrieve modules directly from devices using the NETCONF protocol.
YANG Suite uses “device profiles” to understand the basic communication and credential aspects of devices. You must set up a device profile for each device with which you want to work. Currently, YANG Suite supports NETCONF as the YANG-based transport; however, RESTCONF support is under development. Figure 7-6 shows the New Device Profile setup screen when creating a profile for the 192.168.10.48 test device.
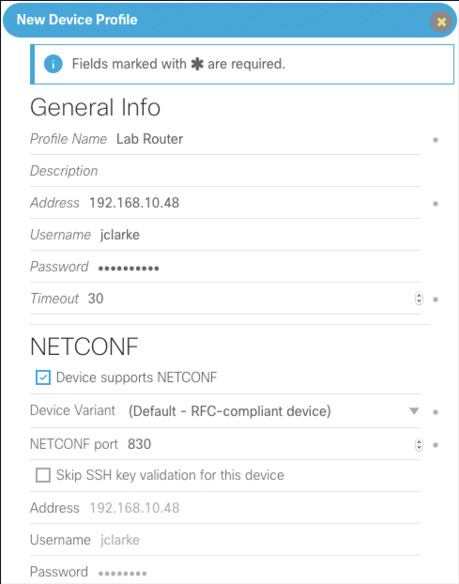
Figure 7-6 YANG Suite Device Profile Settings
Once you have a device profile, you need to create a YANG Suite repository. Set up a new empty repository, and you are prompted for two options to add modules to it. One is to load them manually from the file system. The other is to download them using one of your device profiles. Select the device profile you just created and get the schema list. For this step to work, the device must support the ietf-netconf-monitoring module.
Note
The device Timeout value shown in the device profile may need to be increased from its default value of 30 seconds in order to support downloading the entire schema successfully.
Once YANG Suite retrieves the list, choose which modules to import into your repository. While you might think to just add the module (or modules) you are explicitly going to use, know that doing so requires you to resolve all of the dependencies for that module yourself. Instead, import all of the modules from the device. Pare those down later using YANG module sets.
With the repository created, you move to defining a YANG module set (or multiple YANG sets). YANG module sets (or just YANG sets) group modules from a given repository for purposes of exploration or for interacting with devices for specific tasks. While you can certainly create a YANG set with all of the modules in a repository, it helps to focus the module list in a set to reduce the tree size and complexity as well as reduce load time in the user interface. A nice feature of YANG Suite is that the YANG set interface helps you identify modules that fit into a set as you add other modules. For example, since you are looking at the ietf-routing module, you might decide to create a YANG set that contains only that module. However, that module has dependencies. There are also modules that augment ietf-routing and introduce derived identities (such as ietf-ipv4-unicast-routing). Because you added all of the modules from your device to your repository, YANG Suite knows about these interrelations. As you add modules to your set, YANG Suite suggests additional modules that are either required because they are dependencies or nice to have because they add more context.
Figure 7-7 shows a YANG set defined with the ietf-routing module, its dependencies, and the ietf-ipv4-unicast-routing module all added. If there are additional modules in the repository that would add more definitions and flesh out the tree context, they are displayed in the center selection field.
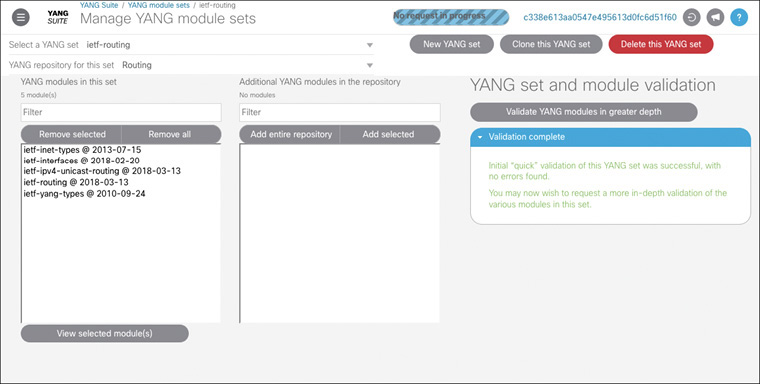
Figure 7-7 YANG Set in YANG Suite
Now move to the Operations > NETCONF screen. This will look familiar from the version on YANG Catalog. However, now that you have a local instance, you can test the generated RPCs against your device. First thing to do is select the YANG set that you previously created. This then allows you to choose a module for drawing the tree. In the routing example, select ietf-routing and click the “Load module(s)” button. Notice that even though you didn’t choose the ietf-interfaces module, the subtree for it is displayed. This is because YANG Suite automatically resolves dependencies and additional augmentations based on the modules found within the YANG set. This also means that the ietf-routing subtree contains the ietf-ipv4-unicast-routing additions.
At the top, select the Get-config NETCONF operation, expand the ietf-routing subtree, and click in the Value column next to routing to “check” that column for inclusion. Click the Add RPC button on the right. With the YANG Catalog version, you can simply review the RPC. With your local instance, select your device profile from the Device pull-down and choose an appropriate datastore. Then click the Run RPC button, and the results of the executed RPC display in a pop-up window frame.
YANG Suite helps simple edit-config operations by providing a visual, tree representation of the nodes to be configured. This tree interface also shows which leafs are keys so you can be sure you’ve filled in the correct elements. For example, if you want to create a new IPv4 static route in the default routing-instance that points to prefix 10.20.30.0/24 to 192.168.20.1, first fill in the values next to all leafs that have a lock icon next to them (these are mandatory keys). Finally, fill in the respective values for v4ur:destination-prefix and v4ur:next-hop-address. Add the RPC and run it. If your device supports a candidate datastore, perform the edit-config there, and YANG Suite prompts you if you want to add a commit after making the configuration change.
The RPC text area in YANG Suite is additive, meaning you can continue to add operations to perform within a single NETCONF transaction. There may also be sets of RPCs that you want to reuse multiple times either for a single device or across multiple devices. You can create saved tasks within YANG Suite for this purpose. Once the RPC text area contains the specific recipe you’d like to save, click the Save as Task button and give your task a name and description. The task is then listed in the Task List pull-down on the right of the window. Like YANG repositories and sets, tasks are persistent for the current user.
If the device supports NETCONF notifications (as defined in RFC 5277), then clicking Notifications next to the device pull-down displays a window listing the available streams on the device. Subscribe to one or more of them, and YANG Suite displays the notifications it receives in real time in a new pop-up window.
In addition to these device interactions tasks, your local instance of YANG Suite can do everything the YANG Catalog version can do. With its multiuser capability, it’s a great tool to spin up in your network to give engineers a way to consistently explore YANG modules and test device interactions.
Netconf-console
Netconf-console is a handy Python-based command-line utility for interacting with devices using the NETCONF protocol. Like pyang, it is available in the PyPI Python package index, and thus is installable with the pip utility. Netconf-console not only allows you to make configuration changes and gather operational data, but you can use it to discover device capabilities and retrieve YANG module schema directly from the devices themselves. Thus, if you’ve determined the module you want to use, you can confirm that the device supports it directly by querying the device, or you can get the modules the device supports and explore them to understand the device’s management capabilities.
To get started with netconf-console, install it using pip:
$ pip install netconf-console
This command installs, among other Python libraries, a netconf-console executable. By default, netconf-console wants to establish a NETCONF session to localhost on port 2022. However, it supports a number of command-line options to get it to interact with remote devices. Run netconf-console with the --help argument to get its command-line options.
The next step is to find out what your device supports. If you have a device with IP address 192.168.10.48 that is configured with NETCONF on the standard port of 830, you can request its capabilities (that is, the NETCONF features and YANG modules it supports) using the --hello argument to netconf-console, as shown next. The abridged output is shown in Example 7-6.
$ netconf-console --host 192.168.10.48 --port 830 -u username -p password --hello
Example 7-6 Output of <hello> from netconf-console
<nc:hello xmlns:nc="urn:ietf:params:xml:ns:netconf:base:1.0">
<nc:capabilities>
<nc:capability>urn:ietf:params:netconf:capability:rollback-on-error:1.0
</nc:capability>
<nc:capability>urn:ietf:params:xml:ns:netconf:base:1.0?module=ietf-netconf&
revision=2011-06-01</nc:capability>
<nc:capability>urn:ietf:params:xml:ns:yang:ietf-routing?module=ietf-routing&
revision=2015-05-25&features=router-id,multiple-ribs&deviations=cisco-xe-ietf-routing-deviation</nc:capability>
<nc:capability>urn:ietf:params:xml:ns:yang:ietf-interfaces?module=ietf-interfaces&revision=2014-05-08&features=pre-provisioning,if-mib,
arbitrary-names</nc:capability>
<nc:capability>urn:ietf:params:xml:ns:yang:ietf-ipv4-unicast-routing?module=
ietf-ipv4-unicast-routing&revision=2015-05-25&deviations=cisco-xe-ietf-ipv4-unicast-routing-deviation</nc:capability>
<nc:capability>http://cisco.com/ns/cisco-xe-ietf-ipv4-unicast-routing-deviation?
module=cisco-xe-ietf-ipv4-unicast-routing-deviation&revision=2015-09-11
</nc:capability>
...
</nc:capabilities>
</nc:hello>
So far, you’ve explored the ietf-routing YANG module at revision 2018-03-13. The 2018-03-13 revision represents the latest ratified standard version as of this writing. The 192.168.10.48 device supports the ietf-routing module, but an older revision. Use the netconf-console utility to pull this module directly off of the device much like you did with YANG Suite. Instead of the --hello argument, run netconf-console with --schema ietf-routing to get the full contents of ietf-routing@2015-05-25 (that is, the exact revision of the module supported by the device), as shown next. The abridged output is shown in Example 7-7.
$ netconf-console --host 192.168.10.48 --port 830 -u username
                  -p password --schema ietf-routing
Example 7-7 Excerpt of the ietf-routing Schema Extracted from a Device
<data xmlns="urn:ietf:params:xml:ns:yang:ietf-netconf-monitoring"
xmlns:nc="urn:ietf:params:xml:ns:netconf:base:1.0">   module ietf-routing {

     namespace "urn:ietf:params:xml:ns:yang:ietf-routing";

     prefix "rt";

     import ietf-yang-types {
       prefix "yang";
     }

     import ietf-interfaces {
       prefix "if";
     }
...
While this provides the entire ietf-routing@2015-05-25 module, like other NETCONF data, it is returned encoded in XML. In order to use this module with tools like pyang, the content of the <data> element must be extracted and decoded. This is done in a number of ways, but an easy and reliable way to do it is to install the XML-Twig utilities from http://www.xmltwig.org/xmltwig/. One of the utilities, xml_grep, allows you to specify an XPath and pull out that node’s data. Using xml_grep along with netconf-console, you can extract the device’s ietf-routing YANG module into a file to be used with other YANG exploration and network automation tools, as shown in Example 7-8.
Example 7-8 Use xml_grep to Extract the ietf-routing Module into a Local File
$ netconf-console --host 192.168.10.48 --port 830 -u username
                  -p password --get-schema ietf-routing
        | xml_grep 'data' --text_only
        > [email protected]
Using pyang, you get this module’s tree structure, as shown in Example 7-9.
Example 7-9 Tree Structure of Extracted ietf-routing Module
module: ietf-routing
  +--ro routing-state
  |  +--ro routing-instance* [name]
  |     +--ro name                 string
  |     +--ro type?                identityref
  |     +--ro router-id?           yang:dotted-quad
  |     +--ro interfaces
  |     |  +--ro interface*   if:interface-state-ref
  |     +--ro routing-protocols
  |     |  +--ro routing-protocol* [type name]
  |     |     +--ro type    identityref
  |     |     +--ro name    string
  |     +--ro ribs
  |        +--ro rib* [name]
  |           +--ro name              string
  |           +--ro address-family    identityref
  |           +--ro default-rib?      boolean {multiple-ribs}?
  |           +--ro routes
  |              +--ro route* [destination-prefix]
  |                 +--ro route-preference?     route-preference
  |                 +--ro destination-prefix    string
  |                 +--ro metric?               uint32
  |                 +--ro next-hop
  |                 |  +--ro (next-hop-options)
  |                 |     +--:(simple-next-hop)
  |                 |     |  +--ro outgoing-interface?   string
  |                 |     |  +--ro next-hop-address?     string
  |                 |     +--:(special-next-hop)
  |                 |        +--ro special-next-hop?     enumeration
  |                 +--ro source-protocol       identityref
  |                 +--ro active?               empty
  |                 +--ro last-updated?         yang:date-and-time
  |                 +--ro update-source?        string
  +--rw routing
     +--rw routing-instance* [name]
        +--rw name                 string
        +--rw type?                identityref
        +--rw enabled?             boolean
        +--rw router-id?           yang:dotted-quad
        +--rw description?         string
        +--rw interfaces
        |  +--rw interface*   if:interface-ref
        +--rw routing-protocols
        |  +--rw routing-protocol* [type name]
        |     +--rw type             identityref
        |     +--rw name             string
        |     +--rw description?     string
        |     +--rw static-routes
        +--rw ribs
           +--rw rib* [name]
              +--rw name              string
              +--rw address-family?   identityref
              +--rw description?      string

  augment /if:interfaces-state/if:interface:
    +--ro routing-instance?   string

  rpcs:
    +---x fib-route
       +---w input
       |  +---w routing-instance-name    string
       |  +---w destination-address
       |     +---w address-family    identityref
       +--ro output
          +--ro route
             +--ro address-family     identityref
             +--ro next-hop
             |  +--ro (next-hop-options)
             |     +--:(simple-next-hop)
             |     |  +--ro outgoing-interface?   string
             |     |  +--ro next-hop-address?     string
             |     +--:(special-next-hop)
             |        +--ro special-next-hop?     enumeration
             +--ro source-protocol    identityref
             +--ro active?            empty
             +--ro last-updated?      yang:date-and-time
There are a number of differences between the ietf-routing module supported by this device and the latest standard. For example, the routing-state subtree was not obsoleted, and the fib-route node is an RPC as opposed to an action.
Going back to the capabilities list, note that this device’s implementation of the ietf-routing module has a set of deviations. Those are described in the “cisco-xe-ietf-routing-deviation” module. Just as with the ietf-routing module itself, use netconf-console to download the deviation module, as shown in Example 7-10.
Example 7-10 Use xml_grep to Extract the cisco-xe-ietf-routing-deviation Module into a Local File
$ netconf-console --host 192.168.10.48 --port 830 -u username  -p password
--get-schema
        cisco-xe-ietf-routing-deviation | xml_grep 'data'
        --text_only > cisco-xe-ietf-routing-deviation.yang
Example 7-11 shows the deviations extracted from this module.
Example 7-11 Deviations for the ietf-routing Module
deviation /rt:routing/rt:routing-instance/rt:type {
  deviate not-supported;
  description  "Not supported in IOS-XE 3.17 release.";
}

deviation /rt:routing/rt:routing-instance/rt:enabled {
  deviate not-supported;
  description  "Not supported in IOS-XE 3.17 release.";
}

deviation "/rt:routing/rt:routing-instance/rt:routing-protocols" +
          "/rt:routing-protocol/rt:description" {
  deviate not-supported;
  description  "Not supported in IOS-XE 3.17 release.";
}

deviation "/rt:routing-state/rt:routing-instance/rt:ribs/rt:rib/rt:routes/rt:route/rt:last-updated" {
      description
          "Modifies the usage of yang:date-and-time in itef-routing
           temporarily to string so that Router's time notation is
           passed as it is without conversion to yang:date-and-time format.";

      deviate replace {
          type string;
      }

  }
The four deviations indicate that this particular device does not support the /rt:routing/rt:routing-instance/rt:type, /rt:routing/rt:routing-instance/rt:enabled, or the /rt:routing/rt:routing-instance/rt:routing-protocols/rt:routing-protocol/rt:description nodes; and the /rt:routing-state/rt:routing-instance/rt:ribs/rt:rib/rt:routes/rt:route/rt:last-updated node returns a string and not a yang:date-and-time. This is valuable information to build out an automation solution: You must design for the capabilities the network presents to you.
Pyang makes it easy to visualize these deviations within the tree structure. With both the downloaded ietf-routing.yang and cisco-xe-ietf-routing-deviation.yang modules in the same directory, run the following command to obtain the tree shown in Example 7-12. Note that this tree omits the nodes that are not supported and adjusts the type on the last-updated leaf. Annotations were added to the tree here to make it easier to spot the differences.
$ pyang -f tree
     --deviation-module=cisco-xe-ietf-routing-deviation.yang
     ietf-routing.yang
Example 7-12 Combined ietf-routing Tree Taking Deviations into Account
module: ietf-routing
  +--ro routing-state
  |  +--ro routing-instance* [name]
  |     +--ro name                 string
  |     +--ro type?                identityref
  |     +--ro router-id?           yang:dotted-quad
  |     +--ro interfaces
  |     |  +--ro interface*   if:interface-state-ref
  |     +--ro routing-protocols
  |     |  +--ro routing-protocol* [type name]
  |     |     +--ro type    identityref
  |     |     +--ro name    string
  |     +--ro ribs
  |        +--ro rib* [name]
  |           +--ro name              string
  |           +--ro address-family    identityref
  |           +--ro default-rib?      boolean {multiple-ribs}?
  |           +--ro routes
  |              +--ro route* [destination-prefix]
  |                 +--ro route-preference?     route-preference
  |                 +--ro destination-prefix    string
  |                 +--ro metric?               uint32
  |                 +--ro next-hop
  |                 |  +--ro (next-hop-options)
  |                 |     +--:(simple-next-hop)
  |                 |     |  +--ro outgoing-interface?   string
  |                 |     |  +--ro next-hop-address?     string
  |                 |     +--:(special-next-hop)
  |                 |        +--ro special-next-hop?     enumeration
  |                 +--ro source-protocol       identityref
  |                 +--ro active?               empty
  |                 +--ro last-updated?         string ← Note: type UPDATED
  |                 +--ro update-source?        string
  +--rw routing
     +--rw routing-instance* [name]
        +--rw name                 string
        +--rw router-id?           yang:dotted-quad

                      → Note: MISSING type and enabled nodes here

        +--rw description?         string
        +--rw interfaces
        |  +--rw interface*   if:interface-ref
        +--rw routing-protocols
        |  +--rw routing-protocol* [type name]
        |     +--rw type             identityref
        |     +--rw name             string

                      → Note: MISSING description node here

        |     +--rw static-routes
        +--rw ribs
           +--rw rib* [name]
              +--rw name              string
              +--rw address-family?   identityref
              +--rw description?      string

  augment /if:interfaces-state/if:interface:
    +--ro routing-instance?   string

  rpcs:
    +---x fib-route
       +---w input
       |  +---w routing-instance-name    string
       |  +---w destination-address
       |     +---w address-family    identityref
       +--ro output
          +--ro route
             +--ro address-family     identityref
             +--ro next-hop
             |  +--ro (next-hop-options)
             |     +--:(simple-next-hop)
             |     |  +--ro outgoing-interface?   string
             |     |  +--ro next-hop-address?     string
             |     +--:(special-next-hop)
             |        +--ro special-next-hop?     enumeration
             +--ro source-protocol    identityref
             +--ro active?            empty
             +--ro last-updated?      yang:date-and-time
Now that you know what the device supports, and you’ve pulled down the modules, perform a <get-config> operation to gather the configured routing data. The --get-config argument to netconf-console takes two optional arguments: --db to specify a datastore, and -x to specify an XPath filter. If neither is specified, the full configuration is returned from the “running” datastore. In order to focus only on the routing configuration, provide an XPath filter to limit the output. When you were looking at the ietf-routing module within the YANG Catalog tools, all of the XPaths began with /rt:routing. You see in your tree here that routing is a top-level node with the “rw” notation next to it (recall that means it’s a config true node). You can use this /rt:routing XPath filter with netconf-console, but you first need to tell it what the full namespace is for the prefix rt. To do that, specify the --ns argument with “prefix=namespace” notation (in this case, “rt=urn:ietf:params:xml:ns:yang:ietf-routing”). The full command is found in Example 7-13 and followed by its output in Example 7-14.
Example 7-13 Obtain the Configuration Filtered on the /rt:routing Path
$ netconf-console --host 192.168.10.48 --port 830 -u username
   -p password
   --ns rt= urn:ietf:params:xml:ns:yang:ietf-routing
   --get-config -x /rt:routing
Example 7-14 Configuration Filtered to Show Only the /rt:routing Path
<data xmlns="urn:ietf:params:xml:ns:netconf:base:1.0"
xmlns:nc="urn:ietf:params:xml:ns:netconf:base:1.0">
  <routing xmlns="urn:ietf:params:xml:ns:yang:ietf-routing">
    <routing-instance>
      <name>VRF4</name>
      <interfaces/>
      <routing-protocols>
        <routing-protocol>
          <type>static</type>
          <name>1</name>
        </routing-protocol>
      </routing-protocols>
    </routing-instance>
    <routing-instance>
      <name>default</name>
      <description>default-vrf [read-only]</description>
      <interfaces/>
      <routing-protocols>
        <routing-protocol>
          <type xmlns:ospf="urn:ietf:params:xml:ns:yang:ietf-ospf">ospf:ospfv2</type>
          <name>1</name>
          <ospf xmlns="urn:ietf:params:xml:ns:yang:ietf-ospf">
            <instance>
              <af xmlns:rt="urn:ietf:params:xml:ns:yang:ietf-routing">rt:ipv4</af>
              <nsr>
                <enable>false</enable>
              </nsr>
              <auto-cost>
                <enable>false</enable>
              </auto-cost>
              <redistribution xmlns="urn:ietf:params:xml:ns:yang:cisco-ospf">
                <rip/>
              </redistribution>
            </instance>
          </ospf>
        </routing-protocol>
        <routing-protocol>
          <type>static</type>
          <name>1</name>
          <static-routes>
            <ipv4 xmlns="urn:ietf:params:xml:ns:yang:ietf-ipv4-unicast-routing">
              <route>
                <destination-prefix>10.10.10.10/32</destination-prefix>
                <next-hop>
                  <next-hop-address>192.168.20.236</next-hop-address>
                </next-hop>
              </route>
            </ipv4>
            <ipv6 xmlns="urn:ietf:params:xml:ns:yang:ietf-ipv6-unicast-routing">
              <route>
                <destination-prefix>::/0</destination-prefix>
                <next-hop>
                  <next-hop-address>2001:db8::7:1</next-hop-address>
                </next-hop>
              </route>
            </ipv6>
          </static-routes>
        </routing-protocol>
      </routing-protocols>
    </routing-instance>
  </routing>
</data>
Note that a number of namespaces other than ietf-routing’s “urn:ietf:params:xml:ns:yang:ietf-routing” are referenced in this output. These are defined in other modules that augment the ietf-routing configuration structure. Pull these down using the same method just described by getting the module name from the capabilities output.
Pull down the ietf-ipv4-unicast-routing module and use it to build the configuration needed to add a static IPv4 route using <edit-config>, as shown in Example 7-15.
Example 7-15 Use xml_grep to Extract the ietf-ipv4-unicast-routing Module into a Local File
e$ netconf-consol --host 192.168.10.48 --port 830 -u username  -p password
--get-schema
        ietf-ipv4-unicast-routing
        | xml_grep 'data' --text_only
        > [email protected]
Example 7-16 also shows that the ietf-ipv4-unicast-routing module has its own deviations for this device, so pull down that module as well.
Example 7-16 Use xml_grep to Extract the cisco-xe-ietf-ipv4-unicast-routing-deviation Module into a Local File
$ netconf-console --host 192.168.10.48 --port 830 -u username  -p password
--get-schema
        cisco-xe-ietf-ipv4-unicast-routing-deviation
        | xml_grep 'data' --text_only
        > cisco-xe-ietf-ipv4-unicast-routing-deviation.yang
Pass all of the modules you downloaded thus far to pyang using the command shown in Example 7-17 to get the combined tree shown in Example 7-18.
Example 7-17 Display a Composite Tree with All Related Routing Modules
$ pyang -f tree
  --deviation-module=cisco-xe-ietf-routing-deviation.yang
  --deviation-module=cisco-xe-ietf-ipv4-unicast-routing-deviation.yang
  [email protected]
  [email protected]
Example 7-18 Composite Routing Tree with All Deviations and Augmentations Added
module: ietf-routing
  +--ro routing-state
  |  +--ro routing-instance* [name]
  |     +--ro name                 string
  |     +--ro type?                identityref
  |     +--ro router-id?           yang:dotted-quad
  |     +--ro interfaces
  |     |  +--ro interface*   if:interface-state-ref
  |     +--ro routing-protocols
  |     |  +--ro routing-protocol* [type name]
  |     |     +--ro type    identityref
  |     |     +--ro name    string
  |     +--ro ribs
  |        +--ro rib* [name]
  |           +--ro name              string
  |           +--ro address-family    identityref
  |           +--ro default-rib?      boolean {multiple-ribs}?
  |           +--ro routes
  |              +--ro route* [destination-prefix]
  |                 +--ro route-preference?     route-preference
  |                 +--ro destination-prefix    string
  |                 +--ro metric?               uint32
  |                 +--ro next-hop
  |                 |  +--ro (next-hop-options)
  |                 |     +--:(simple-next-hop)
  |                 |     |  +--ro outgoing-interface?   string
  |                 |     |  +--ro next-hop-address?     string
  |                 |     +--:(special-next-hop)
  |                 |        +--ro special-next-hop?     enumeration
  |                 +--ro source-protocol       identityref
  |                 +--ro active?               empty
  |                 +--ro last-updated?         string
  |                 +--ro update-source?        string
  +--rw routing
     +--rw routing-instance* [name]
        +--rw name                 string
        +--rw router-id?           yang:dotted-quad
        +--rw description?         string
        +--rw interfaces
        |  +--rw interface*   if:interface-ref
        +--rw routing-protocols
        |  +--rw routing-protocol* [type name]
        |     +--rw type             identityref
        |     +--rw name             string
        |     +--rw static-routes
        |        +--rw v4ur:ipv4
        |           +--rw v4ur:route* [destination-prefix]
        |              +--rw v4ur:destination-prefix    inet:ipv4-prefix
        |              +--rw v4ur:next-hop
        |                 +--rw (v4ur:next-hop-options)
        |                    +--:(v4ur:simple-next-hop)
        |                    |  +--rw v4ur:outgoing-interface?   string
        |                    +--:(v4ur:special-next-hop)
        |                    |  +--rw v4ur:special-next-hop?     enumeration
        |                    +--:(v4ur:next-hop-address)
        |                       +--rw v4ur:next-hop-address?     inet:ipv4-address
        +--rw ribs
           +--rw rib* [name]
              +--rw name              string
              +--rw address-family?   identityref
              +--rw description?      string

  augment /if:interfaces-state/if:interface:
    +--ro routing-instance?   string

...
The part of the tree you want to use is shown in bold font in Example 7-18. The ietf-ipv4-unicast-routing module augments the base ietf-routing module to add IPv4 unicast-specific routing elements. One of the augmentations it provides is support for IPv4 static routes. Such a route has an IPv4 destination prefix and a choice of IPv4 next-hop address. Looking at the <get-config> output from your device, you see it already has a number of IPv4 static routes that correspond to the schema shown in Example 7-18.
To add a new static route for prefix 172.16.1.0/24 with a next hop of 192.168.20.1, create a file called new-route.xml with the contents shown in Example 7-19. (Hint: You can also use YANG Suite to create this RPC, as shown earlier.) These contents resemble the results of the <get-config> operation.
Example 7-19 Body of the <edit-config> Configuration Structure to Add a Static Route
<routing xmlns="urn:ietf:params:xml:ns:yang:ietf-routing">
    <routing-instance>
      <name>default</name>
      <routing-protocols>
        <routing-protocol>
          <type>static</type>
          <name>1</name>
          <static-routes>
            <ipv4 xmlns="urn:ietf:params:xml:ns:yang:ietf-ipv4-unicast-routing"
xmlns:nc="urn:ietf:params:xml:ns:netconf:base:1.0" nc:operation="merge">
              <route>
                  <destination-prefix>172.16.1.0/24</destination-prefix>
                <next-hop>
                      <next-hop-address>192.168.20.1</next-hop-address>
                    </next-hop>
                  </route>
                </ipv4>
              </static-routes>
            </routing-protocol>
          </routing-protocols>
        </routing-instance>
      </routing>
The addition of nc:operation=“merge” here instructs the device to merge this configuration into the current configuration. If you were to use an operation such as replace, the static routes are overwritten with the contents of this new <edit-config>.
Perform the <edit-config> operation to the device with the following command:
$ netconf-console --host 192.168.10.48 --port 830 -u username
                  -p password --edit-config new-route.xml
Note
Just as with --get-config, netconf-console accepts an optional --db argument to specify a datastore other than “running.” This example inserts this route directly into the default running datastore.
Netconf-console displays an <ok> result if the device accepted the <edit-config> operation. If any error occurred, the resulting error tag and details are displayed.
In addition to showing configuration data, netconf-console can perform <get> operations to display operational data. The ietf-routing module supported by this device supports a routing-state subtree that has nodes marked with “ro” in the tree (indicating config false or operational state nodes). Using the --get argument with the same --ns argument and an XPath filter of /rt:routing-state, you can display the operational state of routing on this device, as shown next. The output of this command is shown in Example 7-20.
$ netconf-console --host 192.168.10.48 --port 830 -u username -p password
        --ns rt=urn:ietf:params:xml:ns:yang:ietf-routing
        --get -x /rt:routing-state
Example 7-20 The Operational State of the Device Filtered to Only Show the routing-state Path
<routing-state xmlns="urn:ietf:params:xml:ns:yang:ietf-routing">
    <routing-instance>
      <name>default</name>
      <ribs>
        <rib>
          <name>ipv4-default</name>
          <address-family>ipv4</address-family>
          <default-rib>false</default-rib>
          <routes>
            <route>
              <destination-prefix>0.0.0.0</destination-prefix>
              <route-preference>1</route-preference>
              <metric>1</metric>
              <next-hop>
                <outgoing-interface/>
                <next-hop-address>192.168.10.1</next-hop-address>
              </next-hop>
              <source-protocol>static</source-protocol>
              <active/>
            </route>
            <route>
              <destination-prefix>172.16.1.0</destination-prefix>
              <route-preference>0</route-preference>
              <metric>0</metric>
              <next-hop>
                <outgoing-interface/>
                <next-hop-address>192.168.20.1</next-hop-address>
              </next-hop>
              <source-protocol>direct</source-protocol>
              <active/>
            </route>
          </routes>
        </rib>
        <rib>
          <name>ipv6-default</name>
          <address-family>ipv6</address-family>
          <default-rib>false</default-rib>
          <routes>
            <route>
              <destination-prefix>::</destination-prefix>
              <route-preference>1</route-preference>
              <metric>1</metric>
              <next-hop>
                <outgoing-interface/>
                <next-hop-address>2001:db8::7:1</next-hop-address>
              </next-hop>
              <source-protocol>static</source-protocol>
              <active/>
            </route>
          </routes>
        </rib>
      </ribs>
    </routing-instance>
  </routing-state>
This result shows the contents of the active routing state on the device and also indicates that the route for 172.16.1.0/24 that you configured with <edit-config> was properly installed into the Routing Information Base (RIB).
Looking back through the usage help for netconf-console, you can see that it offers a number of other operations, such as saving the running datastore to the startup datastore, validating the configuration to be deployed, performing custom RPCs, and locking devices for multistep transactions. It also features an interactive mode (with the -i argument) that drops you to a netconf> prompt, which allows you to perform the same set of commands, but in more of a Unix-like shell environment.
Ansible
Ansible2 is a popular automation framework used in many different areas of IT. It started out as a way to automate the deployment of new compute services and grew plug-ins to automate the deployment and configuration of network devices, applications, and services.
At its core, Ansible uses the concepts of “playbooks,” “roles,” and “tasks” to string together atomic operations in order to build complex automations. Ansible does not require an agent or a piece of client software to be installed on the remote elements in order to interact with them. Instead, it uses Secure Shell (SSH) (and Windows Remote Management [WinRM] in the case of Windows) to execute its automations. Depending on the type of element to be automated, Ansible may copy Python or PowerShell code over to it temporarily, or it may execute the Python code locally. This makes getting started with Ansible relatively easy.
When the first Ansible modules were written for the networking space, they essentially provided a means to execute command-line interface (CLI) commands on network devices from within the Ansible playbooks. These modules evolved to embrace more programmatic interfaces that some devices possessed. Starting in Ansible 2.2, those interfaces included NETCONF with the introduction of the netconf_config module.
The netconf_config module provides a way to execute edit-config RPCs given an XML payload. It supports options for specifying a datastore to modify as well as an option to save to the startup configuration (if it exists). The edit-config operation to add a new static route that you performed using netconf-console can be done as an Ansible task, as shown in Example 7-21.
Example 7-21 Ansible Task to Add a New Static Route Using netconf_config
- name: Configure static route to service network
  netconf_config:
    host: "{{ item }}"
    datastore: running
    xml: |
      <config>
        <routing xmlns="urn:ietf:params:xml:ns:yang:ietf-routing">
          <routing-instance>
            <name>default</name>
            <routing-protocols>
              <routing-protocol>
                <type>static</type>
                <name>1</name>
                <static-routes>
                  <ipv4 xmlns="urn:ietf:params:xml:ns:yang:ietf-ipv4-unicast-routing" xmlns:nc="urn:ietf:params:xml:ns:netconf:base:1.0" nc:operation="merge">
                    <route>
                        <destination-prefix>{{ service_network }}</destination-prefix>
                      <next-hop>
                        <next-hop-address>{{ service_gateway }}</next-hop-address>
                      </next-hop>
                    </route>
                  </ipv4>
                </static-routes>
              </routing-protocol>
            </routing-protocols>
          </routing-instance>
        </routing>
      </config>
  with_items: "{{ groups['devices'] }}"
NETCONF support in Ansible has evolved since 2.2. Ansible 2.3 and higher offer a way to create persistent NETCONF sessions with its netconf connection plug-in. Ansible 2.6 introduced the netconf_rpc plug-in, which provides a way to execute RPCs other than edit-config. Version 2.6 also introduced the netconf_get plug-in specifically for retrieving operational data. Both the netconf_rpc and netconf_get plug-ins have a “display” parameter that enables the XML data the device returns to be rendered as either XML or JSON. This makes it easy to extract relevant details from a device and then push back the right configuration changes.
The NETCONF capabilities within Ansible offer a marked improvement of straight CLI for automating configuration changes and operational data retrievals. However, you still need to know the XML structure of the modules, and you still need to work device-by-device. In Chapter 11, “YANG Model Design,” Ansible integration with Cisco’s Network Services Orchestrator (NSO) is discussed, which provides a layer of network and service abstraction, making your Ansible automation even more powerful.
RESTCONF Tools
In addition to YANG-based tools that use the NETCONF protocol for interacting with devices, there are a number of tools you can use to explore a device’s RESTCONF interface. Because RESTCONF uses a Hypertext Transfer Protocol (HTTP), Representational State Transfer (REST)–like flow, many tools you would use to interact with REST APIs are used with devices that support RESTCONF.
cURL
One example is the cURL3 utility that has been mentioned a few times in previous chapters. cURL is a veritable Swiss army knife of HTTP and File Transfer Protocol (FTP) operations. While not specifically built for interacting with REST application programming interfaces (APIs), it is fairly ubiquitous (at least on Unix-like platforms) and works well for testing REST functionality. Say, like with netconf-console, you wanted to get the capabilities from a device that supports RESTCONF. Remember that unlike NETCONF, RESTCONF doesn’t have a session in which a capabilities exchange is done. That is, there is no <hello> message. For a RESTCONF client to ascertain which modules are supported by a RESTCONF server, that server must support the ietf-yang-library (RFC 7895). Fetch the instance data from this module using the following cURL command with some sample output shown in Example 7-22:
$ curl -H 'Accept: application/yang-data+json' -u 'user:password'
https://192.168.10.48/restconf/data/ietf-yang-library:modules-state
Example 7-22 Excerpt of the ietf-yang-library Output Fetched Using cURL
{
  "ietf-yang-library:modules-state": {
    "module-set-id": "5d8861a42ef514753381d55ca1a32aae",
    "module": [
      {
        "name": "ATM-FORUM-TC-MIB",
        "revision": "",
        "schema": "https://192.168.10.48:443/restconf/tailf/modules/ATM-FORUM-TC-MIB",
        "namespace": "urn:ietf:params:xml:ns:yang:smiv2:ATM-FORUM-TC-MIB",
        "conformance-type": "import"
      },
      {
        "name": "ATM-MIB",
        "revision": "1998-10-19",
        "schema": "https://192.168.10.48:443/restconf/tailf/modules/ATM-MIB/1998-10-19",
        "namespace": "urn:ietf:params:xml:ns:yang:smiv2:ATM-MIB",
        "conformance-type": "implement"
      },
      {
...
By default, cURL does an HTTP GET operation to the target URL, so no additional action verb needs to be specified in order for you to fetch the ietf-yang-library’s module-states container. The -H argument tells cURL to add a custom header. In this case, you set the “Accept” header to be “application/yang-data+json” so that the RESTCONF server returns JSON output. The -u argument passes your username and password to the device. Finally, the URL points to the modules-state container defined in the module ietf-yang-library.
cURL allows you to test configuration changes through RESTCONF as well. For example, if you want to patch in a new interface description for GigabitEthernet2, create a file called intf.json with the structure shown in Example 7-23.
Example 7-23 Payload for Setting an Interface Description Using RESTCONF and cURL
{
  "ietf-interfaces:interfaces": {
    "interface": [
      {
        "name": "GigabitEthernet2",
        "description": "Set by cURL"
      }
    ]
  }
}
Then reference this file with the -d @intf.json notation on the cURL command line, as shown next:
$ curl -X PATCH -H 'Content-type: application/yang-data+json' -H 'Accept:
application/yang-data+json' -u 'user:password'
https://192.168.10.48/restconf/data/ietf-interfaces:interfaces -d @intf.json
The -X argument changes the HTTP verb from GET to PATCH, and the -d argument with @ tells cURL to load the contents of the PATCH body from the file named intf.json. The Content-type header is also added to let the server know that the content being provided for the patch is JSON-encoded YANG data.
While cURL is a very handy tool for testing RESTCONF, it is not a RESTCONF (or even a REST) tool by design. Note in the output of Example 7-24 that the JSON looks well-formatted. However, cURL simply returns the data how the server presents it. There is no inherent understanding of the content type. In fact, many people use cURL as a command-line way to download binary files because it preserves the source data. Therefore, when working with some RESTCONF servers, the cURL output may have to be post-processed in order to view the data in an easy-to-read way.
HTTPie
A command-line alternative to the cURL utility is HTTPie.4 Like cURL, HTTPie interacts with HTTP servers, but offers rich capabilities specifically geared toward RESTful services and APIs. For example, it understands JSON output, formats it in a sane manner, and color-codes the output for easier reading. Its command-line syntax is also a bit simpler when it comes to interacting with services like RESTCONF.
Considering the ietf-routing module once again, Example 7-24 shows the commands to pull a list of configured static routes using both cURL and HTTPie.
Example 7-24 Commands to Obtain Static Routes Using RESTCONF
$ curl -H 'Accept: application/yang-data+json' -u 'user:password'
https://192.168.10.48/restconf/data/ietf-routing:routing/routing-
instance=default/routing-protocols/routing-protocol=static,1

$ http -a 'user:password' https://192.168.10.48/restconf/data/ietf-
routing:routing/routing-instance=default/routing-protocols/routing-protocol=static,1
'Accept: application/yang-data+json'
The HTTPie command, though similar to the cURL command, more closely resembles how the HTTP request is structured on the wire, thus making it a bit more intuitive. Additionally, the output has color-coding enabled by default and “pretty-prints” JSON with easy-to-read indentation regardless of the format the server presents it in.
HTTPie follows the same HTTP-like request structure for performing other operations such as PATCH. To patch in a new interface description with HTTPie, use the following command:
$ http -a 'user:password' PATCH  https://192.168.10.48/restconf/data/
ietf-interfaces:interfaces
'Content-type: application/yang-data+json'  'Accept: application/yang-data+json'
< intf.json
While command-line tools like cURL and HTTPie are useful for testing RESTCONF concepts and visually inspecting data, as well as pushing simple configuration snippets manually or from shell scripts, what about extracting data from JSON structures that are returned? There are numerous text-processing tools like sed, awk, and grep that regular expression wizards can use to grab a single piece of data out of a large JSON blob, but that can be complex and error-prone. The jq5 utility presents a solution to this by natively understanding JSON structure. cURL and HTTPie output can be piped to jq to pinpoint specific elements in a JSON structure, perform transformations, construct custom objects, and so on.
For example, to extract only the next-hop-address value for the IPv4 default route in the static-route configuration output, pipe the data to jq and specify the path to the desired element. The command output is simply the next-hop address, or 192.168.10.1 in this case, as shown in Example 7-25.
Example 7-25 Filtering the RESTCONF JSON Results with jq
$ http -a 'user:password' https://192.168.10.48/restconf/data/ietf-
routing:routing/routing-instance=default/routing-protocols/routing-protocol=static,1
'Accept: application/yang-data+json' | jq '."ietf-routing:routing-protocol"."static-
routes"."ietf-ipv4-unicast-routing:ipv4"."route"[]
 | select(."destination-prefix" == "0.0.0.0/0")."next-hop"."next-hop-address"'
The jq command walks the JSON structure down into the static-routes list and selects the static-route object that has the destination-prefix value of 0.0.0.0/0. Then it extracts only the next-hop-address element value. More examples and a tutorial for jq are found at https://stedolan.github.io/jq/tutorial/.
Postman
Command-line tools are not the only way to interact and test out RESTCONF servers. A popular GUI tool for working with RESTful services and APIs is Postman6 (see Figure 7-8). Postman started out as a Google Chrome extension and is now a standalone application for macOS, Windows, and Linux.
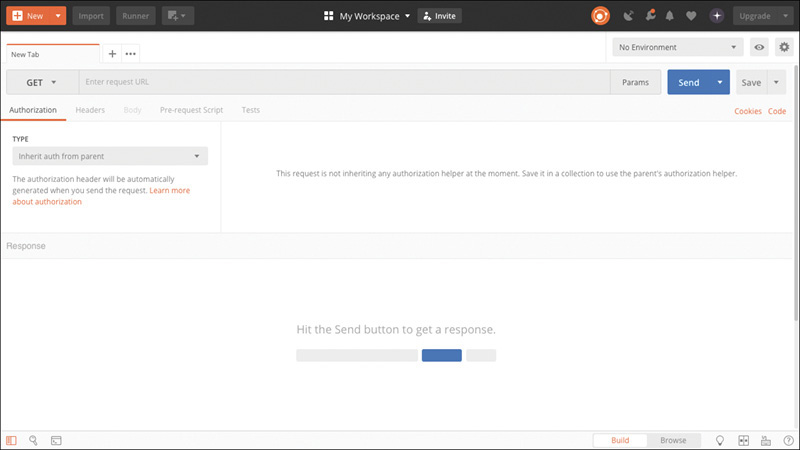
Figure 7-8 The Postman Main Screen
Under the covers, Postman interoperates with RESTCONF servers in much the same way as the command-line tools discussed previously. However, it also offers a number of nice features, not only to test out RESTCONF operations, but also to move from simple testing to more formal application-based automations.
Note
Since RESTCONF relies on Secure Hypertext Transfer Protocol (HTTPS), network elements need Secure Socket Layer (SSL) / Transport Layer Security (TLS) certificates. Unless you use a trusted Certificate Authority (CA) to sign these certificates, they will be self-signed and untrusted by default. In order for Postman to accept them, you need to go to Preferences and disable “SSL certificate verification.”
First, it includes a collections system whereby you can group a number of requests (for example, to demonstrate the API for an application) and bundle them together so that they are easily shared with other users. As you use it to explore different aspects of RESTCONF, begin to save your requests into collections. Even if you have no intention of sharing them, they are useful to review later on or test against new devices.
To create a collection, click on the Collections tab and then click the “New collection” widget. Fill in a name and an optional description and then move to the Authorization tab.
Another advantage of using collections is that you can specify common attributes to be used across the entire collection. Since there will be multiple requests, each needing to be authenticated to the device, you can create a collection-wide template for authentication here. However, since you likely do not want to store your username and password here—especially if you want to share this collection—consider using a variable. Postman variables are in the form of {{var_name}}—that is, the variable name is enclosed within double curly braces. Set the Type to Basic Auth and fill in {{restconf_username}} and {{restconf_password}} for Username and Password, respectively.
Before finalizing the new collection, go to the Variables tab. Here, you can add other common collection-wide variables. For example, remembering the MIME types for RESTCONF’s JSON and XML encoding can be tough. Therefore, adding variables for content_json and content_xml that point to application/yang-data+json and application/yang-data+xml, respectively, can prove useful.
Once the new collection is created, requests can be added to it. Before adding to a collection, it’s useful to create an environment to be used to expand some of the variables (such as {{restconf_username}}) for your Postman session. That is, the environment is unique to you and is not shared unless you choose to share the collection. Create a new environment by clicking the gear widget in the top-right corner of the Postman window (that is, the Manage Environments button). From here, add a new environment. Add variable definitions for “restconf_username” and “restconf_password” that point your RESTCONF server’s username and password, respectively. Also add definitions for “ip_addr” and “port” that point to your RESTCONF server’s IP address (or hostname) and port, respectively. Finally, adding a variable such as “restconf_accept” that points to one of the previously defined MIME type variables allows you to easily switch between JSON and XML encoding.
Add a new request to this collection that gets the list of static routes configured on the device. If this is your first request for the collection, click the “Add requests” link. Otherwise, duplicate an existing request. By default, the HTTP action used by Postman is GET, and that’s what you want here.
For the URL, fill in https://{{ip_addr}}:{{port}}/restconf/data/ietf-routing:routing/routing-instance=default/routing-protocols/routing-protocol=static,1. Note the use of the {{ip_addr}} and {{port}} variables previously defined in the Postman environment.
Next, go to the Headers tab and add a new header for Accept with the value {{restconf_accept}}. Once you start typing the braces to reference a variable, Postman attempts to auto-complete the variable name, which is nice if you forget exactly what you called the variable.
Finally, provide a name for this request within the collection, such as “Get Static Routes.”
Before the request is executed, you must select the environment to use such that all of the variables listed are properly dereferenced. The pull-down at the top right lists all of the configured environments within Postman. Select the environment you created previously for RESTCONF and then click the Send button to perform the request. As you need to test different devices, use different credentials, and so on, the environment variables can be changed without you needing to change the underlying request parameters, as shown in Figure 7-9.
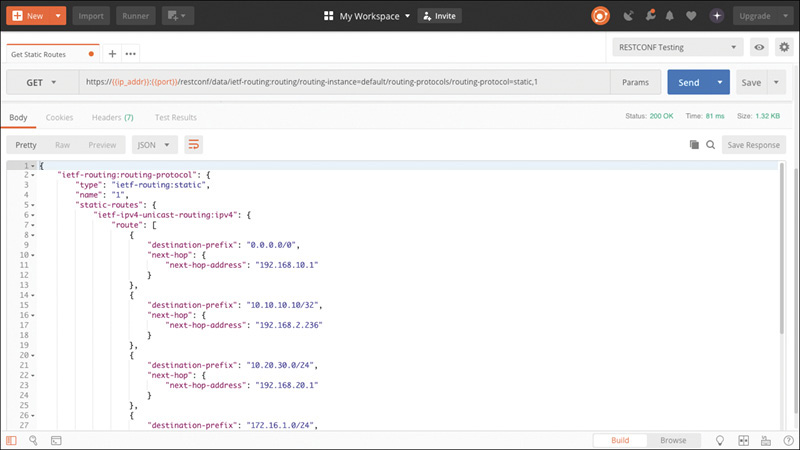
Figure 7-9 Postman Request for Static Routes via RESTCONF
Another very useful feature of Postman as you move from simply testing network elements with RESTCONF to beginning to develop scripts and applications is its code generation feature. Below the Send button is a Code link. This link opens a new window that shows the current request embedded into a number of different programming languages, as shown in Figure 7-10. For example, if you’re looking to move from testing requests in Postman to a Python-based script, generate a starter script by selecting the desired Python library from the pull-down. While there is much more work to do (for example, you have to handle Postman variable expansions yourself, add error checking, and so on), this approach may be easier than developing a new script from a blank page.
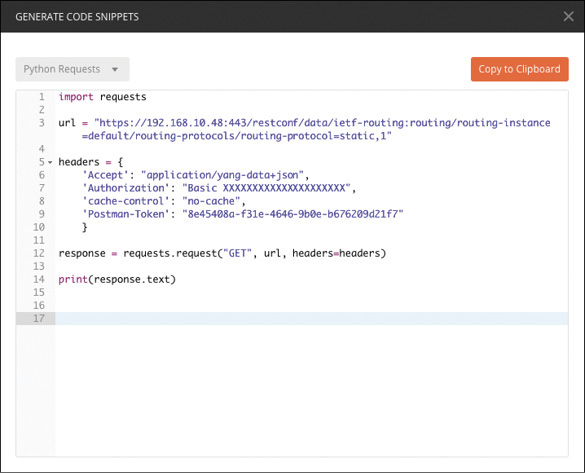
Figure 7-10 Postman’s Python Code Generation
Libraries that are useful for programming network elements using YANG-based protocols are explored in more detail in Chapter 8, “Automation Is as Good as the Data Models, Their Related Metadata and the Tools: For the Module Author.”
Telemetry Tools
The NETCONF and RESTCONF tools shown thus far work well for pushing configuration and querying devices for operational data, but what about consuming model-driven, streaming telemetry from devices? Model-driven telemetry provides tremendous value, as it allows devices to push data to your management servers in order to assure network and service functionality. While you could continue to poll for this type of operational data, telemetry producers publish data only when it changes. Not only does this reduce network traffic, it allows a network administrator to be aware of the operational state of the network in real time, thus assuring network changes are always properly applied. As such, being able to consume and visualize telemetry data is extremely useful. The tooling for model-driven telemetry is still nascent, partially because the work to define and standardize how data is streamed and encoded is still underway. That said, some open source tools for telemetry consumption are starting to emerge.
Pipeline
Cisco contributed a tool called Pipeline7 (or Big Muddy Pipeline) to the open source community. Currently, Pipeline is geared toward consuming model-driven telemetry streams from Cisco IOS-XR and NX-OS devices. Pipeline takes these streams and sends then to other tools, such as a time-series database like InfluxDB8 or Prometheus9 and a data analytics tool like PNDA.10 This means Pipeline acts as a broker, allowing you to configure one set of telemetry exports and then plug in additional consumers on top of Pipeline.
Assuming you identified a set of key next-hop interfaces on your router that you want to monitor, you can build a telemetry graphing solution for router interface statistics (including bytes and packets transmitted and received, errors, and so on) using Pipeline, InfluxDB, and Grafana. First, clone Pipeline’s GitHub repository, like so:
$ git clone https://github.com/cisco/bigmuddy-network-telemetry-pipeline.git
Pipeline stores its consumption and output sink configuration in the pipeline.conf file. By default, Pipeline consumes streaming telemetry sent over TCP to port 5432. This is defined in the base “testbed” configuration section shown in Example 7-26.
Example 7-26 The pipeline.conf Contents for Handling a Telemetry Stream
[testbed]
stage = xport_input
type = tcp
encap = st
listen = :5432
Download and install InfluxDB from https://portal.influxdata.com/downloads. The pre-built packages make it much easier to get started. Additionally, the documentation at https://github.com/influxdata/influxdb provides a quick way to create a test database and generate some sample queries.
Create an InfluxDB called “mdtdb” to hold your model-driven telemetry streams that Pipeline sends, as shown next:
$ curl -XPOST "http://localhost:8086/query" --data-urlencode "q=CREATE DATABASE mdtdb"
Now that InfluxDB is running, configure Pipeline to send the data it receives from your router to your Influx instance. Edit pipeline.conf and add the section shown in Example 7-27.
Example 7-27 The pipeline.conf Contents for Pushing Data to InfluxDB
[influxdb]
stage = xport_output
type = metrics
file = metrics.json
output = influx
influx = http://localhost:8086
database = mdtdb
Pipeline take the data it receives from xport_input (the input streams) and pushes it to the InfluxDB listening on TCP 8086. The metrics.json file included with Pipeline specifies the structure of the data so that it is properly inserted into external consumers like InfluxDB.
Install Grafana on your desired platform using the documentation at http://docs.grafana.org/installation/. Once Grafana is installed, add a new data source for InfluxDB. Next, create a new Grafana dashboard that contains the graphs for things like interface throughput. A set of sample queries for bytes sent is shown in Figure 7-11.
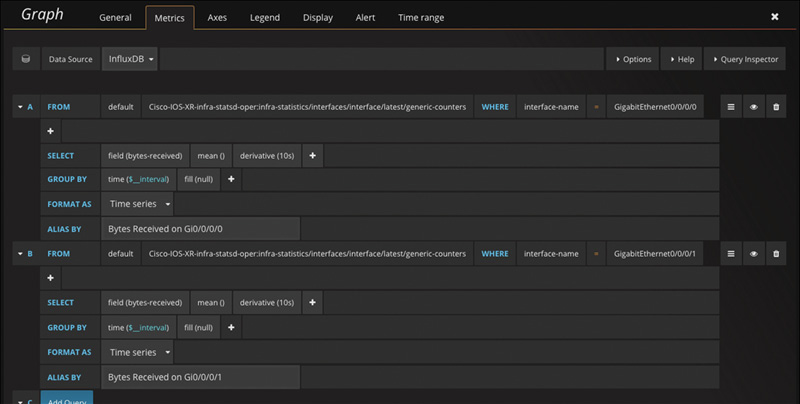
Figure 7-11 Grafana Queries to Extract Telemetry Data Stored in InfluxDB
Sample graphs showing the results of the telemetry “pipeline” are shown in Figure 7-12.
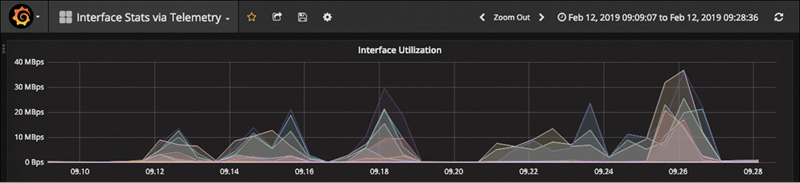
Figure 7-12 Grafana Graphs of Telemetry Data Streams
Advanced NETCONF Explorer
Another useful open source tool for getting to know streaming telemetry is Advanced NETCONF Explorer (ANX).11 ANX, like YANG Suite, connects to network devices, pulls down the YANG modules that the devices support, and allows you to configure telemetry subscriptions and receive the resulting streams, as shown in Figure 7-13. ANX is containerized using Docker and Docker-compose. The instructions for starting it are found on its GitHub project page. Once installed and running, ANX presents a web-based interface, allowing you to enter a device IP or name and its credentials. Then it collects all of the modules from the device and constructs a YANG tree specific to that device.
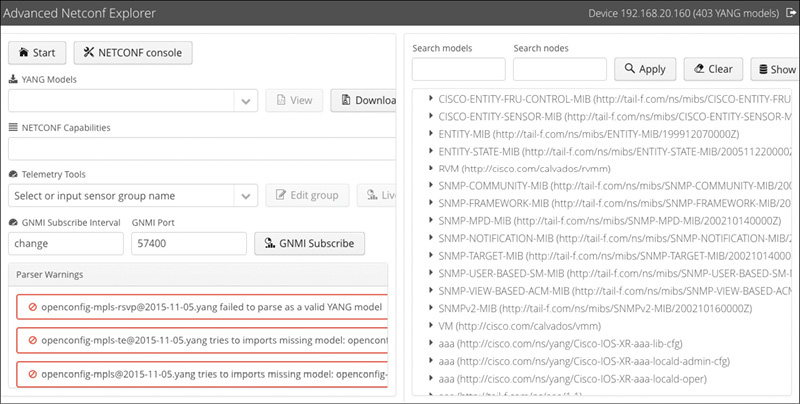
Figure 7-13 Advanced NETCONF Explorer
From the right-hand side, you can browse and search the module tree for the given device. When you click a node in the tree, the pane on the left-hand side updates to provide various parameters about the node and the module that contains it. One such parameter is Telemetry Path. This path is used to subscribe to telemetry streams from the device.
With routing configuration and state on the mind, create a telemetry feed within ANX that shows live routing changes. In the Telemetry Tools field in ANX, give your telemetry sensor group a name and then click the “Edit group” button. Add some routing node telemetry paths to the group. If your device supports the openconfig-network-instance module, this module provides a set of operational data nodes that deliver insight into the device’s routing state. Figure 7-14 shows the sensor group editor window after a sensor path was added.
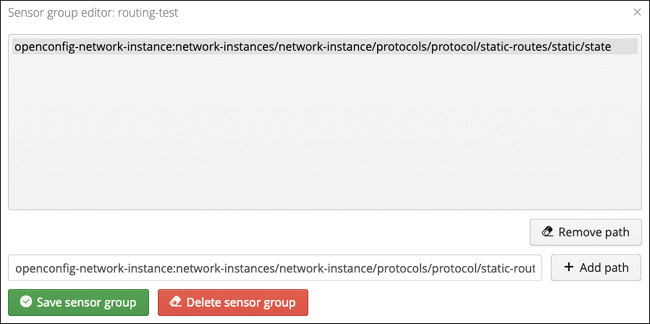
Figure 7-14 ANX Telemetry Group Configuration
Back at the main ANX screen, click the “Live data” button to begin receiving telemetry streams for your telemetry group. Depending on the types of streams the device supports, ANX may receive periodic pushes of data or data only when something changes (for example, a new route is added). Figure 7-15 shows ANX receiving and displaying telemetry updates after it programmed the network element.
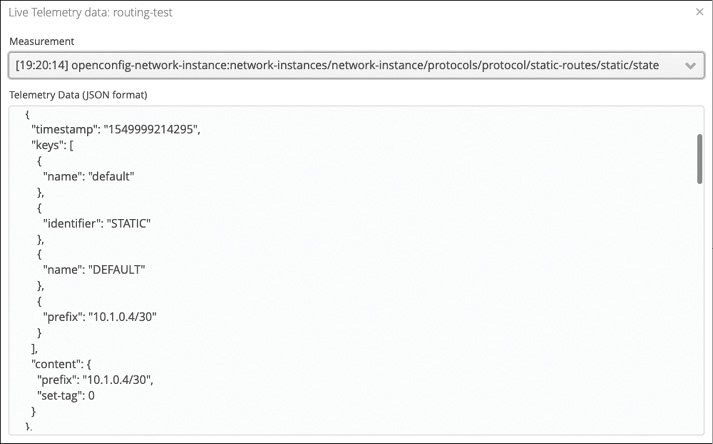
Figure 7-15 ANX Telemetry Stream Messages
Pipeline and ANX provide a good way to begin to receive, process, and understand the value of streaming model-driven telemetry. As the telemetry standards mature and more platforms start to export telemetry streams, expect the tooling around telemetry to continue to evolve and improve as well.
Commercial Products
The tools explored for interacting with network elements are only some of the ones available. These are freely available as open source tools. There are other commercially available tools that integrate into a more end-to-end automation architecture.
Cisco offers one such tool called Network Services Orchestrator (NSO).12 NSO allows you to build templates to automate the provisioning of single-device and entire network-level services. These templates are rendered as YANG models, and NSO acts as a NETCONF such that once a service is defined (in terms of its YANG schema) it is provisioned either through a single web interface or programmatically via NETCONF or RESTCONF. NSO then handles interacting directly with the network elements that make up the service. This means that it controls locking, backing out a configuration if errors are encountered, and maintaining the service-wide configuration across the entire network. While it use NETCONF to communicate with the underlying network elements if they support it, it can also fall back to legacy protocols like CLI over SSH. NSO, therefore, provides a service-level abstraction over the network to simplify service delivery.
Cisco distributes a free evaluation of NSO for non-production purposes from its DevNet site.13 The evaluation is available for Linux and macOS, and it’s the full NSO distribution with the exception that the number and functionality of network element drivers (NEDs) are limited. Additionally, the NSO evaluation does not support streaming telemetry. Figure 7-16 shows NSO displaying a service topology based on what was discovered from the configuration of the network elements within its inventory.
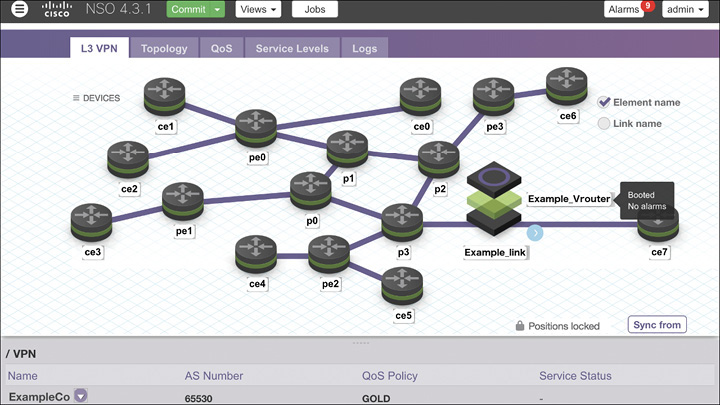
Figure 7-16 Cisco NSO’s Web Interface
Building on the YANG model–based capabilities of NSO is Itential Automation Platform14 from Itential. Itential Automation Platform provides a number of functions for service, policy, and configuration management. Itential Automation Platform provides another layer of service composition on top of the YANG models NSO exposes. In this manner, you can graphically draw out the service components, their interactions, and the overall user workflows, and then use NSO to provision the service. Once services and workflows are designed, they are grouped together as part of a service catalog, thus making it easier for IT administrators to choose the service they want and the type of workflow (such as provision or modify) and then execute the tasks across the entire network. Just as NSO offers a programmatic NETCONF and RESTCONF interface, Itential Automation Platform provides REST APIs to its underlying business logic components for northbound application integration. Figure 7-17 shows Itential Automation Platform workflow design center canvas.

Figure 7-17 Itential Automation Platform Workflow Builder
Interview with the Experts
Q&A with Einar Nilsen-Nygaard
Einar Nilsen-Nygaard is a principal engineer working in Cisco’s Enterprise Networking group as the software architect for model-driven programmability and management across Cisco’s core operating systems. In that role he works with an extended team of engineers across the various operating systems and platforms to deliver Cisco’s device layer data models and APIs. He previously worked on element and network management software, policy-driven edge access, and deep packet inspection and flow-based data plane programming. Einar is involved in promoting the visibility of YANG across the industry by maintaining the multivendor, multi-SDO repository at https://github.com/YangModels/yang; working with Cisco platform teams to publish their models publicly; and developing tools such as ncc (based on the ncclient library), xym, and extensions to pyang. He provides feedback and guidance to working groups at the IETF on model development, and works extensively with software developers and network engineers to educate them on the benefits that model-based interfaces can bring to their day-to-day operations and to their software.
Question:
Einar, from your perspective as a YANG tool developer and data model contributor and advocate, what have you seen in terms of tool evolution, what have you learned from this, and where are we headed with respect to YANG tooling?
Answer:
What I’ve seen the most is that our industry at the moment still has an awful lot of inertia behind CLI-oriented ways of interacting with devices. One of the hardest things is moving people away from that focus and embracing a way of thinking that’s first about data models versus anything else so that they’re thinking about automation at the device level as a primary task rather than something that’s nice to have. In the past, there was a struggle within the whole industry in the network management space to get Simple Network Management Protocol (SNMP) Management Information Bases (MIBs) in order to monitor or manage network elements and features. With YANG-based models, however, it will be easier for vendors to support rather than SNMP. End users, as well, will see YANG-based interfaces easier to adopt than SNMP-based interfaces.
That said, the current maturity of tooling for YANG is not particularly good across the industry in ways that make the benefits easily accessible to people who are not experts or developers. If you go back and read RFC 3535, which sets out the goals behind NETCONF and YANG, you can see a lot of stuff in there where we talk about making things easier for the end user, making it easier to develop, and making it more human readable. Some of these goals have stood the test of time, but you have to question things like making it appropriate for a human user. Is that still a goal with YANG models? We’re kind of skipping beyond trying to make these interfaces appropriate for humans and focusing on making them appropriate for machine consumption. Therefore, the same requirements for readability and things of that nature don’t really apply if your primary consumer is going to be a machine.
To put a counterpoint to that, why do we spend so much time developing tools like YANG Suite, Advanced NETCONF Explorer, and pyang with the “-f tree” argument? Why do we do that? We do that because there is still this gap between where our users are today and where the software that needs to consume these YANG models actually is—and that gap still needs to be bridged by humans. So, there is still a necessity to present YANG models in a way that humans can understand. That leads to the rise of these tools that let users visually get to grips with the model and visualize the structure and hierarchy within the models. This is why a lot of people are putting a lot of effort into tooling. Without this effort, we will have a hard time making use of the models that vendors release.
Question:
Why do you think that YANG and YANG-based protocols will be easier to adopt than SNMP?
Answer:
I think that the tooling we’re developing around YANG models makes it easier to visualize what a YANG model is about. And the way we name things, the way we index things; we look at things more from a natural perspective that users are used to. For example, compare the IF-MIB to the ietf-interfaces YANG module. You have exactly the same information in both when it comes to semantics. However, when you look at the IF-MIB, you’re presented with this thing called the “ifIndex,” which is effectively a random number generated by the underlying platform. When you get back a set of data—say, from an SNMP GET-BULK request—you and the machine cannot make immediate sense of what the data is in relation to a specific interface without doing a measure of post-processing on that data. With SNMP, you get back these long strings of numbers in an object identifier (and maybe back in the day, I could decode these just by looking at packets), which adds burden to administrators and tooling to make sense of the data. This made sense at the time it was developed given the technology and the constraints. But today we’re looking to transition the network engineer—who has been used to constructs that have logical names like “Ethernet1/0”—to think in more automation-centric terms. And this is the naming typically found across YANG models. While it is certainly more efficient to encode data as an integer than a string, the trade-off is the added complexity incurred in performing the mapping. As network speeds and feeds have increased, the balance has tilted to favoring the more natural naming to make it easier for developers to build software and users to consume the data. Sometimes, performance benefits at the software level are not worth the lack of understanding they create at the human level.
Question:
Where do you see the biggest gap in terms of tooling that can help promote more of this data model adoption?
Answer:
Unfortunately, that’s a really easy one to answer (a slight laugh). It’s easy to answer in terms of what the problem is, but more difficult to answer in terms of the solution. Right now, we have a community of software developers and network engineers that are familiar with CLI and SNMP. This community needs to have a way to move forward from where they are today to a place where they can consume some of the newer YANG-based interfaces—be it with NETCONF, RESTCONF, model-based telemetry, you name it. The question we continue to get back from many, many internal and external sources is, “Okay, I’m polling this SNMP MIB today. I want to use telemetry tomorrow. What telemetry paths do I use to get the same data?” Then there’s an uncomfortable silence as we try to figure out how in the heck do we actually do this? How do we move people forward? There isn’t always a direct correlation between CLI output and SNMP MIBs to YANG model paths. While standards-based modules exist, they are not always complete when it comes to specific vendor features and platforms. Therefore, some vendors have gone to creating their own modules, specifically around operational data, that mirror how the data is stored within the platform. These are sometimes called “native models.” They do not always have a one-to-one correspondence with SNMP MIBs or CLI command output fields. However, they are more aligned to the natural structure of the data any engineer familiar with the platform’s implementation would expect. As such, they tend to perform better than using SNMP or executing CLI commands to gather the data. They may perform better than using standards-based YANG models, as no internal mapping is required. However, being faster or even easier to consume does not make up for the fact that you cannot map from what you’re using today to these new models.
There isn’t a magic answer to this. Some vendors are tackling this with CLI hooks on their platforms to provide mapping where it is known. Others are looking to develop external tooling to attempt to document and even crowd-source this knowledge. But this is the biggest challenge in tooling we face today in terms of adoption.
Question:
Today we hear a lot about software-defined, intent-based, controller-driven (and so on) networks. The common theme seems to be a layer of abstraction above the network device. This layer of abstraction can front-end programmatic instructions, and then use whatever device-level interface is available. How much are these model-driven paradigms going to matter if there is an abstraction between the network and the applications automating the network?
Answer:
This question gets asked a lot, and unfortunately there’s not one good answer. As an industry, the devices we provide are consumed by a lot of different people with different levels of expertise and a lot of different abilities and willingness to engage at the device layer versus the controller layer versus “I just want a pre-packaged application I can use that does some stuff for me.” Clearly, the vast majority of users are in the “pre-packaged application” camp. But how is the software they use going to be developed? Who is going to maintain what I’ll call the “legacy” ways of interacting with devices? Who is going to invest in the infrastructure required to allow those pre-packaged applications to be developed? Speaking as a vendor who develops both pre-packaged applications as well as device-layer interfaces, the cost of maintaining software that uses those legacy interfaces is huge. What we’re introducing with model-based interfaces lets devices become more self-describing, and they can tell a software developer, “This is the data I provide. This is the format I provide it in. Here are the things I don’t actually do. Here are the RPCs you can invoke against me to do useful things.” The value of that to vendors developing controllers—or pre-packaged applications on top of controllers—is huge.
There is also a large number of end users who roll their own operational support system (OSS) or controller layer. For those users who are building their own layer, they view dealing with legacy interfaces as a tax—as a vendor tax. They want the vendors to provide a good, well-structured management plane that is easy to integrate into their systems. No matter where you push the abstraction to deal with the legacy interfaces (be it a controller, a micro-service that does the mediation, or whatever), that tax will always be present. What we have seen, especially with larger, web-scale customers, is that they push back when we offer features without a model interface. To them, the stance is, if your feature doesn’t have a model-based interface, then that feature doesn’t exist for us—no model, no feature. The customers are driving model-based interfaces and interfaces to be first class. Even the coolest vendor doohickey will be ignored if it cannot be automated.
Summary
This chapter explored a number of YANG-centric tools for module exploration and understanding, interacting with devices to discover their capabilities and test simple automations, and testing and validating your new YANG modules. As important as the tools and the modules themselves are, the metadata associated with each module is vital for understanding how and where to use a module, how that module evolved, and how the module is supported in your devices.
YANG module tooling and the ability to consume module metadata do not stop with what was covered in this chapter. As discussed, there are other, commercially available tools that unlock the power of network device and service automation. Additionally, there are tools that aid with module writing and testing, and there are rich APIs and software development kits (SDKs) that enable you to create your own applications that can take advantage of model-based management, as well as consume module metadata as part of the application flow. Tools for module authors are discussed next in Chapter 8, and some of the programmatic aspects for application developers are covered in Chapter 9.
Endnotes
5. https://stedolan.github.io/jq/
6. https://www.getpostman.com/
7. https://github.com/cisco/bigmuddy-network-telemetry-pipeline
8. https://portal.influxdata.com/
11. https://github.com/cisco-ie/anx
12. https://www.cisco.com/c/en/us/solutions/service-provider/solutions-cloud-providers/network-services-orchestrator-solutions.html