Chapter 5. Telemetry Explained
This chapter covers
The different telemetry-related terms
The need to move away from Simple Network Management Protocol (SNMP)
The telemetry components and how all the different building blocks fit together
An overview of IETF’s YANG Push and the OpenConfig streaming telemetry
Some help on selecting your telemetry mechanism
Introduction
This chapter describes the concepts and architecture behind data model–driven telemetry. Reading through this chapter, you might perceive an unmistakable air of “under construction” to this topic—and you would be right, as telemetry keeps evolving in the industry. This chapter covers the state of the art of telemetry and provides some pointers.
Data Model–Driven Telemetry
Telemetry, as a generic term, is the science or process of telemetering data, where telemetering is the act of measuring a quantity (such as pressure, speed, or temperature) and transmitting the result, especially by radio, to a distant station. In the networking world, telemetry is an automated communications process by which measurements and other data are collected at remote or inaccessible points and transmitted to receiving equipment for monitoring. Typical networking examples are SNMP notifications, NetFlow (RFC 3954) and IP Flow Information eXport (RFC 7011) records, and syslog messages. Telemetry is not new in this industry, although data model–driven telemetry certainly is. SNMP notifications, NetFlow, and even syslog messages have existed for decades.
At times when networks grow bigger and more complex, and therefore generate more and more monitoring data from physical and virtual entities, network management requires telemetry. Telemetry helps stream data out of the network faster, enabling the streaming of large amounts of data in real time or close to real time.
Chapter 1, “The Network Management World Must Change: Why Should You Care?”, justified why data model–driven telemetry is the most useful type of telemetry in this world that required automation. Note that this book focuses on the following telemetry definition.
While the exact term is data model–driven telemetry, this book uses the term “telemetry,” also known as “model-driven telemetry” for short, and “streaming telemetry.” Indeed, Chapter 2, “Data Model–Driven Management,” made the case that efficient automation is based on data models.
For most operations engineers, telemetry refers to the streaming of monitoring data, helping network monitoring and troubleshooting. Note that telemetry might also contain the information about the applied configuration, especially when used with non-fully transactional protocols, such as RESTCONF and gRPC. Combining the two pieces of information (monitoring and configuration) is the basis for automation and for intent-based networking (that is, creating the feedback that enables constant learning and adapting; refer to the “Intent-Based Networking” section in Chapter 1). This type of telemetry could be called “operational telemetry” (even if nobody uses that term in the industry) as opposed to business telemetry.
Business telemetry, a clarifying term, is the use of telemetry to stream information to help business developments. For example, how is the network inventory in terms of hardware, software, and licenses related to each customer? Knowing this inventory certainly helps the vendor sales teams, on top of knowing how customers use your specific functionality and service (what is enabled and how?). There is also a great advantage for the support teams, who could proactively warn of potential defects, thus reducing in parallel the support costs. Business developers, (senior) vice presidents, and top execs speak of telemetry, but they actually mean business telemetry. Some could argue that any telemetry fulfills a business purpose in the end; hence the “business” prefix in “business telemetry” is not necessary and even confusing. However, the term business telemetry helps to make a clear distinction of the audience in telemetry discussions.
For sure, (operational) telemetry and business telemetry meet somewhere, as some of the streamed data might be overlapping or even identical—similar data, but different usage. For example, streaming telemetry to troubleshoot a network issue requires a data manifest to understand where the information comes from and how to interpret it. Typically, the data manifest consists of device or network inventory, software version, enabled features, licensing information, and so on. Exactly like a Technical Assistance Center (TAC) engineer consistently requires the output of “show technical support” to start investigating a case, telemetry requires the data manifest to interpret the data. Getting some counters information without context is not terribly useful. What is interesting is that a different audience (in this case, business developers) would benefit from almost the exact same information to ensure that customers have the right set of products for their business outcome—jumping at the opportunity to sell some more, obviously.
Moving Away from SNMP to Telemetry
Forgetting for a moment the fundamental argument that a single data model for both configuration and monitoring is required, which alone justifies the move away from SNMP notifications to (YANG-based) telemetry, let’s cover a couple of extra reasons why SNMP (notifications) is not efficient.
As Shelly Cadora mentioned in her blog [https://blogs.cisco.com/sp/the-limits-of-snmp],1 to retrieve large amounts of data, SNMP polling relies on the GetBulk operation. Introduced in SNMPv2, GetBulk performs a continuous GetNext operation that retrieves all the columns of a given table (for example, statistics for all interfaces). When polled, a router returns as many columns as can fit into a packet. After the first GetBulk packet is filled up, the SNMP agent on the router continues its lexicographical walk and fills up another packet. When the poller detects that the router “walked off the table” (by sending Object Identifiers [OIDs] that belong to the next table), it stops sending GetBulk operations. For very large tables, this could take a lot of requests, and the router must process each one as it arrives.
This situation is bad enough if you have a single network management system (NMS) polling, but what if you have multiple NMS’s polling? Obviously, since polling is not synchronized between the different NMS’s, the router must process each request independently, finding the requested place in the lexical tree and doing the walk, even if both SNMP pollers requested the same Management Information Base (MIB) objects at more or less the same time. Many network operators know this empirically: The more SNMP pollers you have, the slower the SNMP response. One operator mentioned to me up to 200 NMS’s were polling his network, most of them polling similar information from the interface table: a terrible situation that stems from a mix of different NMS’s focusing on different technologies, different departments having their own NMS, a mix of mergers and acquisitions, or simply the fear of breaking something by touching a legacy NMS. Telemetry gains efficiency over SNMP by eliminating the polling process altogether. Instead of sending requests with specific instructions that the router must process each and every time, telemetry uses a configured policy to know what data to collect, how often, and to whom to send it. Telemetry using the compact Google Protocol Buffer (GPB) encoding is way more efficient from an encoding viewpoint compared to SNMP: All the interface statistics fit into a single GPB telemetry packet, whereas multiple SNMP packets are required to export the same information. Bandwidth reduction is great, but the real benefit is actually somewhere else: The router does a single dip into the internal data structures to acquire the data, as opposed to multiple times when answering a polling request. If there are multiple interested receivers, the router can just duplicate the packet for different destinations—a very trivial task for a router. Therefore, sending telemetry to one receiver has the same latency and overhead as sending it to five.
Polling is not the only a computational burden that SNMP imposes on a router. An equally significant performance factor is how data is ordered and exported. SNMP imposes a very tight model when it comes to indexing and exporting. Take the example of the SNMP interface table (ifTable, RFC 2863), as displayed in Table 5-1. Each column of the table represents a different parameter for a given interface, indexed by the ifIndex, the unique identifier for the interface.
Table 5-1 Some Entries in the SNMP Interface Table
ifIndex |
ifDescr |
ifType |
ifMTU |
ifSpeed |
|---|---|---|---|---|
3 |
GigabitEthernet0 |
6 |
1514 |
1000000000 |
4 |
GigabitEthernet1 |
6 |
1514 |
1000000000 |
5 |
Loopback0 |
24 |
1500 |
0 |
The strict semantics of the GetNext/GetBulk operations force the router to traverse the table, column by column (returning the list of ifIndex, followed by a list of ifDescr, ifType, and so on), from lowest index value to highest. From a router’s perspective, this doesn’t fit the internal data representation. Therefore, the router must reorder the data into a table and walk the columns to fulfill the GetBulk request. Obviously, both SNMP polling and SNMP notifications suffer from the same drawback.
Polling the interface table entails this “reordering” extra load on the router, obviously multiplied by the number of pollers, if multiple pollers require the same information. A different example, suffering from the same reordering issue, well known to operators is polling the routing table. It brings a router to its knees or at least takes a very long time (depending on the relative priority of the SNMP process). Polling the entire Border Gateway Protocol (BGP) table 15 years ago, when it contained about 1,000 entries, took about 30 minutes. These days, the BGP routing table contains almost 800,000 routes [https://bgp.potaroo.net/].2 Do the math!
How much better it would be if we could just free the router to present its data in the natural order! Well, that’s exactly what telemetry does. Telemetry collects data using the internal bulk data collection mechanisms, does some minimal processing to filter and translate the internal structure to a Google Protocol Buffer, and then pushes the whole thing to the collector at the configured intervals. The goal is to minimize processing overhead at every step, so you get the fastest, freshest data possible with the least amount of work.
Finally, telemetry offers yet another advantage compared to SNMP polling: a consistent observation time. Typically, NMS’s poll devices on a regular basis, called the SNMP polling interval. Operators usually poll the interface counters every 5 or 30 minutes, to graph the usage evolution for capacity planning. Fine, but SNMP polling for troubleshooting purposes requires precise observation time. For example, let’s try to correlate counters from multiple MIB tables (for example, interface, quality of service, and flow). When SNMP pollers request those three tables via SNMP, the requests are processed at different times on the router due to transmission delays, potential retransmissions, reordering extra processing, or simply different NMS’s not synchronizing their polling times. Therefore, the counters are observed at different times, thus impeding correlation. On top of that, SNMP is based on User Datagram Protocol (UDP) and polling cycles may be missed, so packets may get lost, often when the network is under stress and the need for the data is the greatest. With telemetry, operators subscribe to the three tables directly on the agent, and the polling is internal to the agent, thus minimizing this negative timing effect.
Note that SNMP pollers always keep on polling. In the meantime, data might become irrelevant. So, combining two telemetry aspects—the periodic subscriptions with some event-driven telemetry, where telemetry is triggered by a specific change—eliminates or reduces this problem drastically. See the notion of two types of subscriptions—periodic and on-change—later on in this chapter.
So, you are now convinced that you need to move away from SNMP. How do you upgrade to model-driven telemetry? The first step is to convert your SNMP notifications to telemetry. The YANG Catalog search engine [https://www.yangcatalog.org/yang-search/]3 helps you find the right YANG objects. For example, the interface configuration and operation information is available in the ietf-interfaces [https://www.yangcatalog.org/yang-search/module_details/?module=ietf-interfaces]4 and openconfig-interfaces [https://www.yangcatalog.org/yang-search/module_details/?module=openconfig-interfaces]5 YANG modules. A couple of us are working on a Telemetry Data Mapper tool that directly maps MIB module OIDs to YANG objects. For example, for ifIndex, ifAdminStatus, and ifOperStatus and the MIB variables in the linkDown and linkUp SNMP notifications (RFC 2863), the tool returns what is illustrated in Figure 5-1.
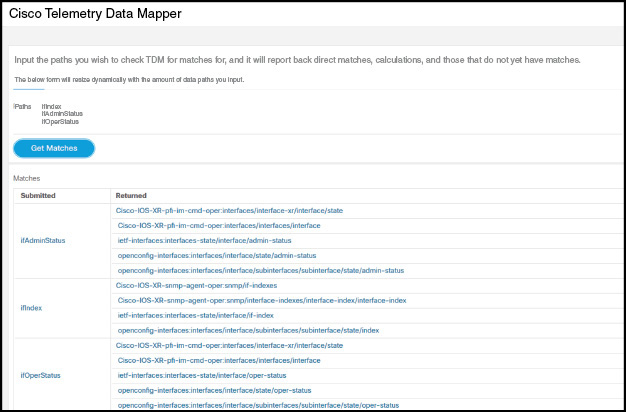
Figure 5-1 ifIndex, ifAdminStatus, and ifOperStatus MIB Objects Mapping to Operational YANG Objects
The goal behind this tool is to map MIB OIDs to operational YANG objects, for telemetry.
The mappings for the configuration objects might be slightly different. For example, the ifAdminStatus configuration objects are as follows:
openconfig-interfaces:interfaces/interface/config/enable
openconfig-interfaces:interfaces/interface/subinterfaces/subinterface/config/enable
ietf-interfaces:interfaces/interface/enabled
Cisco-IOS-XR-ifmgr-cfg:interface-configuration/interface-configuration/shutdown
For systems that don’t yet support the Network Management Datastore Architecture (NMDA; see Chapter 3, “YANG Explained”), the ietf-interfaces (RFC 7223) ifAdminStatus configuration maps to ietf-interfaces:interfaces/interface/enabled.
For modern systems supporting NMDA with the ietf-interfaces (RFC 8343, which updates RFC 7223 with NMDA support), the ifAdminStatus configuration maps to the same object for the :startup, :candidate, :running, and :intended datastores.
The plan is to integrate the Telemetry Data Mapper with the YANG Catalog set of tools. In the meantime, the GitHub repository with the code is located at https://github.com/cisco-ie/tdm.6
Telemetry Use Cases
Streaming telemetry provides a mechanism to select data of interest from publishers and to transmit it in a structured format to remote management stations for monitoring. This mechanism enables automatic tuning of the network based on real-time data, which is crucial for its seamless operation. The finer granularity and higher frequency of data available through telemetry enables better performance monitoring and, therefore, better troubleshooting. It helps with more service-efficient bandwidth utilization, link utilization, risk assessment and control, remote monitoring, and scalability. Streaming telemetry thus converts the monitoring process into a data analytic proposition that enables the rapid extraction and analysis of massive data sets to improve decision-making.
Telemetry lets users direct data to a configured receiver/collector. This is achieved by leveraging the capabilities of machine-to-machine communication. The data is used by development and operations (DevOps) personnel who plan to optimize networks by collecting network analytics in real time, locate where problems occur, and investigate issues in a collaborative manner.
There are many use cases around telemetry, some of which are listed here:
Network state indicators, network statistics, and critical infrastructure information are exposed to the application layer, where they are used to enhance operational performance and to reduce troubleshooting time (for example, streaming all information about the health of devices).
Real-time reports on a portion of the operational state (and sometimes applied configuration) are desired. Multiple operations groups care about the status of overlapping objects in a device. One operations group owning a device does not want to give full access to the device—just a read-only feed to an NMS with read-only type credentials. Another example is any relevant operations/config updates directly pushed to a tenant, or a service provider providing a separate network function virtualization for an enterprise.
Quickly replicating the network current, for post-processing (for example, streaming the network topology, routing information, configuration, interface stats, core traffic matrix, and so on for network simulation and optimization).
Telemetry as a feedback loop mechanism, such as directing a flow down an alternate path based on changing network conditions received via telemetry (for example, changes in operational performance data driving network rebalancing for optimized facilities usage).
Conditional telemetry, where you establish a push connection and forward targeted telemetry data to a targeted recipient when certain criteria are met. As an example, only send packet drop counters info when a different interface is down. This might require on-change telemetry (discussed later in the chapter).
Peer misconfiguration, where you monitor the configuration of adjacent network elements to see if common parameters are set the same on either side.
When describing telemetry use cases, it’s important to understand that, in the end, telemetry is a protocol (that is, it’s a means to an end for applications that benefit from the deep knowledge that telemetry delivers). In other words, the value is not in the telemetry protocol itself or even in data models, but in the information streamed and in the data analytics based on this information.
Telemetry Components
The section covers the telemetry architecture, the notion of events in telemetry, as well as the two dial telemetry modes.
Architecture
From a multilayer point of view, the telemetry architecture is similar to the management architecture (refer to Figure 2-3 in Chapter 2), as displayed in Figure 5-2.
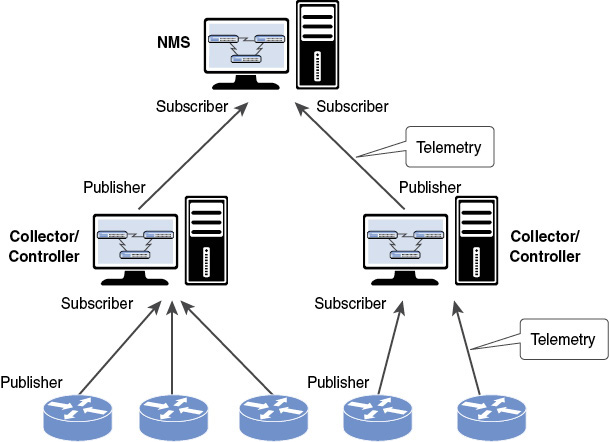
Figure 5-2 Telemetry Architecture
Network elements (whether physical or virtual) stream telemetry information from the publishers to the collector, sometimes called the telemetry receiver. This information is integrated in the collector (sometimes co-located with a controller), which summarizes it, correlates it, and aggregates it. The aggregation can occur in time (that is, in time series) or in a space (that is, from multiple publishers in different locations in the network). Finally, the collector forwards the collected/correlated/aggregated telemetry to the NMS. Considering the huge of amount telemetry pushed, at potentially high frequency, from multiple publishers, this is a key process in the collector/controller.
Obviously with model-driven telemetry, the source of information is the series of YANG objects. Having the same data language as the source of information facilitates the correlation, aggregation, and data analytics, as mentioned in Chapter 1’s “The Challenges of Managing Networks with Different Data Models” section (where you were introduced to the challenges of managing a simple concept such as the interface using different data model languages). However, the reality in the industry is that not all sources of information are “YANGified” at this point in time. In some situations, YANGifying all information in devices is not even worthwhile—YANG doesn’t require re-engineering everything in the world! As an example, one of the telemetry use cases mentions the core traffic matrix, which is typically computed out of NetFlow (or IPFIX) flow records. Practically speaking, in this case, the collector would receive NetFlow/IPFIX flow records from multiple key locations in the network and generate the core traffic matrix, potentially complemented with telemetry data. From there, creating a YANG module modeled after the core traffic matrix is a relatively easy job, and the collector could advertise it before pushing its content via telemetry. If YANG objects, along with non-YANG objects, must be streamed (for example, to complement the YANG-based telemetry) from a single telemetry protocol, this is done with one of the current telemetry mechanisms: NETCONF, RESTCONF, or gNMI. gNMI clearly mentions in its documentation that it can be used for any data (that is, non-YANG data), with the following characteristics:
A structure that can be represented by a tree, where nodes are uniquely identified by a path consisting of node names, or node names coupled with attributes
Values can be serialized into a scalar object
And even with YANG itself, there is no problem at all describing information not specified by a schema, with the anyxml or anydata construct, or by modeling as strings and binaries. Of course, how to interpret that data requires a data model, and whatever data you want to stream, you need to have a way to refer to it in your telemetry subscription. If you want to enable subscriptions with filtering at the node level and such, then of course you should have a common schema or data model; it is hard for subscription filters to refer to arbitrary data in a structured way.
The analogy with the Network YANG modules specifically designed for the interface between the orchestrator and the controller is obvious (again, see Figure 2-3 in Chapter 2). Therefore, the multilayer architecture helps data aggregation, correlation, and data analytics from potentially diverse sources of information, even if the ideal goal is to receive model-driven telemetry at every layer.
From a publisher configuration point of view, here are the typical elements:
Sensor path: Describes the data you want to stream to a collector that is the YANG path or a subset of data definitions in a YANG model with a tree. In a YANG model, the sensor path can be specified to end at any level in the container hierarchy.
Subscription request for one or more YANG subtrees (including single leafs): This is made by the subscriber of a publisher and is targeted to a collector. A subscription may include constraints that dictate how often or under what conditions YANG information updates might be sent. A subscription is a contract that stipulates the data to be pushed and the associated terms. In other terms, it binds everything together for the router to start streaming data at the configured intervals.
Initialization of streaming session: Describes who initiates the streaming of data from the router toward the collector. Two possible options are dial-in mode (the collector initiates a session to the router and subscribes to data to be streamed out) and dial-out mode (the router initiates a session to the destinations based on the subscription).
Transport protocol: Describes the protocol you want to use to deliver to your collector/ controller the information you selected with sensor paths—for example, NETCONF, RESTCONF, or some new protocol based on gRPC, Transmission Control Protocol (TCP), or even UDP.
Encoding: Describes the format of the data on the wire—for example, Extensible Markup Language (XML), JavaScript Object Notation (JSON), or GPB.
Transport Discussion: Monitoring Versus Events
What is the right transport protocol (UDP- or TCP-based) to be used with telemetry? It’s interesting to observe that the telemetry discussions in the industry today are identical to the IPFIX (IP Flow Information Export) standardization discussions from about 10 years ago (noticeably, because IPFIX is also a telemetry protocol). Indeed, telemetry is potentially a new buzzword for some, but it is certainly not a new concept: IPFIX is already a telemetry protocol.
In the end, transport discussions boil down to operational issues. With the unreliable UDP transport, if no streaming information is received on the collector, what does it mean? The publisher is down, not reachable, or simply has no streaming information to send? Obviously, you could include a message identifier, indicating whether some records were lost (like in NetFlow and IPFIX), but is this enough? It depends on the telemetry content. In case of telemetry for monitoring, such as interface statistics, missing a few telemetry packets in the time series is not a big deal. However, in the extreme case of using telemetry data for accounting, you can’t miss any telemetry information. Ten years ago, the IPFIX solution mandated Stream Control Transmission Protocol (SCTP) Partial Reliability Extension (RFC 3748) as the mandatory-to-implement protocol. However, SCTP did not take off as an important transport protocol in the industry. So, the industry is left with this binary choice: TCP-based or UDP-based transport protocols. Expecting a publisher to keep a buffer full of telemetry records, for potential re-export, is not practical when the publishers are routers streaming a lot of telemetry data at high frequency. The key point is that if you can’t work from samples or if you rely on telemetry to take an action, then telemetry must be considered as an event-based mechanism, and then the transport must be connection-oriented. In both IETF YANG Push and OpenConfig streaming telemetry, the transport is the connection-oriented protocol TCP, encrypted. Refer to Table 2-1 in Chapter 2, which focuses on the different transport stacks. Finally, note that TCP offers yet another advantage compared to UDP—nonrepudiation, which is especially important in case of events.
There are IETF discussions around a UDP-based publication channel for streaming telemetry used to collect data from devices [https://tools.ietf.org/html/draft-ietf-netconf-udp-pub-channel].7 The future will tell to which operational use cases this specification is applicable.
Subscription Type: On-Change Versus Periodic
There are two types of subscriptions: periodic and on-change. With a periodic subscription, data is streamed out to the destination at the configured interval. It continuously sends data for the lifetime of that subscription. With an on-change subscription, data is published only when a change in the data occurs. On-change is also called event-driven telemetry. On-change is mainly applicable to state-like types of objects, typically an interface going down or a neighbor appearing. Note that using on-change for monitoring counters should not be discarded as being irrelevant. For example, a BGP peer reset counter is a perfect candidate for event-driven telemetry, as opposed to periodic. However, some system might have an implied load penalty (for example, if not implemented in shared memory) on top of changing the software behavior for every counter.
So how do you discover which YANG objects support on-change telemetry? Here is an example for Cisco IOS-XR-based devices. Extracted from the Cisco-IOS-XR-types.yang YANG module [https://github.com/YangModels/yang/blob/master/vendor/cisco/xr/651/Cisco-IOS-XR-types.yang],8 Example 5-1 displays an extension called event-telemetry, used to flag on-change-capable objects. Example 5-2 shows such two objects: the address leaf and the information-source leaf, part of the ipv4-rib-edm-path list, for which the on-change subscription type is implemented.
Example 5-1 The Cisco IOS-XR event-telemetry Extension
extension event-telemetry {
  argument description;
  description
    "Node eligible for telemetry event subscription";
}
Example 5-1 illustrates the YANG language extensibility, with the extension keyword, briefly mentioned in Chapter 3. As a reminder, the extension statement allows for the definition of new statements within the YANG language. From there, this new statement definition can be imported and used by other modules—in this case, by the Cisco-IOS-XR-ip-rib-ipv4-oper-sub1.yang displayed in Example 5-2.
Example 5-2 Event-driven Telemetry Example from Cisco-IOS-XR-ip-rib-ipv4-oper-sub1.yang
...
import Cisco-IOS-XR-types {
  prefix xr;
}
...
grouping IPV4-RIB-EDM-PATH {
  description
    "Information of a rib path";
  list ipv4-rib-edm-path {
    description
      "ipv4 rib edm path";
    leaf address {
      type Ipv4-rib-edm-addr;
      description
        "Nexthop";
      xr:event-telemetry "Subscribe Telemetry Event";
    }
    leaf information-source {
      type Ipv4-rib-edm-addr;
      description
        "Infosource";
      xr:event-telemetry "Subscribe Telemetry Event";
    }
While waiting for yangcatalog.org to report the very useful on-change capability metadata for each YANG object, Example 5-3 uses the Unix grep function to highlight all on-change implementations among all YANG modules from the IOS XR 6.5.1 posted in GitHub [https://github.com/YangModels/yang/tree/master/vendor/cisco/xr/651].9
Example 5-3 All YANG Modules Supporting Event-Driven Telemetry
VM:~/yanggithub/yang/vendor/cisco/xr/651$ grep "xr:event-telemetry" *
Cisco-IOS-XR-bundlemgr-oper-sub2.yang:      xr:event-telemetry "Subscribe Telemetry
Event";
Cisco-IOS-XR-controller-optics-oper-sub1.yang:      xr:event-telemetry "Subscribe
Telemetry Event";
Cisco-IOS-XR-ip-rib-ipv4-oper-sub1.yang:        xr:event-telemetry "Subscribe
Telemetry Event";
Cisco-IOS-XR-ip-rib-ipv6-oper-sub1.yang:        xr:event-telemetry "Subscribe
Telemetry Event";
Cisco-IOS-XR-ipv6-ma-oper-sub1.yang:      xr:event-telemetry "Subscribe Telemetry
Event";
Cisco-IOS-XR-pfi-im-cmd-oper-sub1.yang:      xr:event-telemetry "Subscribe Telemetry
Event";
Cisco-IOS-XR-pmengine-oper-sub1.yang:      xr:event-telemetry "Subscribe Telemetry
Event";
...
Dial-In and Dial-Out Modes
A telemetry session is initiated using one of two modes: the dial-in mode or the dial-out mode.
In dial-out mode, the publisher dials out to the collector. In this mode, sensor paths and destinations are configured (typically with a telemetry configuration YANG module) and bound together into one or more subscriptions. The device continually attempts to establish a session with each destination in the subscription and stream data to the receiver. The dial-out mode of subscriptions is persistent. When a session terminates, the device continually attempts to reestablish a new session with the receiver every 30 seconds. There are three steps to configuring the router for telemetry with dial-out:
STEP 1. Create a destination group. The destination group specifies the destination address, port, encoding, and transport that the router should use to send out telemetry data.
STEP 2. Create a sensor group. The sensor group specifies a list of YANG paths to be streamed.
STEP 3. Create a subscription. The subscription associates a destination group with a sensor group and sets the streaming interval.
In dial-in mode, the collector dials in to the device and subscribes dynamically to one or more sensor paths or subscriptions. The device (publisher) acts as the server, and the receiver is the client. The device streams telemetry data through the same session. The dial-in mode of subscriptions is dynamic. This dynamic subscription terminates when the receiver cancels the subscription or when the session terminates. The dial-in mode is suitable when the collector knows exactly its telemetry requirements or when there is a single collector. The dial-in mode is supported only over gRPC Network Management Interface (gNMI; that is, the collector initiates a gRPC session to the router and specifies a subscription). The router sends whatever data is specified by the sensor group in the subscription requested by the collector.
Telemetry Standard Mechanisms
Figures 5-3 and 5-4 help you find your way in the nascent and still-evolving telemetry world. They offer a quick way to navigate through the different telemetry options. Detailed mechanism discussions follow in subsequent sections.

Figure 5-3 Dial-in Telemetry Options
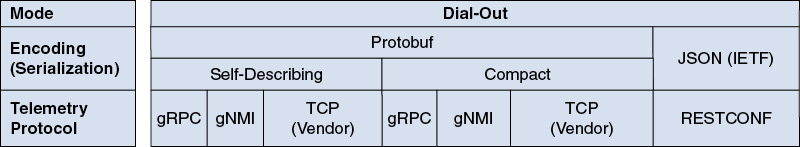
Figure 5-4 Dial-out Telemetry Options
One way to discover the most well-suited telemetry mechanism is to start with this question: dial-out or dial-in mode? Figure 5-3 shows the dial-in telemetry options, whereas Figure 5-4 shows the dial-out telemetry options. The dial-out mode offers RESTCONF, gRPC, gNMI, and a proprietary TCP implementation as protocols, along with the respective encodings JSON and Protocol buffers (protobuf). On the other side, the dial-in mode works with NETCONF, gNMI, or a proprietary TCP implementation. Once gNMI is selected, the encoding selection (JSON according to the IETF specifications, JSON according to the openconfig specifications, or protobuf) is a mix of two considerations:
The first consideration is the encoding efficiency. Protobuf compact mode (as opposed to the protobuf self-describing mode, XML, and JSON) is a tight binary form that saves space on the wire and in memory. This encoding is therefore well-suited for telemetry, when a lot a data is pushed at high frequency toward a collector (typically long and high-frequency time series, the entire Forwarding Information Base (FIB), the BGP Routing Information Base (RIB), quality of service (QoS) statistics, and so on). Compared to the most verbose XML encoding, protobuf provides significant efficiency advantages with a 3-to-10 times reduction in data volume.
The second consideration is the tooling type and expertise in place in the network operations center. For example, an existing JSON toolset along with JSON expertise in the network operation center might determine JSON as the encoding of choice.
NETCONF Event Notifications
RFC 5277, “NETCONF Event Notifications,” from 2008, defines a mechanism as an optional capability, built on top of the base NETCONF definition, whereby the NETCONF client indicates interest in receiving event notifications from a NETCONF server by creating a subscription to receive event notifications. The NETCONF server replies to indicate whether the subscription request was successful and, if so, begins sending the event notifications to the NETCONF client as the events occur within the system. These event notifications are sent until either the NETCONF session is terminated or the subscription terminates for some other reason. The event notification subscription allows a number of options, specified when the subscription is created, to enable the NETCONF client to specify which events are of interest. Once created, a subscription cannot be modified. To change the subscription, you must create a new subscription and drop the old one. This mechanism reduces the risk of race conditions.
The “NETCONF Event Notifications” specification described a few key terms that are reused in today’s telemetry: subscription, event, and stream.
The specification specifies the <create-subscription> operation, which initiates an event notification subscription that sends asynchronous event notifications to the initiator of the command until the subscription terminates. An optional filter indicates which subset of all possible events is of interest. The <notification> operation is sent to the client who initiated a <create-subscription> command asynchronously when an event of interest (that is, meeting the specified filtering criteria) occurred. An event notification is a complete and well-formed XML document. Note that <notification> is not a remote procedure call (RPC) method but rather the top-level element identifying the one-way message as a notification.
RFC 5277 NETCONF event notifications implementations exist, but this old specification suffered from one drawback. Initially, YANG models focused on configuration information only, and there is limited interest to push configuration objects via telemetry only. Indeed, the operational states, sometimes combined with the configuration, are much more valuable. In the meantime, new requirements emerged and the new telemetry work started.
IETF YANG Subscriptions
In 2014, work on “Requirements for Subscription to YANG Datastores” started, eventually finalized as RFC 7923. This document provides the telemetry foundational set of requirements for a service that can be summarized as a “pub/sub” service for YANG datastore updates. Based on criteria negotiated as part of a subscription, updates are pushed to targeted recipients, which eliminates the need for periodic polling of YANG datastores by applications. The document also includes some refinements: the periodicity of object updates, the filtering out of objects underneath a requested a subtree, and delivery QoS guarantees. RFC 7923 is a quick and easy read, providing the right terminology, offering the business drivers for a push solution, comparing (quickly) the pub/sub mechanism to SNMP, describing some use cases, and providing a series of requirements. Reading this document and specifically those requirements can help you understand the goals behind YANG subscription, which is the basis for model-driven telemetry.
At the time of writing, there are four different IETF specifications for what is called “YANG Push and Friends,” as displayed in Table 5-2. Those documents are in the final phase of standardization and, by the time this book is published, you should see the RFCs published.
Table 5-2 The Four IETF Specifications Related to “YANG Push and Friends”
IETF Specification Documents |
Website |
|---|---|
Subscription to YANG Event Notifications |
https://datatracker.ietf.org/doc/draft-ietf-netconf-subscribed-notifications/10 |
Subscription to YANG Datastores |
https://datatracker.ietf.org/doc/draft-ietf-netconf-yang-push/11 |
Dynamic Subscription to YANG Events and Datastores over NETCONF |
https://datatracker.ietf.org/doc/draft-ietf-netconf-netconf-event-notifications/12 |
Dynamic Subscription to YANG Events and Datastores over RESTCONF |
https://datatracker.ietf.org/doc/draft-ietf-netconf-restconf-notif/13 |
There are more companion documents, but they require some more work before finalization. Among those documents, you already learned in this chapter about the UDP-based publication channel for streaming telemetry [https://tools.ietf.org/html/draft-ietf-netconf-udp-pub-channel].7
In Table 5-2, the main building block is the “Subscription to YANG Event Notifications” document. This document provides a superset of the subscription capabilities initially defined within “NETCONF Event Notifications” (RFC 5277), taking into account its limitations, as described in “Requirements for Subscription to YANG Datastores” (RFC 7923). It also specifies a transport-independent capability (remember, RFC 5277 is specific to NETCONF), a new data model, and a remote procedure call (RPC) operation to replace the operation “create-subscription,” and it enables a single transport session to intermix notification messages and RPCs for different subscriptions. What is identical between the old and new specifications is the <notification> message and the contents of the “NETCONF” event stream. Note that a publisher may implement both specifications concurrently. Instead of going into the details of the specifications (for this, it would be best for the final RFC to be published), let’s list the key capabilities, as taken from the “Subscription to YANG Event Notifications” document.
At the minimum, from the same document, you must understand the following concepts.
Note that dynamic subscription was already discussed in the context of dial-in and dial-out mode, earlier in this chapter. In the IETF, even the dynamic subscriptions use the YANG model for configuration. This is a key difference with the OpenConfig dial-in feature, which doesn’t require the openconfig-telemetry YANG model for configuration.
The second document in Table 5-2, “Subscription to YANG Datastores,” specifies how subscriber applications may request a continuous, customized stream of updates from a YANG datastore (that is, a solution that provides a subscription service for updates from a datastore). Basically, this solution supports dynamic as well as configured subscriptions to updates of datastore nodes. It enhances the subscription model with selection filters that identify targeted YANG datastore nodes and/or datastore subtrees for which updates are to be pushed, with periodic and on-change update policies. It also specifies the encoding and a YANG model for the management of datastore push notifications.
The third document, “Dynamic subscription to YANG Events and Datastores over NETCONF,” provides a NETCONF binding to the dynamic subscription capability of both subscribed notifications and YANG Push. Similarly, the fourth document, “Dynamic Subscription to YANG Events and Datastores over RESTCONF,” provides the RESTCONF binding (that is, how to establish and maintain dynamic subscriptions over RESTCONF).
IETF YANG Push Versus OpenConfig: Some History
As displayed in Figure 5-5, it’s interesting to observe how the industry subscription specification has progressed.
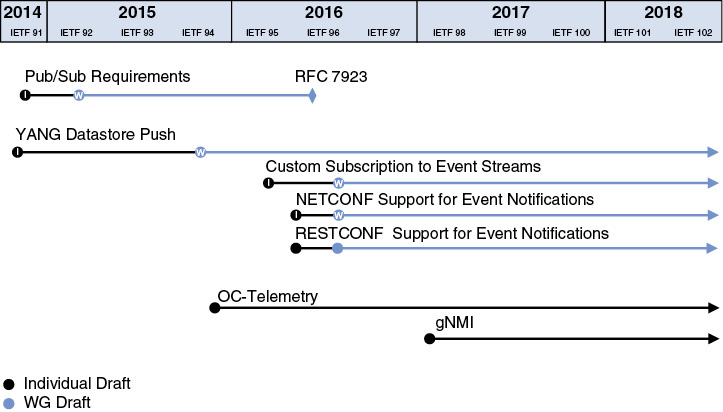
Figure 5-5 Industry Subscription Specification Progress
Not considering RFC 5277, “NETCONF Event Notifications” (from 2008), which was an early attempt at telemetry, focusing solely on NETCONF, the first observation from the figure is the IETF started to work on the new set of requirements and on the YANG Datastore Push in 2014, while at the same time, the OpenConfig consortium did not even mention telemetry. The OpenConfig Telemetry work started at the end of 2015, at the time when IETF was finalizing the pub/sub requirements and when the YANG Datastore Push became a working group document. Note that the OpenConfig telemetry YANG model [https://github.com/openconfig/public/blob/master/release/models/telemetry/openconfig-telemetry.yang]14 went through five revisions since its inception, integrating more and more of the features initially foreseen by the IETF specifications. Finally, gNMI, with its dial-in feature, was first specified in early 2017.
This OpenConfig step-by-step evolution, based on running code (while the IETF specifications are not yet finalized at the time of writing—but should be soon), might explain OpenConfig’s success in terms of implementation by the different router vendors versus the IETF “YANG Push and Friends” telemetry. Undoubtedly, taking more than four years of work for IETF to standardize the requirements and YANG Push mechanisms is way too long, up to the point where the industry started to move away from the IETF regarding telemetry. The IETF solution thought about many concepts Day One: dynamic configuration with parameter negotiation, stop time configuration, replay, virtual routing and forwarding (VRF) support, multiple receivers, suspend and resume operations, filtering based on subtree/substring/range, quality of service, admission control, on-change and periodic, and so on. In the end, it doesn’t matter that OpenConfig selected the most useful concepts from the IETF solution, up to the point where both the IETF and OpenConfig telemetries have some commonalities, as displayed by the Figure 5-6.
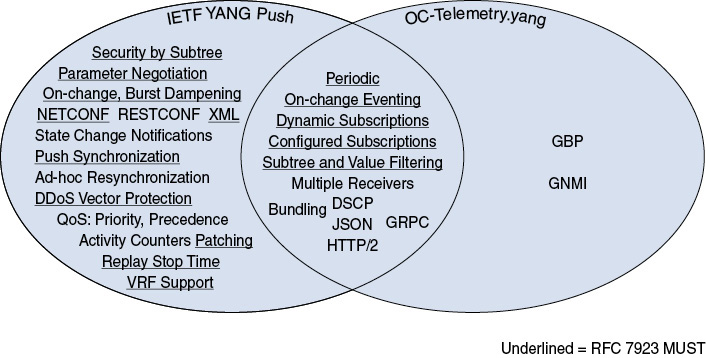
Figure 5-6 Requirement Coverage Between IETF YANG Push and OpenConfig Telemetry
OpenConfig Streaming Telemetry
As seen in Figure 5-4, the OpenConfig version comes in two flavors, or mainly in two evolutions: the OC telemetry and gNMI. The first one is the OpenConfig telemetry YANG module for telemetry configuration and monitoring on the publisher and the second one is gNMI [https://github.com/openconfig/gnmi]15 with the dial-in mode. As detailed in Chapter 4, gNMI is a protocol for configuration manipulation and state retrieval.
gNMI telemetry makes use of the SubscribeRequest (see Chapter 4’s section titled “gNMI SubscribeRequest and Telemetry” or go directly the OpenConfig “Subscribing to Telemetry Updates” docu-mentation at https://github.com/openconfig/reference/blob/master/rpc/gnmi/gnmi-specification.md#35-subscribing-to-telemetry-updates).16 Note that the OpenConfig telemetry YANG model is not required for dial-in mode: From the “user” perspective, the collector just dials in to the publisher and specifies the sensor path it wants to monitor.
Notice in Figure 5-3 the subtle difference between two encodings: JSON (IETF) and JSON (OpenConfig). gNMI supports the JSON encoding, as defined by the IETF in “JSON Encoding of Data Modeled with YANG” (RFC 7951). However, using that specification means the telemetry variables that are 64-bit integers become strings. A value of the “int64”, “uint64”, or “decimal64” type is represented as a JSON string whose content is the lexical representation of the corresponding YANG type, which is not ideal in collectors. The argument is that the encoding of values is best done using native types. OpenConfig adopted native protobuf encodings, with a mapping from the schema types if required, as indicated by “JSON (OpenConfig)” in Figure 5-3.
Interview with the Experts
Q&A with Alex Clemm
Alex Clemm is a distinguished engineer at Huawei’s Future Networks and Innovation group in Santa Clara, California. He has been involved in networking software, distributed systems, and management technology throughout his career. He has provided technical leadership for many products, from conception to customer delivery, most recently in the areas of high-precision networks and future networking services as well as network analytics, intent, and telemetry. He has served on the Organizing and Technical Program Committees of many management and network softwarization conferences, most recently as technical program chair of IEEE NetSoft 2017 and IFIP/IEEE IM 2019. He has around 50 publications and 50 issued patents. He has also authored several books (including Network Management Fundamentals) and RFCs. Alex holds an MS degree in computer science from Stanford University and a Ph.D. from the University of Munich, Germany.
Question:
Can you stress the importance of telemetry in automation?
Answer:
Telemetry provides users and applications with visibility into the network. It allows users to analyze what is going on in the network, to assess the network’s health, to see if there is anything unusual going on that would demand attention. For example, telemetry data allows you to detect when things are trending in certain ways, perhaps pointing to deteriorating conditions of some sort or to conditions that are somehow out of the ordinary, which might point to other problems such as an attack on the network. The actual analysis is generally up to an experienced end user or, more commonly these days, a smart analytics application. However, the fuel for this analysis is telemetry. It provides the underlying data to act on.
Telemetry is important for automation in several ways. For one, it lets you automate actions in response to certain conditions—for example, when it appears that a problem is building up and some configuration adjustments or tuning of parameters is needed. In that sense, telemetry data in effect provides the trigger for automated actions. Second, telemetry data lets you assess whether actions are having the desired effect. Smart automation typically involves control loops, in which some condition that may be rooted in the observation of telemetry data triggers an action, whose effects are then monitored for conditions that may subsequently trigger further actions. Whenever you have smart automation that involves control loops, telemetry becomes an important part of the equation.
Question:
What is the connection between telemetry and configuration?
Answer:
Telemetry first and foremost concerns operational data that is discovered from the network—things like health information, utilization data, interface statistics, and queue states, those sort of things. In general, it does not concern configuration data, as that data is controlled by the user and does not need to be “found out.” However, there is still a connection with configuration at several levels.
For one, users may be interested in assessing whether configuration actions are having the desired effect on the network. Telemetry is an important key to answering those questions. For example, a configuration action might affect the location of a performance bottleneck; it might change the balance of interface utilization; it might change how certain flows are routed and what packets are dropped. All of these effects can be analyzed by inspecting telemetry data.
Second, under certain circumstances it can be of interest to also include configuration data as part of telemetry. This is the case in scenarios where configuration data can change unexpectedly and dynamically—for example, in the case of virtualized resources and multiple orchestrators. It can also help to consolidate configuration and operational data for certain machine-learning scenarios, particularly when analysis of data in the context of specific configurations is involved.
Finally, it should be pointed out that telemetry itself needs to be configured—not just the collection of telemetry data from the device but the generation of telemetry data by the device. Telemetry imposes significant load on the device; therefore, what telemetry data to generate and how much of it becomes an important configuration decision. While telemetry itself is streamed to the outside client, internal registers and state may need to be polled. Telemetry data also needs to be encoded and exported, which can become an important factor as the volume of the data can easily get very large. It is one thing to export selected interface statistics once a minute or so, but trying to take a complete dump of device state every millisecond may not be feasible. Therefore, users and applications need to carefully weigh what telemetry data is actually required and determine the point where the benefit of obtaining more fine-grained telemetry outweighs the cost of generating it and collecting it. In addition, the relevance of data may vary. For example, some data may be of interest only under certain conditions, such as when a “hot spot” needs to be analyzed. All this requires the ability to dynamically configure, and reconfigure, the generation of telemetry.
Question:
Can you describe your telemetry work at the IETF? How does it compare to the OpenConfig streaming telemetry?
Answer:
In the IETF, I am working on the YANG Push suite of Internet drafts. This work actually involves many people, including Eric Voit, Balazs Lengyel, Reshad Rahman, Henk Birkholz, Andy Bierman, Alberto Gonzalez Prieto, Walker Zheng, Tianran Zhou, to name just a few. YANG Push started out as a single draft that specified a means to let NETCONF clients subscribe to YANG datastore updates without needing to poll, supporting two subscription models: periodic and on-change. At this point, the work has proliferated into several drafts in order to generalize the mechanism provided and make them reusable. Specifically, the mechanism for subscriptions to notifications has been separated out from the more specific mechanism to subscribe to datastore updates. Also, the mechanism to deliver updates has been separated from the subscription mechanism itself. NETCONF and RESTCONF can both be used, and the architectural model allows you to plug in other transports as well.
Prior to the work on YANG Push, NETCONF, RESTCONF, and YANG had focused mostly on the needs of applications related to fulfillment. It basically centered around the problem of automating device configuration and obviating the need for CLI-based configuration files. While YANG did allow for the definition of non-configuration data, applications related to service assurance were clearly an afterthought. With YANG Push, we set out to change that and address the need of applications related to service assurance. Those applications heavily rely on telemetry data, which using plain NETCONF or RESTCONF would basically have required polling. The need to poll has led to many problems with other technologies in the past, most notably SNMP. This includes the fact that polling introduces a lot of avoidable load that impacts scalability, as well as problems with regard to reliability and precise synchronization of polling intervals required to make data more comparable and useful. It was clear that something better would be needed for the next generation of management technology. Given the proliferation of YANG, it was also important to choose an approach that would integrate with, build on, and extend the existing NETCONF/RESTCONF/YANG architecture.
YANG Push actually predates OpenConfig streaming telemetry. The fact that it has taken a long time to standardize is a testament to the fact that the IETF standardization process unfortunately does not always move as quickly as we would like. That said, there are various detail differences. Most obviously, YANG Push focuses on operating with IETF’s NETCONF/RESTCONF/YANG framework, offering support for NETCONF and RESTCONF both for control of subscriptions and for delivery of updates, whereas OpenConfig leverages non-IETF, Google-owned technologies such as Google Protocol Buffers and Google RPC. In addition, as it is not primarily focused on data center management, YANG Push is more feature rich and offers additional capabilities, such as the ability to negotiate subscription parameters, the prioritization of subscriptions, push synchronization, and VRF support.
Question:
Telemetry is still evolving in the industry. What do we still need to accomplish?
Answer:
It is only the first phase of telemetry that is coming to a conclusion as we are wrapping up standardization.
Of the things that come next, perhaps the most relevant involves making telemetry “smarter” and more actionable. Instead of simply generating huge volumes of telemetry data and exporting it for external analysis, some of that analysis can occur right at the source. As a result, the volume of data that needs to be exported, collected, and analyzed can get greatly reduced. This lowers cost, simplifies operations, and reduces reaction time.
For example, one next step involves the ability to define smart filters. Instead of simply exporting any and all data, a simple smart filter would allow exporting data only when its value crosses a threshold. Similarly, another smart filter would allow exporting data only when a high-water mark has been breached (such as maximum utilization within the past 10 minutes per a rolling window), or when the data represents a local maximum within the devices (such as the currently most utilized interface). Further down the road it’s conceivable to add the ability to aggregate raw data, for example, to provide medians, percentiles, and distributions of parameter ranges, or to plug in anomaly detection modules that notify clients when telemetry data is outside “normal” operating ranges. Many of those capabilities may not be standardized but become competitive differentiators. However, it is important that telemetry frameworks can be extended in ways to accommodate such functionality. Ultimately, all this will allow for smarter embedded automation, control loops, and intelligence at the network edge.
Summary
Two important telemetry terms are used in this chapter:
Telemetry (also known as data model–driven telemetry, model-driven telemetry, and streaming telemetry). By default, telemetry deals with operational information. Therefore, it could be called operational telemetry, even if nobody uses that term in the industry. Network and operations engineers speak of just telemetry.
Business telemetry refers the use of telemetry to stream information useful for business developments. When business developers, (senior) vice presidents, and top execs speak of telemetry, they actually mean business telemetry.
In this chapter, you learned about the telemetry concepts and the different telemetry mechanisms. As (model-driven) telemetry is still an evolving field in the industry, Figure 5-3 offers a quick way to navigate through the different telemetry options by taking a couple of questions/points into consideration.
References in This Chapter
To further extend your knowledge, here are a few of references in Table 5-3.
Table 5-3 Telemetry-Related Pointers
Topic |
Content |
|---|---|
Model-Driven Telemetry |
Beginner, intermediate, and expert content related to model-driven telemetry on Cisco’s website. |
The Limits of SNMP |
https://blogs.cisco.com/sp/thelimits-of-snmp] Shelly Cadora, in her blog, explains why SNMP is not suitable for telemetry. |
gNMI |
https://github.com/openconfig/gnmi gRPC Network Management Interface |
gNMI Telemetry |
gNMI Telemetry Specifications |
http://tools.ietf.org/html/rfc7923 “Requirements for Subscription to YANG Datastores.” |
|
Four IETF soon-to-be-published RFCs |
See Table 5-2. |
Endnotes
1. https://blogs.cisco.com/sp/the-limits-of-snmp
3. https://www.yangcatalog.org/yang-search/
4. https://www.yangcatalog.org/yang-search/module_details/?module=ietf-interfaces
5. https://www.yangcatalog.org/yang-search/module_details/?module=openconfig-interfaces
6. https://github.com/cisco-ie/tdm
7. https://tools.ietf.org/html/draft-ietf-netconf-udp-pub-channel
8. https://github.com/YangModels/yang/blob/master/vendor/cisco/xr/651/Cisco-IOS-XR-types.yang
9. https://github.com/YangModels/yang/tree/master/vendor/cisco/xr/651
10. https://datatracker.ietf.org/doc/draft-ietf-netconf-subscribed-notifications/
11. https://datatracker.ietf.org/doc/draft-ietf-netconf-yang-push/
12. https://datatracker.ietf.org/doc/draft-ietf-netconf-netconf-event-notifications/
13. https://datatracker.ietf.org/doc/draft-ietf-netconf-restconf-notif/
14. https://github.com/openconfig/public/blob/master/release/models/telemetry/openconfig-telemetry.yang
15. https://github.com/openconfig/gnmi
16. https://github.com/openconfig/reference/blob/master/rpc/gnmi/gnmi-specification.md#35-subscribing-to-telemetry-updates