Chapter 7
Regression II
7.1 Introduction
In Chapter 4 we introduced rank-based fitting of linear models using Rfit. In this chapter, we discuss further topics for rank-based regression. These include high breakdown fits, diagnostic procedures, weighted regression, nonlinear models, and autoregressive time series models. We also discuss optimal scores for a family of skew normal distributions and present an adaptive procedure for regression estimation based on a family of Winsorized Wilcoxon scores.
Let denote an n × 1 vector of responses. Then the matrix version of the linear model, (4.2), is
where is an n × p design matrix, and is an n × 1 vector of error terms. Assume for discussion that f(t) and f(t) are the pdf and cdf of ei, respectively. Assumptions differ for the various sectional topics.
Recall from expression (4.10) that the rank-based estimator is the vector that minimizes the rank-based distance between Y and Xβ; i.e., is defined as
where the norm is defined by
and the scores for a specified score function φ(u) defined on the interval (0,1) and satisfying the standardizing conditions given in (3.12).
Note that the norm is invariant to the intercept parameter; but, once β is estimated, the intercept α is estimated by the median of the residuals. That is,
The rank-based residuals are defined by
Recall that the joint asymptotic distribution of the rank-based estimates is multivariate normal with the covariance structure as given in (4.12).
As discussed in Chapter 3, the rank-based estimates are generally highly efficient estimates. Further, as long as the score function is bounded, the influence function of is bounded in the Y-space (response space). As with LS estimates, though, the influence function is unbounded in the x-space (factor space). In the next section, we present a rank-based estimate which has bounded influence in both spaces and which can attain the maximal 50% breakdown point.
7.2 High Breakdown Rank-Based Fits
High breakdown rank-based (HBR) estimates were developed by Chang et al. (1999) and are fully discussed in Section 3.12 of Hettmansperger and McKean (2011). To obtain HBR fits of linear models, a suite of R functions (ww) was developed by Terpstra and McKean (2005). We use a modified version, hbrfit, of ww to compute HBR fits.1
The objective function for HBR estimation is a weighted Wilcoxon dispersion function given by
where bij ≥ 0 and bij = bji. The HBR estimator of β minimizes this objective function, which we denote by
As with the rank-based estimates the intercept α is estimated as the median of the residuals; that is,
As shown in Chapter 3 of Hettmansperger and McKean (2011), if all the weights are one (i.e., bij≡ 1) then || • ||HBR is the Wilcoxon norm. Thus the question is, what weights should be chosen to yield estimates which are robust to outliers in both the x− and y-spaces? In Section 7.2.1, we discuss the HBR weights implemented in hbrfit which achieve 50% breakdown. For now, though, we illustrate their use and computation with several examples.
Stars Data
In this subsection we present an example to illustrate the usage of the weighted Wilcoxon code hbrfit to compute HBR estimates. This example uses the stars dataset which is from Rousseeuw et al. (1987). The data are from an astronomy study on the star cluster CYG OB1. The cluster contains 47 stars. Measurements were taken on light intensity and temperature. The response variable is log light intensity and the explanatory variable is log temperature. As is apparent in the scatterplot displayed in Figure 7.1 there are several outliers: there are four stars with lower temperature and higher light intensity than the other members of the cluster. These four stars are labeled giant stars in this dataset. The others are labeled main sequence stars, except for the two with log temperature 3.84 and 4.01 which are between the giant and main sequence stars.

In Figure 7.2, the Wilcoxon (WIL), high breakdown (HBR), and least squares (LS) fits are overlaid on the scatterplot. As seen in Figure 7.2, both the least squares and Wilcoxon fit are affected substantially by the outliers; the HBR fit, however, is robust.

The HBR fit is computed as
> fitHBR<-hbrfit(stars$light ˜ stars$temperature)
As we have emphasized throughout the book the use of residuals, in particular Studentized residuals, are essential to the model building process. Studentized residuals are available through the command rstudent. In addition, a set of diagnostic plots can be obtained using diagplot. For HBR fit of the stars data, Figure 7.3 displays these diagnostic plots, which resulted from the code:
> diagplot(fitHBR)

Note from these plots in Figure 7.3 that the Studentized residuals of the HBR fit clearly identify the 4 giant stars. They also identify the two stars between the giant and main sequence stars.
Finally, we may examine the estimated regression coefficients and their standard errors in the table of regression coefficients with the command summary; i.e.,
> summary(fitHBR)
Call:
hbrfit(formula = stars$light ˜ stars$temperature)
Coefficients:
Estimate Std. Error t.value p.value
(Intercept) -3.46917 1.64733 -2.1059 0.04082 *
stars$temperature 1.91667 0.38144 5.0248 8.47e-06 ***
–––
Signif. codes: 0 ‘***’ 0.001 ‘**’ 0.01 ‘*‘ 0.05 ‘.’ 0.1 ‘ ’ 1
Wald Test: 25.24853 p-value: 1e-05
The estimate of intercept is −3.47 (se = 1.65). The estimate of slope is 1.92 (se = 0.38). Critical values based on a t-distribution with n – p − 1 degrees of freedom are recommend for inference; for example p-values in the coefficients table for the stars data are based on a t45 distribution. Also displayed is a Wald test of H0 : β = 0.
7.2.1 Weights for the HBR Fit
Let Xc be the centered design matrix. For weights it seems reasonable to downweight points far from the center of the data. The traditional distances are the leverage values , where xci is the vector of the ith row of Xc. Because the leverage values are based on the LS variance-covariance scatter matrix, they are not robust. The weights for the HBR estimate make use of the high breakdown minimum covariance determinant, MCD, which is an ellipsoid in p-space that covers about half of the data and yet has minimum determinant. Rousseeuw and Van Driessen (1999) present a fast computational algorithm for it. Let V and vc denote respectively the MCD and the center of the MCD. The robust distances and weights are respectively and , where c is usually set at the 95th percentile of the χ2(p) distribution. Note that “good” points generally have weight 1. The estimator (7.7) of β obtained with these weights is called a generalized R (GR) estimator. In general, this GR estimator has a bounded influence function in both the Y and the x-spaces and a positive breakdown. It can be computed using the suite of R functions ww with wts = “GR”.
Note that the GR estimate downweights “good” points as well as “bad” points of high leverage. Due to this indiscriminate downweighting the GR estimator is less efficient than the Wilcoxon estimator. At times, the loss in efficiency can be severe. The HBR weights also use the MCD to determine weights in the x-space. Unlike the GR weights, though, residual information from the Y-space is also used. These residuals are based on the the least trim squares (LTS) estimate which is Argmin where h = [n/2] + 1 and (i) denotes the ith ordered residual. This is a high breakdown initial estimate; see Rousseeuw and Van Driessen (1999). Let denote the residuals from this initial fit.
Define the function ψ(t) by ψ(t) = 1, t, or − 1 according as t ≥ 1, −1 < t < 1, or t ≤ −1. Let σ be estimated by the initial scaling estimate . Letting , define
Consider the weights
where b and c are tuning constants. Following Chang et al. (1999), b is set at the upper χ205(p) quantile and c is set as
where . From this point of view, it is clear that these weights downweight both outlying points in factor space and outlying responses. Note that the initial residual information is a multiplicative factor in the weight function. Hence, a good leverage point will generally have a small (in absolute value) initial residual which will offset its distance in factor space. These are the weights used for the HBR fit computed by hbrfit.
In general, the HBR estimator has a 50% breakdown point, provided the initial estimates used in forming the weights also have a 50% breakdown point. Further, its influence function is a bounded function in both the Y and the x-spaces, is continuous everywhere, and converges to zero as (x*,Y*) get large in any direction. The asymptotic distribution of is asymptotically normal. As with all high breakdown estimates, is less efficient than the Wilcoxon estimates but it regains some of the efficiency loss of the GR estimate. See Section 3.12 of Hettmansperger and McKean (2011) for discussion.
7.3 Robust Diagnostics
Diagnostics are an essential part of any analysis. The assumption of a model is a very strong statement and should not be taken lightly. As we have stressed throughout the book, diagnostic checks should be made to confirm the adequacy of the model and check the quality of fit. In this section, we explore additional diagnostics based on both highly efficient and high breakdown robust fits. These diagnostics are primarily concerned with the determination of highly influential points on the fit.
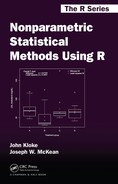
For motivation, we consider a simple dataset with two predictors and n = 30 data points. The scatterplot of the columns of the two-dimensional (p = 2) design matrix, X, is shown in Figure 7.4. The values of the x’s are drawn from uniform distributions. The design matrix and observations are in the dataset diagdata.
Consider the four points in the upper-right corner of the plot, which are the 27th through 30th data points. As the following two sets of responses show, these points are potentially influential points on fits. The first set of responses is drawn from the model
where e1,..., en were drawn independently from a N(0, 1) distribution. We label this the “good” dataset. For this set the responses for cases 27 through 30 are respectively 7.001, 7.397, 9.191, and 8.269), which follow the model. To form the second set of responses, we negated these four responses; i.e., the observations for cases 27 though 30 are respectively −7.001, −7.397, −9.191, and −8.269, which of course do not follow the model. We label this second set, the “bad” dataset. We obtain the LS, Wilcoxon, and HBR fits of the two models, summarizing them in Table 7.1.
Estimates of the Regression for the Simple Datasets (good and bad).
Intercept |
X1 |
X2 |
|
|---|---|---|---|
LS Good Data |
0.12 |
4.45 |
4.74 |
Wil Good Data |
0.10 |
4.42 |
4.64 |
HBR Good Data |
-0.11 |
4.62 |
4.91 |
LS Bad Data |
5.56 |
-4.49 |
-5.96 |
Wil Bad Data |
6.07 |
-4.59 |
-5.83 |
HBR Bad Data |
-0.11 |
4.55 |
4.79 |
On the good dataset all three fits agree. On the bad dataset both the LS and Wilcoxon fits were impaired while the HBR fit exhibited robustness. Thus the 27th through 30th data points are potentially influential points.
Note first that traditional diagnostic procedures are generally not efficient at these tasks. Their geometry is based on the Euclidean norm which is sensitive to outlying points in the x-space. For example, for this simple dataset, the vector of column means of the design matrix is (0.369, 0.399), while the vector of column medians is (0.148,0.38). Hence, the outliers have influenced the center of design based on the mean. The leverage values for the four outlying points are respectively 0.192, 0.193, 0.183, and 0.181. Note that these are less than the usual benchmark for points of high leverage which is given by 2(p + 1)/n = 0.2. Thus, if the leverage rule is followed strictly, these four points would not have been identified.
Traditional delete-one diagnostics are often used to check the quality of the fit. For example, consider the diagnostic DFFITSi which is the standardized change in the LS fitted value for case i when case i is deleted; see Belsley et al. (1980). For datasets containing a cluster of outliers in the X-space, though, when one of the cases in the cluster is deleted there are still the remaining cases in the cluster which will impair the LS fit in the same way as in the LS fit based on all the data. Hence, DFFITSi will generally be small and the points will not be detected. For the simple dataset, the values of DFFITS27 through DFFITS30 are respectively −0.517, −0.583, −0.9, and −0.742. Since the benchmark is , Cases 27 and 28 are not detected as influential points. The other two cases are detected but they are borderline. For example, Case 7, which is not a point of concern, has the DFFITS value of 0.70. Hence, for this example, the diagnostic DFFITSi has not been that successful.
Note that for this simple example, the HBR estimates remain essentially the same for both the “good” and “bad” datasets. We now present diagnostics based on the HBR estimates and the robust distances and LTS residuals that are used to form the HBR weights. These diagnostics are robust and are generally successful in detecting influential cases and in detecting differences between highly efficient and high breakdown robust fits.
7.3.1 Graphics
In general, consider a linear model of the form (7.1). In Section 7.2, we defined the robust distances , where , V is the minimum covariance determinant (MCD), and υc is the center of the ellipsoid V. Recall that these were used to obtain the weights in the HBR fit, see expression (7.9). Another part of these weights utilizes the standardized residuals based on the LTS fit. Rousseeuw and van Zomeren (1990) proposed as a diagnostic, the plot of these standardized residuals versus the robust distances. For the simple example with the set of bad responses, this plot is found in Figure 7.5. Note that the 4 influential cases are clearly separated from the other cases. Hence, for this example, the diagnostic plot was successful. The next segment of R code obtains the robust distances, standardized LTS residuals, and the diagnostic plot shown in Figure 7.5. The observations for the second set of data (bad data) are in the R vector ybad while the design matrix is in the R matrix x. Some caution is necessary here, because standardized residuals are not corrected for locations of the residuals in the X-space as Studentized residuals are.

Standardized LTS residuals versus robust distances for the simple example with bad responses.
> rsdfitlts <- ltsreg(x,ybad)$resid
> srsd <- rsdfitlts /mad(rsdfitlts)
> rdis <- sqrt(robdistwts(x,ybad)$robdis2)
> plot(rdis,srsd,xlab=“Robust distance”,
+ ylab=“LTS standardized residual”)
> title(main=“Standardized LTS Residuals vs. Robust Distances”)
7.3.2 Procedures for Differentiating between Robust Fits
Recall that for the simple dataset with bad responses the differences between the Wilcoxon and HBR fits are readily apparent; see Table 7.1. We next discuss a set of formal diagnostics based on the difference between fits; see2 McKean et al. (1996a). Consider a general linear model, say Model (7.1). The difference between estimates includes the intercept, so, for this section, let bT = (α, βT) denote the combined parameters. Then the difference between the HBR and Wilcoxon regression estimates is the vector . An effective standardization is the estimate of the variance-covariance of . A statistic which measures the total difference between the fits is
where AW is the asymptotic Wilcoxon covariance matrix for linear models. Large values of TDBETAS indicate a discrepancy between the fits. A useful cutoff value is (4(p + 1)2)/n.
If TDBETASR exceeds its benchmark then usually we want to determine the individual cases causing the discrepancy between the fits. Let and denote the respective Wilcoxon and HBR fits for the ith case. A Studentized statistic which detects the observations that differ in fit is
An effective benchmark for CFITSi is . Note that the standardization of CFITSi accounts for the location of the ith case in the X-space.
The objective of the diagnostic CFITS is not outlier deletion. Rather the intent is to identify the few critical data points for closer study, because these points are causing discrepancies between the highly efficient and high breakdown fits of the data. In this regard, the proposed benchmarks are meant as a heuristic aid, not a boundary to some formal critical region.
In the same way, the difference between the LS fit and either the Wilcoxon or HBR fits can be investigated. In general, though, we are interested in the difference between a highly efficient robust fit and a high breakdown robust fit. In all comparison cases, the standardization of the diagnostics is with the variance-covariance matrix of the Wilcoxon fit. For computation, the function fitdiag, in the collection hbrfit, computes these diagnostics for the Wilcoxon, HBR, GR, LS, and LTS fits. Its argument est specifies the difference to compute; for example, if est=c (“WIL”, “HBR”) then the diagnostics between the Wilcoxon and HBR fits are computed, while est=c(“LTS”, “WIL”) computes the diagnostics between the Wilcoxon and LTS fits. Besides the diagnostics, the associated benchmarks are returned.
From the computation, the value of TDBETAS is 43.93 which far exceeds the benchmark of 1.2; hence, the diagnostic has been successful. Even more importantly, though, is that the diagnostic CFITS in Figure 7.6 clearly flags the four influential cases. These are the points at the bottom right corner of the plot. In reading plots, such as the CFITS plot, the large gaps are important. In this case, the four influential points clearly stand out and are the ones to investigate first. As the reader is asked to show, Exercise 7.9.5, for this dataset with the set of good responses, TDBETAS is less than its benchmark and none of the CFITS values, in absolute value, exceed their benchmark.

Plot of the changes in fits (CFITS) between the Wilcoxon and HBR fits for the simple dataset with the set of bad responses. The horizontal lines are set at the benchmark.
Example 7.3.1 (Fit Diagnostics for Stars Data).
The next code segment computes the robust distances and the diagnostics for the difference between the Wilcoxon and HBR fits of the stars data, discussed in Section 7.2.
> dwilhbr = fitdiag(stars$temperature,stars$light,est=c(“WIL”, “HBR”))
> tdbetas <- round (c (dwilhbr$tdbeta,dwilhbr$bmtd) ,digits=2)
> rdis <- sqrt(robdistwts(stars$temperature,stars$light)$robdis2)
The diagnostic TDBETAS has the value 67.92 which greatly exceeds its benchmark of 0.34. Thus numerically indicating that the HBR and Wilcoxon fits differ. The CFITS plot, right panel of Figure 7.7, clearly shows the four giant stars (Cases 11, 20, 30, and 34). It also finds the two stars between the giant stars and the main sequence stars, namely Cases 7 and 14. The robust distance plot conveys similar information. For the record, the diagnostic TDBETAS for the difference in fits between the Wilcoxon and LTS fits is 265.39, which far exceeds the benchmark.

The following generated dataset illustrates the curvature problem for high breakdown fits.
Example 7.3.2 (Curvature Data).
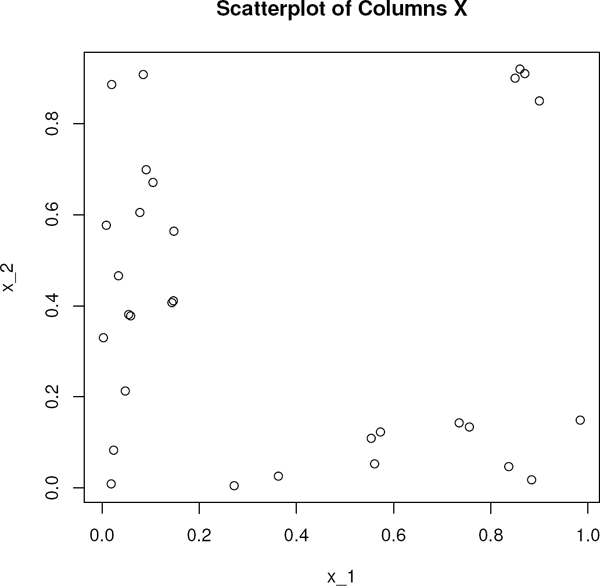
Hettmansperger and McKean (2011), page 267, consider a simulated quadratic model with N(0, 1) random errors and absolute contaminated normal xs. The model is . The scatterplot of the data overlaid with the Wilcoxon and HBR fits are shown in Figure 7.8. The Wilcoxon and HBR estimates are:
> summary(fitwil)
Call:
rfit.default(formula = y ˜ xmat)
Coefficients:
Estimate Std. Error t.value p.value
(Intercept) -0.665013 0.421598 -1.5774 0.1232
xmatx 5.946872 0.326518 18.2130 <2e-16 ***
xmat -0.652514 0.045484 -14.3462 <2e-16 ***
–––
Signif. codes: 0 ‘***’ 0.001 ‘**’ 0.01 ‘*’ 0.05 ‘.’ 0.1 ‘ ’ 1
Multiple R-squared (Robust): 0.842278
Reduction in Dispersion Test: 98.795 p-value: 0
> summary(fithbr)
Call:
hbrfit(formula = y ˜ xmat)
Coefficients:
Estimate Std. Error t.value p.value
(Intercept) 0.175941 0.371664 0.4734 0.6387183
xmatx 4.796202 0.463747 10.3423 1.819e-12 ***
xmat -0.373726 0.098066 -3.8110 0.0005065 ***
–––
Signif. codes: 0 ‘***‘ 0.001 ‘**’ 0.01 ‘*‘ 0.05 ‘.’ 0.1 ‘ ’ 1
Wald Test: 220.5558 p-value: 0
As the summary of coefficients and the scatterplot show the Wilcoxon and HBR fits differ. The Wilcoxon fit follows the model while the HBR fit did not detect the curvature as well as the Wilcoxon fit. For the Wilcoxon and HBR fits, the value of TDBETAS is 67.637 with benchmark 0.9; so the diagnostics on the difference of the two fits agrees with this assessment. Figure 7.9 shows the corresponding plot of the diagnostic CFITS.

The points corresponding to the largest absolute change in CFITS are at the region of most curvature in the quadratic model.
As in the last example, high breakdown fits may be impaired, if curvature occurs “far” from the robust center of the data; see McKean et al. (1994) for a study on this concern for polynomial models. In the last example, the diagnostic CFITS did pinpoint this region.
7.3.3 Concluding Remarks
As the examples in this and the last sections show, in the case of messy datasets, influential points in the x-space can have a negative impact on highly efficient robust fits as well as LS fits. Hence, the use of diagnostics is recommended for detecting influential points and measuring their effect on highly efficient robust fits. In practice, if influential points are detected and found to have a negative impact on a highly efficient robust fit then we recommend using the inference based on high breakdown robust fits, such as the HBR fit. Usually, influential points in the x-space are signs of a poor design. For observational data, though, this often cannot be helped. Note, also, that such points can be part of a planned experiment such as experiments designed to detect curvature. The diagnostics discussed in this section are helpful for assessing the better fit for such cases.
7.4 Weighted Regression
For a linear model, weighted regression can be used, for example, when variances are heteroscedastic or for problems that can be solved by iterated reweighted procedures (least squares or rank-based). We begin with a general discussion that includes a simple R function which computes weighted rank-based estimates using Rfit.
Consider the linear model with Y as an n × 1 vector of responses and X as the n × p design matrix. Write the model as
where X1 = [1 X] and b = (α, β‘)’. We have placed the subscript 1 on the matrix X1 because it contains a column of ones (intercept). Let W be an n×n matrix of weights. For example, if the covariance matrix of e is Σ, then the weight matrix that yields homogeneous variances is W = Σ−1/2, where Σ−1/2 is the usual square root of a positive definite matrix, (of course, in practice W needs to be estimated). The weighted model is:
For easier notation, let Y* = WY, X* = WX1, and e* = We. The matrix X* does not have a subscript 1 because generally the weights eliminate the intercept. Then we can write the model as
Let Ω* be the column space of X*. This is our subspace of interest.
As mentioned above, usually in Model (7.14) there is no longer an intercept parameter; i.e., we have a case of regression through the origin. This is an explicit assumption for the following discussion; that is, we assume that the column space of X* does not contain a column of ones. Because the rank-based estimators minimize a pseudo-norm we have
where is the ith row of X* and is the vector of column averages of X*. Hence, based on this result, the estimator of the regression coefficients based on the R fit of Model (7.14) is estimating the regression coefficients of the centered model, i.e., the model with the design matrix . Thus the rank-based fit of the vector of regression coefficients is in the column space of Xc, not the column space of X*.
Dixon and McKean (1996) proposed the following3 solution. Assume that (7.14) is the true model, but first obtain the rank-based fit of the model:
where the true α1 is 0. Let U1 = [1 X*] and let denote the column space of U1 Let denote the R fitted value based on the fit of Model (7.16), where, as usual, the intercept parameter a1 is estimated by the median of the residuals of the rank-based fit. Note that the subspace of interest Ω* is a subspace of Ω1, i.e., . Secondly, project this fitted value onto the desired space Ω*; i.e., let , where . Thirdly, and finally, estimate b by solving the equation
that is, . This is the rank-based estimate for Model (7.17).
The asymptotic variance of is given by
where H1 and are the projection matrices onto a column of ones and the column space of Xc, respectively.
We have written an R function which obtains the weighted rank-based fit. The function has the following arguments
> args(wtedrb)
function (x, y, wts = diag(rep(1, length(y))), scores = wscores)
NULL
where y and x are the R vector of responses and design matrix, respectively. These responses and design matrix are the non-weighted values as in Model (7.13). The weights are in the matrix wts with the default as the identity matrix. The scores option allows for different scores to be used with the Wilcoxon scores as the default. Values returned are: fitted values ($yhatst), residuals ($ehatst), estimate of regression coefficients ($bstar), standard errors of estimates ($se), and estimated covariance matrix of estimates ($vc).
The two main applications for the function wtedrb are:
- Models of the form (7.13) for which a weighted regression is desired. Let W denote the weight matrix. Then the model to be fitted is given in expression (7.14). In this case the matrix X* is the design matrix argument for the function wtedrb and the matrix W is the weight matrix. It is assumed that a vector of ones is not in the column space of X*.
A regression through the origin is desired. In this case, the model is
where the column space of X does not contain a vector of ones while that of U1 does. For this model, the design matrix argument is X and there is no weight matrix; i.e., the default identity matrix is used. Some cautionary notes on using this model are discussed in Exercise 7.9.9.
Exercise 7.9.10 discusses a weighted regression. The next example serves as an illustration of regression through the origin.
Example 7.4.1 (Crystal Data).
Hettmansperger and McKean (2011) discuss a dataset4 where regression through the origin was deemed important. The response variable y is the weight of a crystalline form of a certain chemical compound and the independent variable x is the length of time that the crystal was allowed to grow. For convenience, we display the data in Table 7.2.
Crystal Data.
Time (hours) |
2 |
4 |
6 |
8 |
10 |
12 |
14 |
Weight (grams) |
0.08 |
1.12 |
4.43 |
4.98 |
4.92 |
7.18 |
5.57 |
Time (hours) |
16 |
18 |
20 |
22 |
24 |
26 |
28 |
Weight (grams) |
8.40 |
8.881 |
10.81 |
11.16 |
10.12 |
13.12 |
15.04 |
The following code segment computes the rank-based fit of this model (the responses are in the vector y and the vector for the independent variable is in x). Note that x is the designed matrix used and that there is no weight argument (the default identity matrix is used). Figure 7.10 contains the scatterplot of the data overlaid by the rank-based fit.

> wtedfit <- wtedrb(x,y)
> wtedfit$bstar
[, 1]
[1,] 0.5065172
> wtedfit$se
[1] 0.02977037
The rank-based estimate of slope is 0.507 with a standard error of 0.030; hence, the result is significantly different from 0.
Remark 7.4.1.
Weighted rank-based estimates can be used to fit general linear models where the variance of the random errors is an n × n matrix Σ > 0. In this case the weight matrix is Σ−1/2, where and Λ and Γ are respectively the diagonal matrix of eigenvalues and eigenvectors of Σ. Generally in practice, Σ has to be estimated; see Bilgic (2012) for such an iterated reweighted procedure for hierarchical linear models. Dixon and McKean (1996) and Carroll and Ruppert (1982) developed robust (R and M, respectively) for iteratively estimating the regression coefficients and the weights when Σ is diagonal and the form of the heteroscedasticity is known; for example, when scale varies directly with response.
7.5 Linear Models with Skew Normal Errors
The family of skew normal distributions consists of left and right skewed distributions along with the normal distribution. The pdfs in this family are of the form
where the parameter α satisfies –∞ < α < ∞ and φ(x) and Φ(x) are the pdf and cdf of a standard normal distribution, respectively. If a random variable X has this pdf, we say that X has a standard skew normal distribution with parameter α and write X ~ SN (α). If α = 0, then X has a standard normal distribution. Further X is distributed left skewed if α < 0 and right skewed if α > 0. This family of distributions was introduced by Azzalini (1985), who discussed many of its properties. We are interested in using this family of distributions for error distributions in the linear model,
where e = bϵi, where ϵi ~ SN(α), for some –∞ < α < ∞, and the scale parameter b > 0. We next discuss rank-based fits and inference for such models; see McKean and Kloke (2014) for more information.
Since these fits are scale equivariant, there is no need to estimate the scale parameter b. Likewise, for inference on the vector of parameters ß there is no need to estimate the shape parameter α. Wilcoxon scores could be used or the bent scores designed for skewed error distributions. However, to get an idea of what scores to consider, we next discuss the optimal scores for a specified α.
To obtain the optimal rank-based scores, because of equivariance, we need only the form (down to scale and location) of the pdf. So for the derivation of the scores, assume that the random variable X ~ SN (α) with pdf (7.20). Then as Exercise 7.9.12 shows:
Denote the inverse of the cdf of X by F−1(u;α). Then the optimal score function for X is
For all values of α, this score function is strictly increasing over the interval (0,1); see Azzalini (1985). As expected, for α = 0, the scores are the normal scores introduced in Chapter 3. Due to the first term on the right-side of expression (7.23), all the score functions in this family are unbounded, indicating that the skew normal family of distributions is light-tailed. Thus the influence functions of the rank-based estimators based on scores in this family are unbounded in the Y-space and, hence, are not robust. Recall in our discussion of the normal scores (α = 0), which are optimal for normal pdfs, that the corresponding rank-based estimator is technically robust. The sensitivity analysis of Section 7.5.1 confirms this technical robustness for the skew normal scores, also.
We also need the derivative of (7.23) to complete the installation of these scores in scores. Let l(x) denote the function defined in expression (7.22). Then as Exercise 7.9.14 shows, the derivative of the optimal score function is
where
Hence, to install this class of scores in Rfit, we only need the computation of the quantiles F−1(u; α). Azzalini (2014) developed the R package sn which computes the quantile function F−1(u; α) and, also, the corresponding pdf and cdf. The command qsn(u,alpha=alpha) returns F−1(u; α), for 0 < u < 1. We have added the class skewns to the book package npsm. Figure 7.11 displays these skew normal scores for α = –7,1, and 5 in the right panels of the figure and the corresponding pdf in the left panels.

These plots display the pdfs of the three skew normal distributions with shape parameter α = −7,1, and 5, along with the corresponding optimal scores.
Note that the pdf for α = −7 is left skewed while those for positive α values are right skewed. Unsurprisingly, the pdf for α = 1 is closer to symmetry than the pdfs of the others. The score function for the left-skewed pdf emphasizes relatively the right-tails over the left-tails, while the reverse is true for the right-skewed pdfs.
7.5.1 Sensitivity Analysis
For the sensitivity analysis, we generated n = 50 observations from a linear model of the form yi = xi + ei, where xi has a N(0,1) distribution and ei has a N(0,102) distribution. The xis and eis are all independent. The generated data can be found in the data file sensxy. We added outliers of the form
where Δ ranges through the values in the top row of Table 7.3. For an estimator , its sensitivity curve at Δ is
Values of the Sensitivity Function for the mle.
Δ |
0 |
20 |
40 |
60 |
80 |
100 |
1000 |
2000 |
mle |
0.00 |
–0.07 |
–0.07 |
–0.00 |
0.12 |
0.30 |
–5.80 |
–6.32 |
where and denote the estimates of β on the original and modified data (7.25), respectively. We obtained sensitivity curves for the estimators: Wilcoxon, normal scores, skew normal (α = 3), skew normal (α = 5), skew normal (α = 7), and maximum likelihood estimates (mle). The mles were computed by the package sn. The following code segment illustrates setting of the parameter in skewns:
> s5 <- skewns; s5@param <- c(5)
That is, we first obtain a copy of the skew normal scores object (skewns) and then we set the value of the α parameter to 5.
For all values of Δ, the changes in all of the the rank-based estimates were less than 0.004. Thus the rank-based skew-normal estimators, including the normal scores estimator, exhibited technical robustness for this study. On the other hand, the mle was sensitive to the values of Δ. We show these changes in Table 7.3; hence, for this study, the mle was not robust.
7.5.2 Simulation Study
We conclude this section with the results of a small simulation study concerning rank-based procedures based on skew normal scores. The model simulated is
where xi is distributed N(0,1); ei is distributed from a selected error distribution; i = 1,..., 100; the xis and eis are all independent; and the variable ci is a treatment indicator with values of either 0 or 1. We selected two error distributions for the study. One is a skew normal distribution with shape parameter α = 5 while the other is a contaminated version of a skew normal. The contaminated errors are of the form
where Wi has a skew normal distribution with shape parameter α = 5, Vi has Wi has a skew normal distribution with shape parameter distribution, Iϵ,i has a binomial (1, ϵ = 0.15) distribution, and Wi,Vi, and Iϵ,i are all independent. This contaminated distribution is skewed with heavy right-tails. The design is slightly unbalanced with n1 = 45 and n2 = 55. Without loss of generality β, θ, and β0 were set to 0.
For procedures, we selected 7 rank-based procedures based on skew normal scores with the respective values of α set at 2, 3,..., 8; the Wilcoxon procedure; and the mle procedure. Hence, the asymptotically efficient rank-based procedure (score with α = 5) is one of the selected procedures. The empirical results presented are the empirical AREs, which for each estimator is the ratio of the empirical mean-square error (MSE) of the mle to the empirical MSE of the estimator; hence, values of this ratio less than 1 are favorable to the mle while values greater than 1 are favorable to the estimator. Secondly, we present the empirical confidence coefficients for nominal 95% confidence intervals. For all the procedures, we chose asymptotic confidence intervals of the form . We used a simulation size of 10,000.
The results are presented in Table 7.4. For the skew normal errors, for both parameters β and θ, all the rank-based estimators except the Wilcoxon estimator are more efficient than the mle estimator. Note that the most efficient estimator for both β and θ is the rank-based estimator based on the score function with α = 5; although, the result is not significantly different than the results for a few of the nearby (α close to 5) rank-based estimators. In terms of validity the empirical confidences of all the rank-based estimators are close to the nominal confidence of 0.95. In this study the mle is valid, also.
Summary of Results of Simulation Study of Rank-Based Procedures and the Maximum Likelihood Procedure for the Skew Normal Distribution with Shape α = 5 and a Skew Normal Contaminated Distribution.
Skew Normal Errors |
Contaminated Errors |
|||||||
|---|---|---|---|---|---|---|---|---|
β |
θ |
β |
θ |
|||||
Proced. |
ARE |
Conf. |
ARE |
Conf. |
ARE |
Conf. |
ARE |
Conf. |
rb α = 2 |
1.02 |
0.96 |
1.04 |
0.96 |
6.61 |
0.98 |
10.84 |
0.98 |
rb α = 3 |
1.09 |
0.96 |
1.11 |
0.96 |
7.43 |
0.97 |
12.24 |
0.98 |
rb α = 4 |
1.13 |
0.96 |
1.15 |
0.96 |
7.79 |
0.97 |
12.91 |
0.98 |
rb α = 5 |
1.14 |
0.96 |
1.16 |
0.96 |
7.85 |
0.96 |
13.10 |
0.97 |
rb α = 6 |
1.13 |
0.95 |
1.16 |
0.96 |
7.73 |
0.96 |
13.02 |
0.97 |
rb α = 7 |
1.11 |
0.95 |
1.14 |
0.95 |
7.49 |
0.95 |
12.72 |
0.97 |
rb α = 8 |
1.09 |
0.95 |
1.12 |
0.95 |
7.17 |
0.95 |
12.30 |
0.96 |
rb Wil. |
0.78 |
0.95 |
0.79 |
0.95 |
4.70 |
0.96 |
7.56 |
0.97 |
mle |
1.00 |
0.93 |
1.00 |
0.93 |
1.00 |
0.96 |
1.00 |
0.99 |
For the contaminated error distribution, the rank-based estimators are much more efficient than the mle procedure. Further, the estimator with scores based on α = 5 is still the most empirically powerful in the study. It has empirical efficiency of 785% relative to the mle for β and 1310% for θ. All the rank-based procedures based on skew normal scores display technical robustness in this study. Even the Wilcoxon procedure is over 400% more efficient than the mle.
7.6 A Hogg-Type Adaptive Procedure
Score selection was discussed in Section 3.5.1 for the two-sample problem. The two-sample location model, though, is a linear model (see expression (3.23)); hence, the discussion on scores in Chapter 3 pertains to regression models of this chapter also. Thus, for Model (7.1) if we assume that the pdf of the distribution of the errors is , where f0 is known and a and b are not, then the scores generated by the score function
lead to fully efficient rank-based estimates (asymptotically equivalent to maximum likelihood estimates). For example, if we assume that the random errors of Model (7.1) are normally distributed then rank-based fits based on normal scores are asymptotically equivalent to LS estimates. Other examples are discussed in Sections 7.5 and 3.5.1. Further, a family of score functions for log-linear models is discussed in Section 6.4.
Suppose, though, that we do not know the form. Based on the derivation of the optimal scores (7.29) given in Hettmansperger and McKean (2011), estimates based on scores “close” to the optimal scores tend to have high efficiency. A practical approach is to select a family of score functions which are optimal for a rich class of distributions and then use a data driven“selector” to choose a score from this family for which to obtain the rank-based fit of the linear model. We call such a procedure a data driven adaptive scheme. This is similar to Hogg’s adaptive scheme for the two-sample problem (see Section 3.6), except our interest here is in obtaining a good fit of the linear model and not in tests concerned with location parameters.
Adaptive schemes should be designed for the problem at hand. For example, perhaps it is clear that only right skewed distributions for the random errors need to be considered. In this case, the family of scores should include scores appropriate for right skewed distributions.
For discussion, we consider a generic Hogg-type adaptive scheme designed for light to heavy tailed distributions which can be symmetric or skewed (both left and right). The scheme utilizes the class of bent (Winsorized Wilcoxons) scores discussed in detail in Section 3.5.1. As discussed in Chapter 3, the four types of bent scores are appropriate for our family of distributions of interest. For example, consider the bentscores4. These are optimal for distribution with a“logistic” middle and “exponential” tails. Scores corresponding to heavier tailed distributions have larger intervals where the score function is flat. Such scores are optimal for symmetric distributions if the bends are at c and 1 – c, for 0 < c < (1/2); else, they are optimal for skewed distributions. If the distribution has a longer right than left tail then correspondingly the optimal score will have a longer flat interval on the right than on the left.
For our scheme, we have selected the nine bent scores which are depicted in Figure 7.12. The scores in the first column are for left skewed distributions, those in the second column are for symmetric distributions, while those in the third column are for right skewed distributions. The scores in the first row are for heavy tailed distributions, those in the second row are for moderate tailed distributions, and those in the third row are for light tailed distributions.

Recall that our goal is to fit a linear model; hence, the section of the score must be based on the residuals from an initial fit. For the initial fit, we have have chosen to use the Wilcoxon fit. Wilcoxon scores are optimal for the logistic distribution which is symmetric and of moderate tail weight, slightly heavier tails than those of a normal distribution. Let , denote the vector of Wilcoxon residuals. As a selector, we have chosen the pair of statistics (Q1, Q2) proposed by Hogg. These are defined in expression (3.47) of Chapter 3. For the reader’s convenience, we restate them here:
where U0.05 is the mean of the Upper 5%, M0.5 is the mean of the Middle 50%, and L0.05 is the mean of the Lower 5% of the residuals . Recall that Q1 is a measure of skewness while Q2 is a measure of tail heaviness.
Cutoff values for the selection are required. In an investigation of this adaptive scheme for linear models, based on large simulation studies, Shomrani (2003) developed the following cutoff values:
Note that the scores are numbered 1 through 9 in Figure 7.12. Using these numbers, the scheme’s selected score is:
We have written an auxiliary R function adaptor which computes this adaptive scheme. The response vector Y and design matrix X form the input while the output includes both the initial (Wilcoxon) and selected fits, the scores selected and, for convenience, the number of the selected score. We illustrate its computation with the following examples.
Example 7.6.1 (Adaptive Scheme on Generated Exponential Errors).
The first example consists of simulated data. We consider a regression model with two predictors each having a N(0, 1) distribution and with sample size n = 40. For an error distribution, we chose an exponential distribution. We set all regression coefficients to 0, so that the model generated is:
The following code segment computes the adaptive scheme for this dataset. It shows the respective summaries of the selected score fit and the Wilcoxon fit. The data are in the dataset adapteg.
> adapt <- adaptor(xmat,y)
> summary(adapt$fitsc)
Call:
rfit.default(formula = y ˜ xmat, scores = sc, delta = delta,
hparm = hparm)
Coefficients:
Estimate Std. Error t.value p.value
(Intercept) 0.607964 0.220940 2.7517 0.009127 **
xmat1 -0.082683 0.095334 -0.8673 0.391372
xmat2 0.028687 0.098423 0.2915 0.772319
–––
Signif. codes: 0 ‘***‘ 0.001 ‘**’ 0.01 ‘*‘ 0.05 ‘.’ 0.1 ‘ ’ 1
Multiple R-squared (Robust): 0.02974727
Reduction in Dispersion Test: 0.5672 p-value: 0.57197
> adapt$iscore
[1] 9
> summary(adapt $fitwil)
Call :
rfit.default(formula = y ˜ xmat, delta = delta, hparm = hparm)
Coefficients:
Estimate Std. Error t.value p.value
(Intercept) 0.63612 0.22885 2.7796 0.008503 **
xmat1 -0.13016 0.14136 -0.9208 0.363142
xmat2 0.10842 0.14594 0.7429 0.462239
–––
Signif. codes: 0 ‘***‘ 0.001 ‘**’ 0.01 ‘*‘ 0.05 ‘.’ 0.1 ‘ ’ 1
Multiple R-squared (Robust): 0.04619702
Reduction in Dispersion Test: 0.89604 p-value: 0.41686
> precision <- (adapt$fitsc$tauhat/adapt$fitwil$tauhat)^2
> precision
[1] 0.4547999
In this case the adaptive scheme correctly chose score function #9; i.e., it selected the score for right-skewed error distributions with heavy tails. The ratio of the squared ’s (the selected score function to the Wilcoxon score function) is 0.456; hence the selected fit is more precise in terms of standard errors than the Wilcoxon fit.
For our second example we chose a real dataset.
Example 7.6.2 (Free Fatty Acid Data).
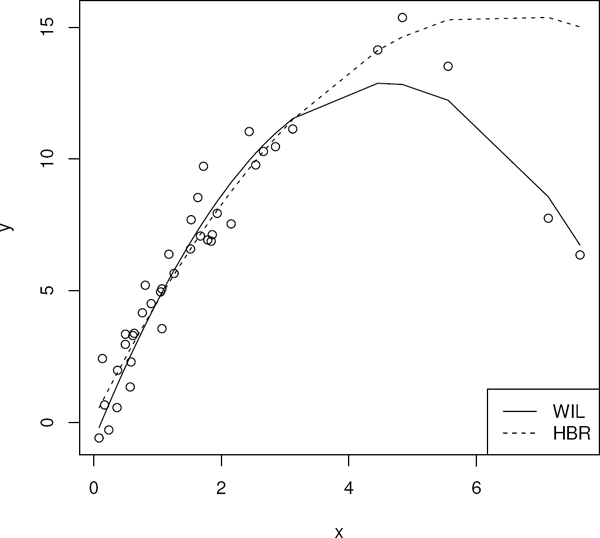
In this dataset (ffa), the response is the free fatty acid level of 41 boys while the predictors are age (in months), weight (lbs), and skin fold thickness. It was initially discussed on page 64 of Morrison (1983) and more recently in Kloke and McKean (2012). The Wilcoxon Studentized residual and q−q plots are shown in the top panels of Figure 7.13. Note that the residual plot indicates right skewness which is definitely confirmed by the q–q plot. For this dataset, our adaptive scheme selected score function #8, bentscores2, with bend at c = 0.75, (moderately heavy tailed and right-skewed), which confirms the residual plot. The bottom panels of Figure 7.13 display the Studentized residual and q−q plots based on the fit from the selected scores.
Wilcoxon (top pair) and the selected score (bottom pair) Studentized residual plots for Example 7.6.2.
For the next code segment the R matrix xmat contains the three predictors while the R vector ffalev contains the response. The summaries of both the initial Wilcoxon fit and the selected score fit are displayed along with the value of the precision.
> adapt <- adaptor(ffalev,xmat)
> summary(adapt$fitwil)
Call:
rfit.default(formula = y ˜ xmat, delta = delta, hparm = hparm)
Coefficients:
Estimate Std. Error t.value p.value
(Intercept) 1.4900402 0.2692512 5.5340 2.686e-06 ***
xmatage -0.0011242 0.0026348 -0.4267 0.6720922
xmatweight -0.0153565 0.0038463 -3.9925 0.0002981 ***
xmatskinfold 0.2749014 0.1342149 2.0482 0.0476841 *
–––
Signif. codes: 0 ‘***‘ 0.001 ‘**’ 0.01 ‘*‘ 0.05 ‘.’ 0.1 ‘ ’ 1
Multiple R-squared (Robust): 0.3757965
Reduction in Dispersion Test: 7.42518 p-value: 0.00052
> summary(adapt$fitsc)
Call :
rfit.default(formula = y ˜ xmat, scores = sc, delta = delta,
hparm = hparm)
Coefficients:
Estimate Std. Error t.value p.value
(Intercept) 1.41842877 0.23879002 5.9401 7.569e-07 ***
xmatage -0.00078542 0.00232485 -0.3378 0.737394
xmatweight -0.01538936 0.00339386 -4.5345 5.882e-05 ***
xmatskinfold 0.32728635 0.11842685 2.7636 0.008856 **
–––
Signif. codes: 0 ‘***‘ 0.001 ‘**’ 0.01 ‘*‘ 0.05 ‘.’ 0.1 ‘ ’ 1
Multiple R-squared (Robust): 0.397609
Reduction in Dispersion Test: 8.14063 p-value: 0.00027
> precision <- (adapt$fitsc$tauhat/adapt$fitwil$tauhat)^2
> precision
[1] 0.778572
Note that the precision estimate is 0.779, so the analysis based on the selected score is more precise than the initial Wilcoxon analysis. For example, the regression coefficient for the predictor skin fold thickness is highly significant for the bent score fit; while, for the Wilcoxon fit it is significant at the 5% level.
Remark 7.6.1.
Kapenga and McKean (1989) and Naranjo and McKean (1997) developed estimators for the score function φ(u) based on residuals from a fit of the linear model. These and several other adaptive schemes including the Hogg-type scheme discussed above were compared in a large Monte Carlo study by Shomrani (2003). These schemes are ultimately for fitting the linear model and they are all based on residuals. So not surprisingly, their associated inference is somewhat liberal. In Al-Shomrani’s study, however, the Hogg-type scheme was less liberal than the other schemes in the study. In general the Hogg-type scheme outperformed the others in terms of validity and empirical power. Okyere (2011) extended the Hogg-type scheme to mixed linear models.
7.7 Nonlinear
In this section we present example code to obtain Wilcoxon estimates for the general nonlinear regression problem. The model that we consider is
where θ is a k × 1 vector of unknown parameters, yi is a response variable, and xi is a p × 1 vector of explanatory variables.
As a simple working example consider the simple nonlinear model
Suppose the errors are normally distributed. Setting n = 25, θ = 0.5, and using uniformly distributed x’s, a simulated example of this model is generated by the next code segment. Figure 7.14 displays a scatterplot of the data.

> n<-25
> theta<-0.5
> x<-runif(n,1,5)
> f<-function(x,theta) {exp(theta*x)}
> y<-f(x,theta)+rnorm(n,sd=0.5)
The rank-based fit of Model (7.33) is based on minimizing the same norm that was used for linear models. That is, for a specified score function φ(u), the rank based estimate of θ is
where Y is the n × 1 vector and the components of f (θ; x) are the f (θ; xi)s. For the traditional LS estimate, the squared-Euclidean norm is used instead of || • ||φ. The properties of the rank-based nonlinear estimator were developed by Abebe and McKean (2007). More discussion of these rank-based estimates can be found in Section 3.14 of Hettmansperger and McKean (2011), including the estimator’s influence function. Based on this influence function, the rank-based estimator is robust in the Y-space but not in the x-space. The nonlinear HBR estimator developed by Abebe and McKean (2013) is robust with bounded influence in both the Y-space and the x-spaces. As in the case of linear models, the HBR estimator minimizes the weighted Wilcoxon norm; we recommend the high breakdown weights given in expression (7.9).
In this section, we discuss the Wilcoxon fit of a nonlinear model. The discussion for the HBR fit is in Section 7.7.4. We begin by discussing a simple Newton algorithm for the estimator and its subsequent computation using Rfit. For nonlinear fitting, the usual computational algorithm is a Gauss-Newton type procedure, which is based on a Taylor series expansion of f (θ; x).
Let be an initial estimate of θ. The Jacobian at θ is the n × k matrix
The expansion of f (θ) about is
where . Hence, an approximation to the norm is
Note that the quantity within the braces on the right side defines a linear model with the the quantity in brackets serving as the dependent variable, serving as the design matrix, and Δ(θ) serving as the vector of regression coefficients. For this linear model, let be the rank-based estimate of Δ. Then the first step estimate of θ is
Usually at this point of the algorithm, convergence is tested based on the relative increments in the estimates and the dispersion function. If convergence has not been achieved then is replaced by and the next step proceeds similar to the first step.
Often there is no intercept in the nonlinear model. In this case, the steps in the above algorithm consist of regressions through the origin. For rank-based estimation this is handled by the adjustment described in Section 7.4. Our R code for the ranked-based nonlinear fit, discussed in Section 7.7.2, automatically makes this adjustment. First, we discuss implementation of the rank-based nonlinear procedure.
7.7.1 Implementation of the Wilcoxon Nonlinear Fit
Consider the rank-based fit of the general nonlinear model (7.33) using Wilcoxon scores. Let denote the estimator (7.35). As shown in Abebe and McKean (2007), under general conditions, the asymptotic variance-covariance matrix of is given by
where J (θ) is the Jacobian evaluated at the true vector of parameters θ and τW is the scale parameter given in expression (3.19). The only difference for the asymptotic variance of the LS estimator is that the variance of the random errors, σ2, replaces . Hence, the asymptotic relative efficiency (ARE) of the Wilcoxon estimator relative to the LS estimator is ; i.e., the same ARE as in linear models. In particular, at normal errors this relative efficiency is 0.955.
Provided the Jacobian is a continuous function of θ, is a consistent estimator of J(θ)TJ(θ). Further, the same estimator of τW that we used in the linear model case (Koul et al. (1987)) but here based on the residuals is a consistent estimator of τ. Thus, the vector of standard errors of is
Note for future reference, these standard errors are essentially the standard errors of the approximate linear model on the last step of the Gauss–Newton algorithm.
7.7.2 R Computation of Rank-Based Nonlinear Fits
We have written R software for the computation of the nonlinear rank-based estimates which utilizes the Gauss–Newton algorithm described above. Currently, it has options for the Wilcoxon and HBR fits. The function is wilnl and is included in the package rbnl.5 Its defining R statement with default values is
wilnl = function(x,y,theta0,fmodel,jmodel,numstp=50,
eps=.001,wts.type=“WIL”,
intest=“HL”,intercept=FALSE)
Definitions of these arguments are:
- y is the n × 1 vector of responses and x is the n × p matrix of predictors.
- thetaO is the initial estimate (starting value) of θ. The routine assumes it to be a k×1 matrix.
- fmodel and jmodel are user supplied R functions, one for the model and the other for the Jacobian. The arguments to these functions are matrices. These are described most easily by the ensuing discussion of examples.
- numstp and eps are the total number of Newton steps and the tolerance for stopping, respectively.
- wts.type=“WIL” or wts.type=“HBR” obtain, respectively, in this case, the Wilcoxon or the HBR rank-based nonlinear fits.
- The rank-based algorithm uses an estimate of a (pseudo) intercept. It is either the Hodges-Lehmann estimate, intest=“HL” or the medium, intest=“MED”. We recommend the default value intest=“HL”, which generally leads to more efficient estimates, unless the data are highly skewed. In the later case we recommend the medium.
- Generally, nonlinear models do not have an intercept parameter. For such models, set the argument int at its default value, i.e., int=“NO”. Occasionally, models do contain an intercept and, for these models, set int the value int=“YES”. For models containing an intercept, one column of the Jacobian matrix consists of ones. In the user supplied Jacobian function, make this the first column of the Jacobian.
The returned list file includes the following items of interest: the estimate of θ, $coef; the standard errors of the estimates, $se; the estimate of the scale parameter τ, $tauhat; the residuals, $resid; and the results of each step, $coll, (the step values of θ and ).
The user supplied functions are most easily described by discussing a few examples. Consider first the simple working model (7.34). Recall that the nonlinear function is f(θ,x) = exp{θx}. The arguments are matrices x and theta. In the example x is 25 × 1 and theta is 1 × 1. The following model function, expmod, suffices:
expmod <- f unction (x, theta) {exp(x%*%theta)}
For the Jacobian there is only one partial derivative given by ∂f/∂θ = x exp{θx}. Hence our Jacobian function, expjake, is
expjake <- f unction (x,theta){x*exp(x%*%theta)}
The analysis of a simple dataset follows in the next example.
7.7.3 Examples
Example 7.7.1 (Computation of Rank-Based Estimates for Model (7.34)).
The following rounded data are a generated realization of the Model (7.34).
x |
4.4 |
4.3 |
1.4 |
2.2 |
3.1 |
4.2 |
2.0 |
3.1 |
4.0 |
1.9 |
2.9 |
1.4 |
3.2 |
y |
8.4 |
8.4 |
1.8 |
3.2 |
4.3 |
7.6 |
3.3 |
4.8 |
7.5 |
2.4 |
4.0 |
1.9 |
6.0 |
x |
2.5 |
4.4 |
3.6 |
4.3 |
1.5 |
1.0 |
4.1 |
1.1 |
1.9 |
4.0 |
1.1 |
2.2 |
|
y |
3.6 |
8.5 |
5.3 |
8.8 |
1.4 |
1.8 |
7.1 |
1.4 |
2.9 |
7.3 |
2.6 |
2.3 |
For the following code segment, the 25 × 1 matrix x contains the x values while the vector y contains the y values. As a starting value, the true parameter θ = 0.5 is used. For comparison, we computed the LS fit of this nonlinear model using the R function nls.
> expmod <- function(x,theta){exp(x%*%theta)}
> expjake <- function(x,theta){x*exp(x%*%theta)}
> fitwil <- wilnl(x,y,0.5,expmod,expjake)
> fitwil
Call :
wilnl(x = x, y = y, theta0 = 0.5, fmodel = expmod,
jmodel = expjake)
Coefficients:
[, 1]
[1,] 0.49042
> summary(fitwil)
Call :
wilnl(x = x, y = y, theta0 = 0.5, fmodel = expmod,
jmodel = expjake)
Coefficients :
Estimate Std. Error t.value
[1,] 0.4904200 0.0050235 97.625
Number of iterations: 2
> fitls <- nls(y˜ exp(x*theta),start=list(theta=0.5))
> summary(fitls)
Formula: y ˜ exp(x * theta)
Parameters:
Estimate Std. Error t value Pr(>|t|)
theta 0.491728 0.004491 109.5 <2e-16 ***
–––
Signif. codes: 0 ‘***‘ 0.001 ‘**’ 0.01 ‘*‘ 0.05 ‘.’ 0.1 ‘ ’ 1
Residual standard error: 0.4636 on 24 degrees of freedom
Number of iterations to convergence: 2
Achieved convergence tolerance: 5.876e-06
The Wilcoxon and LS results are quite similar which is to be expected since the error distribution selected is normal. The Wilcoxon algorithm converged in three steps.
For a second example, we altered this simple model to include an intercept.
Example 7.7.2 (Rank-Based Estimates for Model (7.34) with an Intercept).
Consider the intercept version of Model (7.34); i.e., f(θ;x) = θ1+ exp{θ2x}. For this example we set θ1 = 2. We use the same data as in the last example, except that 2 is added to all the components of the vector y. The code segment follows. Note that both the model and Jacobian functions have been altered to include the intercept. As starting values, we chose the true parameters θ1 = 2 and θ2 = 0.5.
> y <- y + 2
> expmod <- function(x,theta){theta[1]+exp(x%*%theta[2])}
> expjake <- function(x,theta){cbind(rep(1,length(x[,1])),
+ x*exp(x%*%theta[2]))}
> fitwil = wilnl(x,y,as.matrix(c(2,.5),ncol=1), expmod,
+ expjake,intercept=TRUE)
> fitwil
Call :
wilnl(x = x, y = y, theta0 = as.matrix(c(2, 0.5), ncol = 1),
fmodel = expmod, jmodel = expjake, intercept = TRUE)
Coefficients:
[, 1]
[1,] 2.0436573
[2,] 0.4887782
> summary(fitwil)
Call :
wilnl(x = x, y = y, theta0 = as .matrix(c(2, 0.5), ncol = 1),
fmodel = expmod, jmodel = expjake, intercept = TRUE)
Coefficients :
Estimate Std. Error t.value
[1,] 2.0436573 0.1636433 12.489
[2,] 0.4887782 0.0080226 60.925
Number of iterations: 2
Note that the Wilcoxon estimate of the intercept is close to the true value of 2. For both parameters, the asymptotic 95% confidence intervals (±1.96SE) trap the true values.
The 4 Parameter Logistic Model
The 4 parameter logistic is a nonlinear model which is often used in pharmaceutical science for dose-response situations. The function is of the form
where x is the dose of the drug and y is the response. The exponent b is assumed to be negative; hence, as x → 0 (0 concentration) y → d and as x → ∞ (full concentration) y → a. So a and d are the expected values of the response under minimum and maximum concentration of the drug, respectively. It follows that the value of (a + d)/2 is the 50% response rate and that this occurs at x = c. In terms of biological assays, the value c is called the IC50, the amount of concentration of the drug required to inhibit a biological process by 50%. See Crimin et al. (2012) for discussion of this model and the robust Wilcoxon fit of it.
Usually in pharmaceutical science the dose of the drug is in log base 10 units. Also, this is an intercept model. Let z = log10 x and, to isolate the intercept, let s = a–d. Then the 4 parameter logistic model can be equivalently expressed as
In this notation, as z → –∞, E(Yi) → d and as z → ∞, E(Yi) → a. Figure 7.15 shows the LS and Wilcoxon fits of this model for a realization of the model discussed in Example 7.7.3. From this scatterplot of the data, guesstimates of the asymptotes a and d and the IC50 c are readily obtained for starting values. For the Jacobian, the four partial derivatives of the model function f are given by

Scatterplot of 4 parameter logistic data overlaid by Wilcoxon (W) and least squares (LS) nonlinear fits.
In the next example, we obtain the robust fit of a realization of Model 7.43.
Example 7.7.3 (The 4 Parameter Logistic).
We generated a realization of size n = 24 from Model (7.43) with doses ranging from 0.039 to 80 with two repetitions at each dose. The data are in the set eg4parm. For this situation, normal random errors with standard deviation one were generated. The parameters were set at a = 10, b = −1.2, c = 3, and d = 110; hence, s = −100. The scatterplot of the data is displayed in Figure 7.15. The functions for the model and the Jacobian are displayed in the next code segment. This is followed by the computation of the LS and Wilcoxon fits. These fits are overlaid on the scatterplot of Figure 7.15. The segment of code results in a comparison of the LS and Wilcoxon estimates of the coefficients and their associated standard errors. Note that the parameter s was fit, so a transformation is needed to obtain the estimates and standard errors of the original parameters.
> func <- function(z,theta){
+ d = theta[1]; s = theta[2]; c = theta[3]; b = theta[4]
+ func <- (s/(1 + exp(b*(z*log(10) - log(c))))) + d
+ func
+}
> jake = function(z,theta){
+ d = theta[1]; s = theta[2]; c = theta[3]; b = theta[4]
+ xp = 1 + exp(b*(z*log(10) - log(c)))
+ fd = 1; fs = 1/xp
+ fc = s*(xp^(-2))*((b/c)*exp(b*(z*log(10) - log(c))))
+ fb = -s*(xp^(-2))*((z*log(10) - log(c))*exp(b*(z*log(10) - log(c))))
+ jake = cbind(fd,fs,fc,fb); jake
+}
> fitwil = wilnl(z,y, theta0,func,jake,intercept=TRUE)
> summary(fitwil)
Call:
wilnl(x = z, y = y, theta0 = theta0, fmodel = func,
jmodel = jake, intercept = TRUE)
Coefficients:
Estimate Std. Error t.value
fd 105.81755 5.60053 18.8942
-95.07300 10.31646 -9.2157
3.55830 0.83385 4.2673
-1.81164 0.68261 -2.6540
Number of iterations: 7
> fitls <- nls(y˜ (s/(1 + exp(b*(z*log(10) - log(c))))) + d,
+ start=list(b =-1.2, c = 3,d = 110,s = -100))
> summary(fitls)
Formula: y ˜ (s/(1 + exp(b * (z * log(10) - log(c))))) + d
Parameters:
Estimate Std. Error t value Pr(>|t|)
b -2.1853 0.8663 -2.523 0.020230 *
c 3.0413 0.6296 4.831 0.000102 ***
d 105.4357 5.4575 19.319 2.09e-14 ***
s -93.0179 9.2404 -10.066 2.83e-09 ***
–––
Signif. codes: 0 ‘***‘ 0.001 ‘**’ 0.01 ‘*‘ 0.05 ‘.’ 0.1 ‘ ’ 1
Residual standard error: 16.02 on 20 degrees of freedom
Number of iterations to convergence: 11
Achieved convergence tolerance: 4.751e-06
> resid = fitwil$residuals
> yhat = fitwil$fitted.values
> ehatls <- summary(fitls)$resid
> yhatls <- y -ehatls
Note that the LS fit has been impacted by the outlier with the log10 dose at approximately 0.7. The LS function nls interchanged the order of the coefficients. The standard errors of the LS estimates are slightly less.
To demonstrate the robustness of the Wilcoxon fit, we changed the last response item from 11.33 to 70.0. The summary of the Wilcoxon and LS fits follows, while Figure 7.16 contains the scatterplot of the data and the overlaid fits.

Scatterplot of 4 parameter logistic changed data overlaid by Wilcoxon (W) and least squares (LS) nonlinear fits.
> summary(fitwil)
Call:
wilnl(x = z, y = y, theta0 = theta0, fmodel = func,
jmodel = jake, intercept = TRUE)
Coefficients:
Estimate Std. Error t.value
fd 105.01857 6.08552 17.2571
-89.58696 10.53863 -8.5008
3.35834 0.81774 4.1068
-2.20656 1.03166 -2.1388
Number of iterations: 3
> summary(fitls)
Formula: y ˜ (s/(1 + exp(b * (z * log(10) - log(c))))) + d
Parameters:
Estimate Std. Error t value Pr(>|t|)
b -6.4036 9.2048 -0.696 0.49464
c 2.9331 0.7652 3.833 0.00104 **
d 101.9051 5.7583 17.697 1.10e-13 ***
s -79.1769 9.2046 -8.602 3.73e-08 ***
–––
Signif. codes: 0 ‘***‘ 0.001 ‘**’ 0.01 ‘*‘ 0.05 ‘.’ 0.1 ‘ ’ 1
Residual standard error: 19.8 on 20 degrees of freedom
Number of iterations to convergence: 32
Achieved convergence tolerance: 7.87e-06
>
As Figure 7.16 shows, the LS fit was impaired by the outlier. The LS estimates of the parameters a and d changed by over a standard error and the LS estimate for b changed by 3 standard errors. On the other hand, the change in the Wilcoxon estimates was much less.
7.7.4 High Breakdown Rank-Based Fits
As we mentioned earlier the Wilcoxon nonlinear estimator is much less sensitive to outliers in the response Y -space than the LS estimators, but, similar to LS, it is sensitive to outliers in the factor x-space. The weighted Wilcoxon HBR estimator, though, is not sensitive to such outliers. For Model (7.33), this estimator is given by
where ||⋅||HBR is the weighted norm given in expression (7.6). In our discussion, we use the high breakdown weights discussed in Section 7.2. Under general conditions, Abebe and McKean (2013) developed the asymptotic properties of the estimator including its asymptotic variance-covariance matrix. The Newton-type algorithm discussed for the rank-based estimators above works for the HBR estimator, also.
Computation of the HBR estimator is handled by the function wilnl using wts=“HBR” as the argument for weights. As with the Wilcoxon nonlinear estimator, a consistent estimator of the variance-covariance matrix of the HBR estimator is obtained from the last linear step. The adjustment for the regression through the origin is handled similar to the Wilcoxon nonlinear estimator and, as with the Wilcoxon, the intercept estimator can be either the median of the residuals int=“MED” or the Hodges–Lehmann int=“HL”. We demonstrate the computation for the our simple working example.
Example 7.7.4 (HBR Estimator for Example 7.7.1).
The following code segment uses the same data as in Example 7.7.1. In particular the 25 × 1 R matrix x contains the independent variable and the 25 × 1 R vector y contains the dependent variable.
> expmod <- function(x,theta){exp(x%*%theta)}
> expjake <- function(x,theta){x*exp(x%*%theta)}
> fithbr = wilnl(x,y,0.5,expmod,expjake,wts.type=“HBR”)
> fithbr$coef
[, 1]
[1,] 0.4904202
>
For this data there are no outliers in the x-space, so the HBR and Wilcoxon fits coincide. To demonstrate the robustness of the HBR estimator to outliers in factor space, we changed the last value of x from 2.3 to 8.0. The results are
> x[25,1] <- 8.0
> fitwil <- wilnl(x,y,0.5,expmod,expjake,wts.type=“WIL”)
> fitwil$coef
[, 1]
[1,] 0.2864679
> fithbr <- wilnl(x,y,0.5,expmod,expjake,wts.type=“HBR”)
> fithbr$coef
[, 1]
[1,] 0.488722
> fitls <- nls(y˜ exp(x*theta),start=list(theta=0.5))
> fitls$coef
NULL
Note that the Wilcoxon estimate of θ changed (absolutely) by 0.2, while the HBR estimate remained about the same. Also, the LS fit did not converge.
The diagnostics, TDBETAS and CFITS, which differentiate among the LS, Wilcoxon, and HBR fits that were discussed for linear models in Section 7.3 extend straightforwardly to nonlinear models, including their benchmarks; see Abebe and McKean (2013) for details.
7.8 Time Series
Let {Xt} be a sequence of random variables observed over time, t = 1, 2,..., n. A regression model frequently used in practice is the autoregressive model. This is a time series model where the observation at time t is a function of past observations plus some random noise. In this section, we discuss rank-based procedures for general order p autoregressive models. A related model consists of a linear model with random errors that follow a time series. Some discussion on robust procedures for these types of models is discussed in Section 6.6.3 of Hettmansperger and McKean (2011).
We say that Xt follows an autoregressive time series of order p, Xt ~ AR(p), if
where , , , and Y0 is an observable random vector independent of e. The stationarity assumption requires that the solutions to the following equation,
lie in the interval (–1,1); see, for example, Box et al. (2008). We further assume that the components of e, et, are iid with cdf F(x) and pdf f(x), respectively.
Model (7.47) is a regression model with the tth response given by Xt and the tth row of the design matrix given by , . Obviously the time series plot, Xt versus t, is an important first diagnostic. Also lag plots of the form Xt versus Xt–j are informative on the order p of the autoregressive series. We discuss determination of the order later.
As in Chapter 3, let φ(u) denote a general score function which generates the score , . Then the rank-based estimate of ϕ is given by
where denotes the rank of among . Koul and Saleh (1993) developed the asymptotic theory for these rank-based estimates. Outlying responses, though, also appear on the right side of the model; hence, error distributions with even moderately heavy tails produce outliers in factor space (points of high leverage). With this in mind, the HBR estimates of Section 7.2 should also be fitted. The asymptotic theory for the HBR estimators for Model (7.46) was developed by Terpstra et al. (2000) and Terpstra et al. (2001); see, also, Chapter 5 of Hettmansperger and McKean (2011) for discussion.
The rank-based and HBR fits of the AR(p) are computed by Rfit. As simulations studies have confirmed, the usual standard errors from regression serve as good approximations to the asymptotic standard errors. Also, Terp-stra et al. (2003) developed Studentized residuals for rank-based fits based on an AR(1) model. They showed, though, that Studentized residuals from the rank-based fit of the regression model were very close approximations to the AR(1) Studentized residuals. In this section, we use the regression Studentized residuals. We have written a simple R function, lagmat, which returns the design matrix given the vector of responses and the order of the autoregressive series. We illustrate this discussion with a simple example of generated data.
Example 7.8.1 (Generated AR(2) Data).
In this example we consider a dataset consisting of n = 50 variates generated form an AR(2) model with ϕ1 = 0.6, ϕ2 = –0.3, and random noise which followed a Laplace distribution with median 0 and scale parameter 10. The time series is plotted in the upper panel of Figure 7.17. The following R code segment obtains the Wilcoxon fit of the AR(2) model.

The upper panel shows the time series plot of the generated AR(2) data, while the lower panel is a plot of the Studentized Wilcoxon residuals from the fit of the AR(2) model.
> data <- lagmat(ar2,2)
> x <- data [,1]
> lag1 <- data[,2]
> lag2 <- data[,3]
> wil <- rfit(x ˜ lag1 + lag2)
> summary(wil)
Call:
rfit.default(formula = x ˜ lag1 + lag2)
Coefficients:
Estimate Std. Error t.value p.value
(Intercept) -2.44173 2.97252 -0.8214 0.415731
lag1 0.70101 0.12115 5.7864 6.474e-07 ***
lag2 -0.36302 0.12280 -2.9563 0.004943 **
–––
Signif. codes: 0 ‘***‘ 0.001 ‘**’ 0.01 ‘*‘ 0.05 ‘.’ 0.1 ‘ ’ 1
Multiple R-squared (Robust): 0.399343
Reduction in Dispersion Test: 14.95899 p-value: 1e-05
> studresids <- rstudent(wil)
Note that the estimates of φ1 and φ2 are respectively 0.70 and −0.36 which are close to their true values of 0.6 and −0.3. With standard errors of 0.12, the corresponding 95% confidence intervals trap these true values. The lower panel of Figure 7.17 displays the plot of the Studentized Wilcoxon residuals. At a few time points the residual series is outside of the ±2 bounds, but these are mild discrepancies. The largest in absolute value has the residual value of about −4 at time 8. We next compute the HBR fit of the AR(2) model and obtain the diagnostic TDBETAS between the Wilcoxon and HBR fits.
> hbr <- hbrfit(x˜ cbind(lag1,lag2))
> summary(hbr)
Call:
hbrfit(formula = x ˜ cbind(lag1, lag2))
Coefficients:
Estimate Std. Error t.value p.value
(Intercept) -2.37583 2.92632 -0.8119 0.421133
cbind(lag1, lag2)lag1 0.70400 0.13865 5.0774 7.107e-06 ***
cbind(lag1, lag2)lag2 -0.36436 0.10811 -3.3704 0.001549 **
–––
Signif. codes: 0 ‘***‘ 0.001 ‘**’ 0.01 ‘*‘ 0.05 ‘.’ 0.1 ‘ ’ 1
Wald Test: 13.52353 p-value: 3e-05
> dnost <- fitdiag(cbind(lag1,lag2),x,est=c(“WIL”,“HBR”))
> c(dnost$tdbeta,dnost$bmtd)
[1] 0.001607918 0.750000000
Notice that the HBR fit is quite close to the Wilcoxon fit. This is confirmed by TDBETAS which has the value 0.002 (the benchmark is 0.75).
There are essentially two type of outliers for time series. The first type are the innovative outliers (IO). These can occur when the error distribution has heavy-tails. If an outlier occurs at time t (|et| is large), then this generally leads to a response outlier, Xt, at time t, i.e., an outlier on the left-side of the model. In subsequent times it appears on the right-side and becomes incorporated into the model. These IO outliers generally lead to good points of high leverage. The dataset generated in Example 7.8.1 illustrates IO outliers. Additive outliers are a second type of outliers. These are patched into the series by a contaminating process, often leading to bad leverage points; see page 413 of Terpstra et al. (2001) for details. Both types of outliers occur in practice. For this reason, we recommend fitting both highly efficient and high breakdown rank-based estimates to the series and using the diagnostic TD-BETAS to see if the fits differ. Terpstra et al. (2001) performed a large Monte Carlo study of rank-based and M estimates of time series involving both types of outliers. In all of the situations they simulated, the rank-based estimates either performed the best or nearly best over all procedures considered.
7.8.1 Order of the Autoregressive Series
In practice, before fitting the autoregressive time series model, (7.46), we must decide on its order p. One approach consists of subsequent fitting of models beginning with a model of large order. As discussed in Terpstra et al. (2001) for rank-based procedures, a more precise statement of the algorithm is: First select a value of P of maximal order; i.e., the residual analysis shows that the model fits well. Next, select a level α for the testing. Then the algorithm is given by
- (0) Set p = P.
- (1) While p > 0, fit Model (7.46) with order p.
- (2) Let ϕ2 = (ϕp,..., ϕP)’. Then use the Wald test procedure to test H0 : ϕ2 = 0 versus HA : ϕ2 ≠ 0.
- (3) If H0 is rejected then stop and declare p to be the order; otherwise, set p = p–1andgoto(1).
We return to the last example and use this algorithm to determine the order of the AR model based on the HBR fit.
Example 7.8.2 (Generated AR(2) Data, Continued).
We have written a R function, arorder, to implement the above algorithm. The sequential testing is based on rank-based Wald’s test of Aϕ = 0 where A is the constraint matrix as described in Step 2 of the algorithm. The user must select a maximum order of the AR model. For the example we have selected maxp=4. Besides this, as shown in the code segment, the estimates and the covariance matrix of the estimates are inputted. It returns the stepwise results of the algorithm. We illustrate its use for the HBR fit.
> data <- lagmat(ar2,4)
> x <- data [,1]
> xmat <- data[,2:(4+1)]
> hbr <- hbrfit(x˜ xmat)
> varcov = vcov(hbr,details=T)
> est <- hbr$coef
> alg <- arorder(length(x),4,est,varcov)
> alg$results
[,1] [,2] [,3]
4 0.8331220 0.366707515
3 0.4832491 0.620244664
2 4.6797785 0.006679725
In this case, the algorithm correctly identifies the order of the autoregressive series which is 2.
A rank-based adaption of Graybill’s algorithm performed well in a simulation study by Terpstra and McKean (2005). A similar algorithm for the order of a polynomial regression model was discussed in Section 4.7.1.
7.9 Exercises
7.9.1. To see the effect on fits that “good” and “bad” points of high leverage can have, consider the following dataset:
x
1
2
3
4
5
6
7
8
9
10
20
y
5
7
6
14
14
25
29
33
31
41
75
y2
5
7
6
14
14
25
29
33
31
41
20
The point x = 20 is a point of high leverage. The data for y (rounded) are realizations from the model y = 4x + e, where e has a N(0, 9) distribution. Hence, the the value of y follows the model and is a “good” point of high leverage. Notice that y2 is the same as y, except the last component of y2 has been changed to 20 and, thus, is a “bad” point of high leverage.
- (a) Obtain the scatterplot for x and y, the Wilcoxon and HBR fits, and overlay these fits on the scatterplot.
- (b) Obtain the scatterplot for x and y2, the Wilcoxon and HBR fits, and overlay these fits on the scatterplot.
- (c) Comment on the differences among the fits and plots.
7.9.2. Consider the datasets in Exercise 7.9.1.
- (a) Using the function fitdiag, obtain the diagnostics TDBETAS and CFITS for the set x and y. Plot CFITS versus Case. Comment.
- (b) Next obtain the diagnostics and plot for the set x and y2. Comment.
- 7.9.3. There is some loss of efficiency when using the HBR fit instead of the Wilcoxon for “good” data. Verify this for a simulation of the model y = 4x + e, where e has a N(0, 625) distribution and x = 1 : 20, using 10,000 simulations.
- 7.9.4. Using the set up Exercise 7.9.3, check the validity of the 95% confidence intervals for β1 obtained by the Wilcoxon and HBR fits.
- 7.9.5. Obtain the Wilcoxon and HBR fits for the simple “good” set of data discussed at the beginning of Section 7.3. Then determine the diagnostics TDBETAS and CFITS. Is there a difference in fits? Next obtain the plot of robust distances and TDBETAS between the LTS fit and the Wilcoxon fit. Comment.
7.9.6. Hawkins et al. (1984) presented a simulated dataset consisting of 75 data points and three predictors. The first 14 points are outliers in the X– space while the remaining 61 points follow a linear model. Of the 14 outliers, the first 10 do not follow the model while the next 4 do follow the model. The dataset is in the hawkins.
- (a) Obtain the Wilcoxon fit and plot its Studentized residuals versus Case number. Comment.
- (b) Obtain the HBR fit and plot its Studentized residuals versus Case number. Comment.
- (c) Obtain the diagnostics TDBETAS and CFITS between the HBR and Wilcoxon fits. Plot CFITS versus Case. Did the diagnostics discern the embedded outlier structure for this dataset?
- 7.9.7. Use the bonds data to examine the relationship between the bid prices for US treasury bonds (BidPrice) and the size of the bond’s periodic payment rate (CouponRate). Consider BidPrice as the response variable and CouponRate as the explanatory variable. Obtain the Wilcoxon and HBR fits of this dataset. Using Studentized residuals and the diagnostics TDBETAS and CFITS, show the heteroscedasticity and determine the outliers. See Sheather (2009) for discussion on the “bow tie” pattern in the residual plot. The data are in the dataset bonds.
7.9.8. Hamilton (1992) presents a dataset concerning the number of accidental oil spills (x) at sea and the amount of oil loss (y) in millions of metric tons for the years 1973–1975. The data are:
1
2
3
4
5
6
7
x
36.00
48.00
45.00
29.00
49.00
35.00
65.00
y
84.50
67.10
188.00
204.20
213.10
260.50
723.50
8
9
10
11
12
13
x
32.00
33.00
9.00
17.00
15.00
8.00
y
135.60
45.30
1.70
387.80
24.20
15.00
Hamilton suggests a regression through the origin model for this data.
- (a) Obtain the scatterplot y versus x and overlay the the rank-based and LS fits of the regression through the origin models.
- (b) Obtain the residual plots and q –q plots of the fits in Part (a). Comment on which fit is better.
- (c) Obtain a 95% confidence interval for the slope parameter based on the rank-based fit.
7.9.9. In using a regression through the origin model, one assumes that the intercept parameter is 0. This is a strong assumption. If there is little or no data with x relatively near 0, this is a form of extrapolation and there is little evidence for which to verify the assumption. One simple diagnostic check is to fit an intercept model, also, and then to compare the two fits.
- (a) For the data in Exercise 7.9.8, besides the rank-based fit of the regression through the origin model, obtain the rank-based fit of the intercept model. Overlay these fits on the scatterplot of the data. Which, if any, fit is better? Why?
- (b) One check for the assumption of a 0 intercept is to use a confidence interval for the intercept as a diagnostic confirmation. Obtain the confidence interval for the rank-based fit.
- (c) The fallacy in Part (b), of course, is that it may be a form of extrapolation as discussed at the beginning of this exercise. Is this extrapolation a concern for this problem? Why?
7.9.10. One form of heteroscedasticity that occurs in regression models is when the observations are collected over time and the response varies with time. Good statistical practice dictates plotting the responses and other variables versus time, if time may be a factor. Consider the following data:
1
2
3
4
5
6
7
8
9
10
x
46
37
34
30
33
24
30
49
54
47
y
132
105
94
71
84
135
10
132
148
132
x
24
33
42
50
47
55
25
44
38
53
y
67
105
104
132
142
130
60
133
204
163
- (a) Scatterplot the data. Obtain the the Wilcoxon fit and the residual plot. Do the data appear to be heteroscedastic?
- (b) These data were collected over time. For such cases, it is best to plot the residuals versus time. Obtain this plot for our dataset (Wilcoxon residuals versus time, t<-1:20). Comment on the heteroscedastic-ity.
- (c) Assume the response varies directly with time; i.e., Var(ei) = iσ2, where ei denotes the random error for the ith case. Appropriate weights in this case are: diag(1/i), where i<-1:20. Use the function wtedrb to fit the data with these weights. Remember to use the design matrix xmat<-cbind(rep(1,20),x), where x is the vector containing the x’s.
- (d) Compare the precision of fits in parts (a) and (c).
7.9.11. Consider a model where the responses vary directly with time order of the observations:
where the explanatory variables (x1,...,x20) are generated from a standard normal distribution and the errors (e1,..., e20) are generated from a contaminated normal distribution with ϵ = 0.2 and σ = 9. Run a simulation comparing the usual Wilcoxon fit with the weighted Wilcoxon fit using the weights diag(1/t). Remember to use the design matrix xmat<-cbind(rep(1,20),x) for the weighted Wilcoxon fit. Comment on the simulation, in particular address the following.
- (a) Empirical mean square errors for the estimates of the slope parameter β1 = −3.
- (b) Validity of 95% confidence intervals for the slope parameter β1 = –3.
- 7.9.12. Assuming X ~ SN (α) for some –∞ < α < ∞, obtain the derivation of expression (7.22).
- 7.9.13. As in Figure 7.11, obtain the plots of the pdfs and their associated scores for α = 1, 2,..., 10. Comment on the trends in the plots as α increases.
- 7.9.14. Assuming X ~ SN (α) for some –∞ < α < ∞, show that the derivative of the optimal scores satisfies expression (7.24). of expression (7.22).
7.9.15. Simulate 50 observations from the model
where xi1,xi2 are deviates from a standard normal distribution and ei ~ SN(–8).
- (a) Obtain the rank-based fit of these data using skew normal scores with α = –8. Obtain confidence intervals for the 3 (nonintercept) regression parameters. Did the confidence intervals trap the true values?
- (b) Obtain the Studentized residuals for the fit obtained in Part (a). Using these residuals obtain the residual plot and the normal q–q plot. Comment on the fit.
- (c) Obtain the Wilcoxon fit of these data. What is the estimated precision of fit in Part (a) over the Wilcoxon fit?
7.9.16. On Page 204, Bowerman et al. (2005) present a dataset concerning sales prices of houses in a city in Ohio. The variables are: y is the sale price in $10,000; x1 is the total square footage; x2 is the number of rooms; x3 is the number of bedrooms; and x4 is the age of the house at the time data were collected. The sample size is n = 63. For the reader’s convenience the data are in the dataset homesales. Consider the linear model .
- (a) Use the Hogg-type adaptive scheme discussed in Section 7.6 on these data; i.e., use the function adaptor. Which score function did it select?
- (b) Comment on the estimated regression coefficients as to significance and what they mean in terms of the problem.
- (c) Fit the model using the selected score function in Part (a).
- (d) Using the Studentized residuals from Part (b), perform a residual analysis which includes at least a residual plot and a q –q plot. Identify all outliers.
- (e) Based on your analysis in (d), what, if any, other models would you fit to these data?
- 7.9.17. Apply the Hogg-type adaptive scheme of Section 7.6 to data of Exercise 6.5.6. Compare the selected fit with that of the rank-based fits obtained in Exercise 6.5.6. Which of the three is best in terms of precision?
- 7.9.18. For the data of Exercise 6.5.7, run the adaptive analysis of Section 7.6. Which score function did it select?
7.9.19. Bowerman et al. (2005) discuss the daily viscosity measurements of a manufactured chemical product XB-77-5 for a series of 95 days. Using traditional methods, they determined that the best autoregressive model for this data had order 2. For the reader’s convenience, we have placed this data in the dataset viscosity.
- (a) Plot this time series data.
- (b) As in Example 7.8.1, using the Wilcoxon scores, determine the order of the autoregressive series for this data. Use as the maximum order, p = 4. Do the results agree with the order determined by Bowerman et al. (2005)?
- (c) Obtain the Wilcoxon fit for the autoregressive model using the order determined in the last part. Obtain confidence intervals for the autoregressive parameters.
- (d) Write the model expression for the unknown observation at time t = 96. Using the fitted model in Part (c), predict the expected viscosity for Day 96.
- (e) Determine a confidence interval for the E(y96); see Section 4.4.4.
- (f) Continue parts (d) and (e) for the observations at times 97 and 98.
- 7.9.20. For the time series in Exercise 7.9.19, assume that the order of the autoregressive model is 2. Compute the diagnostic TDBETAS between the Wilcoxon and HBR fits. Obtain the plot of the corresponding diagnostic CFITS versus time also. Comment on the diagnostics.
7.9.21. Seber and Wild (1989) present a dataset for the nonlinear model of the form y = f (x; θ) + e, where
The response y is the enzyme velocity in an enzyme-catalyzed chemical reaction and x denotes the concentration of the substrate. The 12 data points are:
x
2.00
2.00
0.67
0.67
0.40
0.40
y
0.0615
0.0527
0.0334
0.0258
0.0138
0.0258
x
0.29
0.29
0.22
0.22
0.20
0.20
y
0.0129
0.0183
0.0083
0.0169
0.0129
0.0087
- (a) Obtain a scatterplot of the data.
- (b) Write the R functions for the model and the Jacobian.
- (c) Using θ0 = (.1,1.8) as the initial estimate, obtain the Wilcoxon fit of the model. Obtain 95% confidence intervals for θ1 and θ2.
- (d) Overlay the scatterplot with the fitted model.
- (e) Obtain a residual plot and a q–q plot of the residuals. Comment on the quality of the fit.
- 7.9.22. Obtain the HBR fit of the nonlinear model discussed in Exercise 7.9.21. Then change let y1 = y2 = 0.04. Obtain both the Wilcoxon and HBR fits for this changed data. Which fit changed less?
7.9.23. The dataset gamnl contains simulated data from the nonlinear model
The first and second columns of the data contain the respective x’s and y’s.
- (a) Obtain a scatterplot of the data.
- (b) Write the R functions for the model and the Jacobian.
- (c) For starting values, the model suggests taking the log of both sides of the model expression and then fit a linear model; but since some of the y values are negative use log(y + 2).
- (d) Obtain the Wilcoxon fit of the model and 95% confidence intervals for θ1 and θ2.
- (e) Overlay the scatterplot with the fitted model.
- (f) Obtain a residual plot and a q–q plot of the residuals. Comment on the quality of the fit.
7.9.24. Devore (2012) presents a dataset on the wear life for solid film lubricant. We consider the model
where Yi the wear life in hours of a Mil-L-8937-type film, xi1 is load in psi, and xi2 is the speed of the film in rpm. The data are the result of a 3 × 3 crossed design with three replicates and are in dataset wearlife.
- (a) Write the R functions for the model and the Jacobian.
- (b) For starting values, as the model suggests, take logs of both sides. Show that θ1 = 36,000, θ2 = 1.15, and θ3 = 1.24 are reasonable starting values.
- (c) Obtain the Wilcoxon fit and find 95% confidence intervals for each of the parameters.
- (d) Obtain the residual versus fitted values plot and the normal q–q plot of the residuals. Comment on the quality of the fit.
- (e) Obtain a scatterplot of xi1 versus xi2. There are, of course, 9 treatment combinations. At each combination, plot the predicted wear life based on the fitted model. Obtain 95% confidence intervals for these predictions. Discuss the plot in terms of the model.
1 See https://github.com/kloke/book for more information.
2 See, also McKean and Sheather (2009).
3 See, also, Page 287 of Hettmansperger and McKean (2011).
4 See Graybill and Iyer (1994) for initial reference for this dataset.
5 See https://github.com/kloke/book for more information.