ZENworks for Servers 3 includes LAN traffic analysis tools that help you monitor your LAN traffic, capture traffic data, and collect important statistics of your monitored segments and devices. You can then use the data collected through the LAN traffic tools to understand your network's usage and performance, as well as troubleshoot network issues.
The following sections discuss the different pieces of LAN traffic analysis and how to use them to monitor your managed segments, servers, and other network devices across your multitopology networks.
ZENworks for Servers 3 LAN traffic analysis is made up of several components that work together to collect, store, and display information about data packets that are being sent on your network. ZENworks for Servers 3 provides tools that enable you to capture and decode the packets as they are sent from one node to another, which enables you to better analyze the traffic. The following sections describe the ZENworks for Servers 3 LAN traffic components, how they communicate, and the functionality of their agents.
The ZENworks for Servers 3 LAN traffic analysis system is made up of three main components: the management server, the management console, and the monitoring agent server.
The management server component of ZENworks for Servers 3 LAN traffic analysis is installed on the management site server. It comprises an extremely scalable Sybase database that stores static information such as network names and LAN addresses of servers, routers, switches, and other nodes on you network.
The management server components include the NetExplorer, a consolidator, and the Atlas Manager (discussed in Chapter 9, “Preparing and Using ZENworks for Servers 3 Network Discovery”). These components gather information about manageable devices on the network and store that information in the management database. The management database is a Common Information Model-2 (CIM-2) database that stores network data used to establish the network's topology. ZENworks for Servers 3 extends the CIM-2 model to enable you to organize the information in the database and create a topology map.
The management console component of ZENworks for Servers 3 LAN traffic analysis is installed on the management client in the form of snap-ins to the ConsoleOne utility (discussed in Chapter 8, “Understanding ZENworks for Servers 3 Management Services”). These snap-ins provide an intuitive, graphical method to access data collected by the ZENworks for Servers 3 LAN traffic analysis agents.
The final component of the ZENworks for Servers 3 LAN traffic analysis system is the monitoring agent server. The monitoring agent server is a server with network monitoring agent software installed on it. There must be one monitoring agent server per segment.
The monitoring agent server enables you to analyze a segment by searching the network and gathering information about network traffic. You can then use that information to analyze the LAN traffic on your network.
The network monitoring agents monitor network traffic and capture frames to build a database of objects in the network. Then network monitoring agent software enables you to use the ZENworks for Servers 3 management console traffic analysis tools to maintain your network performance, monitor traffic on your network, and troubleshoot network problems.
Now that you understand what components make up the ZENworks for Servers 3 LAN traffic analysis system, you need to understand how these systems communicate with each other. The management console component communicates with the management server component by using Common Object Request Broker Architecture (CORBA) to obtain static and dynamic information about the managed nodes and devices on your network.
When the management console requests static information from the management server, the management server then communicates with the management database component by using the Java Database Connectivity (JDBC) protocol. It gathers the requested information from the database and relays it back to the management console.
When the management console requests dynamic information from the management server, the management server communicates with the network monitoring agent by using SNMP requests. It gathers the requested information dynamically and relays it back to the management console.
ZENworks for Servers 3 includes several types of monitoring agents to accommodate the various topologies and devices on your network. Network monitoring agents provide you with the functionality to remotely monitor segments and devices that are SNMP-compliant. The agents collect and store statistical and trend information as well as capture real-time data from the managed nodes and devices on your network. The following sections describe the RMON, RMON Lite, RMON Plus, RMON2, and bridge agents to help you decide which one to use, based on the size and topology of your network.
ZENworks for Servers 3 RMON agents use a standard monitoring specification that enables various nodes and console systems on your network to exchange network data. That network data is used to monitor, analyze, and troubleshoot your LAN from a central site.
The RMON agents are typically used to monitor Ethernet, FDDI, and token ring segments. Table 10.1 describes the groups of monitoring elements that make up the RMON agent.
Table 10.1. RMON Agent Monitoring Groups
|
RMON GROUP |
DESCRIPTION |
|---|---|
|
Statistics |
Records statistics measured by the agents for each monitored interface on the device. |
|
History |
Records periodic statistical samples from a network and stores them for later retrieval from the management console. |
|
Alarm |
Periodically takes statistical samples from parameters in the agent and compares them with previously configured thresholds. Then, if the monitored parameter crosses a threshold, an alarm event is generated. |
|
Host |
Lists the statistics associated with each host discovered on the network. |
|
HostTopN |
Prepares tables that describe the hosts that top a list ordered by one of their statistics. |
|
Matrix |
Stores statistical information for conversations between two nodes. Creates an entry in its table for each new conversation. |
|
Filters |
Enables packets to be matched to a filtered variable. The matched packets form a data stream that may be captured or used to generate events. |
|
Packet Capture |
Enables packets to be captured after they flow through a channel. |
|
Events |
Controls the generation and notification of events from the device. |
ZENworks for Servers 3 RMON Lite agents also use a standard monitoring specification that enables various devices on your network to exchange network data. The RMON Lite agents are typically used to monitor devices that are not dedicated for network management, such as a hub or a switch. Table 10.2 describes the groups of monitoring elements that make up the RMON Lite agents.
Table 10.2. RMON Lite Agent Monitoring Groups
|
RMON LITE GROUP |
DESCRIPTION |
|---|---|
|
Statistics |
Lists statistics measured by the agents for each monitored interface on the device. |
|
History |
Records periodic statistical samples from a network and stores them for later retrieval from the management console. |
|
Alarm |
Periodically takes statistical samples from parameters in the agent and compares them with previously configured thresholds. Then, if the monitored parameter crosses a threshold, an alarm event is generated. |
|
Events |
Controls the generation and notification of events from the device. |
ZENworks for Servers 3 RMON Plus agents are proprietary agents that extend the functionality of the RMON agent. They act exactly the same as the RMON agent and provide the same groups as those shown in Table 10.1. In addition to providing data collected from the RMON groups, they also provide data collected from the groups shown in Table 10.3.
Table 10.3. RMON Plus Agent Monitoring Groups
|
RMON PLUS GROUP |
DESCRIPTION |
|---|---|
|
Buffer |
Records the number of octets (excluding framing bits but including frame check sequence octets) in packets that are captured in the buffer. |
|
Admin |
Collects information sent to the agent, such as version number. |
|
HostMonitor |
Monitors a set of nodes for a particular host table and sets traps when a host becomes active or inactive. |
|
DuplicateIP |
Records and updates lists of packets arriving that contain duplicate IP addresses. |
|
MacToIP |
Stores records of the IP addresses associated with host addresses for a host-mapping table. |
|
BoardStatus |
Records the status of each logical interface of the RMON or RMON Plus agent. |
ZENworks for Servers 3 RMON2 agents can be used to collect data from nodes and devices in the network and application layers of the network model, unlike the RMON, RMON Lite, and RMON Plus agents, which are used to collect data from nodes and devices in the physical and data link layers of the network model.
RMON2 agents can also determine network usage based on the protocol and application used by the nodes in your network. Table 10.4 describes the groups of monitoring elements that make up the RMON2 agent.
Table 10.4. RMON2 Agent Monitoring Groups
|
RMON2 GROUP |
DESCRIPTION |
|---|---|
|
Protocol Directory |
Creates a table of all identifiable protocols and their descriptions. |
|
Protocol Distribution |
Collects statistics for each protocol that the agent is configured to track. |
|
Address Map |
Maps a network layer address to the corresponding MAC address. |
|
Network-Layer Host |
Collects statistics for each host by network layer address. |
|
Network-Layer Matrix |
Collects statistics for each network conversation between pairs of network layer addresses. |
|
Application-Layer Host |
Collects statistics on the traffic generated by each host for a specific Application layer protocol. The Protocol Directory group can recognize traffic that is broken down by protocols. |
|
Application-Layer Matrix |
Collects statistics on conversations between pairs of network layer addresses for a specific application layer protocol. Traffic, broken down by protocols, can be recognized by the Protocol Directory group. The Protocol Directory group can recognize traffic that is broken down by protocols. |
|
User History |
Enables the agent to save samples of RMON2 data for any MIB object at specific intervals. |
|
Probe Configuration |
Provides remote capability for configuring and querying agent parameters—for example, software updates, IP address changes, resets, and trap destinations. |
|
RMON Conformance |
Provides information to the management software regarding the status of support for the group. |
ZENworks for Servers 3 bridge agents monitor network bridges, enabling you to collect information about switched networks. Table 10.5 describes the groups of monitoring elements that make up the bridge agents.
Table 10.5. Bridge Agent Monitoring Groups
|
BRIDGE GROUP |
DESCRIPTION |
|---|---|
|
Base |
Stores information about objects that are applicable to all types of bridges. |
|
Spanning Tree Protocol |
Stores information regarding the status of the bridge with respect to the Spanning Tree protocol. |
|
Source Route Bridging |
Collects information that describes the status of the device with respect to source route bridging. |
|
Transparent Bridging |
Collects information that describes the object's state with respect to transparent bridging. |
|
Static |
Collects information that describes the object's state with respect to destination address filtering. |
Now that you understand the components involved in ZENworks for Servers 3 traffic analysis, you are ready to begin setting up traffic analysis on your network. Setting up LAN traffic analysis for ZENworks for Servers 3 involves establishing normal activity for your LAN, and then making the necessary configuration changes for the management console to be able to communicate with the management server. The following sections discuss creating a baseline document of normal LAN activity to use as a measurement, selecting the preferred RMON agent, and setting the necessary SNMP parameters for the management console to access the RMON agent.
The first step in setting up ZENworks for Servers 3 LAN traffic analysis on your network is to create a baseline document that describes the normal activity and usage of your network. The baseline document should show the normal levels of the most common statistics segments monitored by ZENworks for Servers 3.
After you create the baseline document, you can use it to identify parts of your network that are experiencing problems, need to be balanced, or need to be upgraded. The following is a list of the most common network statistics that should be used to create a baseline document:
![]() Bandwidth utilization. The bandwidth utilization statistic indicates the percentage of network bandwidth used. Because the network bandwidth tends to be higher at heavy usage times, your baseline document should account for those times—for example, when users are logging on in the morning.
Bandwidth utilization. The bandwidth utilization statistic indicates the percentage of network bandwidth used. Because the network bandwidth tends to be higher at heavy usage times, your baseline document should account for those times—for example, when users are logging on in the morning.
![]() Packets per second. The packets-per-second statistic indicates the raw number of packets that are being transferred on the network. This gives you the best indication of how heavy your network traffic really is.
Packets per second. The packets-per-second statistic indicates the raw number of packets that are being transferred on the network. This gives you the best indication of how heavy your network traffic really is.
![]() Network error rates. You should also set a baseline for network error rates. This is also based on heavy usage, so your baseline should take into account periods of the day when heavy usage would cause errors. This helps you identify times when network errors are atypical.
Network error rates. You should also set a baseline for network error rates. This is also based on heavy usage, so your baseline should take into account periods of the day when heavy usage would cause errors. This helps you identify times when network errors are atypical.
![]() Kilobytes per second. The kilobytes-per-second statistic indicates the raw amount of data that is being transferred on the network. This gives you the best indication of how heavy your network throughput really is.
Kilobytes per second. The kilobytes-per-second statistic indicates the raw amount of data that is being transferred on the network. This gives you the best indication of how heavy your network throughput really is.
![]() Active servers. You should keep track of the three most active servers on the network. This helps you understand where loads need to be balanced and where network upgrades must take place.
Active servers. You should keep track of the three most active servers on the network. This helps you understand where loads need to be balanced and where network upgrades must take place.
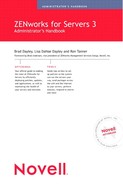
After you create your baseline document, you need to select which remote monitor (RMON) agent you want to monitor each managed segment. The RMON agent is set on the RMON Agent property page for the segment in ConsoleOne.The RMON property page displays the following information, shown in Figure 10.1, about the RMON agent:
![]() Preferred. Checked if this server is set as the preferred RMON agent server for the segment.
Preferred. Checked if this server is set as the preferred RMON agent server for the segment.
![]() Agent Name. Displays a list of all the servers on which the RMON agent is installed.
Agent Name. Displays a list of all the servers on which the RMON agent is installed.
![]() Version. Displays the dynamically obtained version number of the RMON agent installed on this server. It is left blank if ZENworks for Servers 3 is unable to contact the server to get a version number.
Version. Displays the dynamically obtained version number of the RMON agent installed on this server. It is left blank if ZENworks for Servers 3 is unable to contact the server to get a version number.
![]() Status. Displays the current status of the RMON agent on the selected segment.
Status. Displays the current status of the RMON agent on the selected segment.
![]() MAC Address. Displays the MAC address of the server.
MAC Address. Displays the MAC address of the server.
![]() Interface Index. Displays the number of interface indexes to which a server can connect through its network card. Each interface corresponds to a segment.
Interface Index. Displays the number of interface indexes to which a server can connect through its network card. Each interface corresponds to a segment.
![]() Available RMON Services. Displays the list of RMON services available from the selected agent (RMON, RMON Plus, or RMON2).
Available RMON Services. Displays the list of RMON services available from the selected agent (RMON, RMON Plus, or RMON2).
Follow these steps to set an RMON agent as the preferred agent to monitor a segment:
1. Right-click the segment object in ConsoleOne and select Properties from the pop-up menu.
2. Click the RMON Agent tab, as shown in Figure 10.1.
3. Choose a server or workstation name from the list displayed in the properties page, and then choose which server acts as the RMON agent for the segment.
4. Click the Apply button to save the settings.
After you set the preferred RMON agent for each segment, you need to set up the SNMP parameters for the servers hosting your RMON agents. When you request that dynamic information be displayed at the management console, you obtain that information from the monitoring server agents by using SNMP.
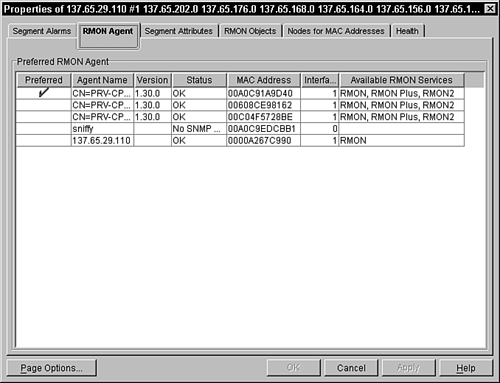
Initially, the SNMP communication between the management servers and the management console is based on default SNMP settings; however, you may want to modify the following settings, as shown in Figure 10.2:
![]() Secure Get (also known as SNMP get). Encrypts the packets sent by the monitoring agent to the management the agent.
Secure Get (also known as SNMP get). Encrypts the packets sent by the monitoring agent to the management the agent.
![]() Secure Set (also known as SNMP set). Encrypts the packets sent by the management agent to the monitoring agent.
Secure Set (also known as SNMP set). Encrypts the packets sent by the management agent to the monitoring agent.
![]() Community Strings. Community name of the node requesting dynamic data from the agent.
Community Strings. Community name of the node requesting dynamic data from the agent.
![]() Number of Retries. Number of times you want the management server to retry connecting to the monitoring agent.
Number of Retries. Number of times you want the management server to retry connecting to the monitoring agent.
![]() Timeout in mS. Maximum duration in milliseconds for which the management server should wait for a response from the monitoring agent.
Timeout in mS. Maximum duration in milliseconds for which the management server should wait for a response from the monitoring agent.
![]() Port Number. Port on which the management server contacts the monitoring agent.
Port Number. Port on which the management server contacts the monitoring agent.
Follow these steps to modify the default SNMP communication for your management servers:
1. Right-click the server object that is hosting the RMON agent for the segment and select Properties from the pop-up menu.
2. Click the SNMP Settings property panel, as shown in Figure 10.2.
3. Modify the Authentication and Communication settings.
4. Click the Apply button to save your settings.
After you set up the RMON agents and SNMP parameters for the segments and devices on which you want to analyze traffic, you are ready to begin capturing and analyzing network traffic. ZENworks for Servers 3 enables you to monitor and collect detailed real-time statistics from nodes and segments in your network. That information is displayed back to the management console in the form of tables, graphs, and other graphical displays.
This section discusses how to use the ZENworks for Servers 3 management console to monitor and analyze traffic on segments, nodes, protocols, and switches. It also covers how to capture and analyze network packets.
The most common LAN traffic analysis you will likely be doing is on network segments. You can ensure the most cost-effective, stable, and consistent network by monitoring and managing your segments with ZENworks for Servers 3 traffic analysis.
ZENworks for Servers 3 provides several different views for analyzing network traffic on segments. The management views translate the data collected by the monitoring agent into an easy-to-understand graphical and textual form. The following sections discuss how to use the List Segment Statistics, Segment Dashboard, Trend Data, Alarm Statistics, and Summary views on segments to monitor and analyze their traffic.
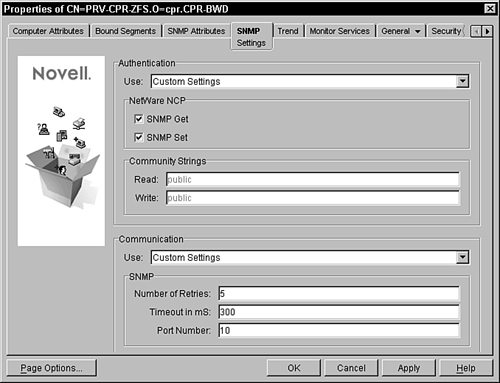
The List Segments Statistics view displays a list of segments in your network, as well as the following statistical information for each of them, as shown in Figure 10.3:
![]() Segment Name. Segment name, or address if no name is available.
Segment Name. Segment name, or address if no name is available.
![]() Type. Physical segment type (Ethernet, FDDI, WAN, and so on.)
Type. Physical segment type (Ethernet, FDDI, WAN, and so on.)
![]() Speed (Mbps). The raw speed of the segment, measured by the speed of the network interface card that attaches the RMON agent to the segment. Cable type is also used to determine the segment speed.
Speed (Mbps). The raw speed of the segment, measured by the speed of the network interface card that attaches the RMON agent to the segment. Cable type is also used to determine the segment speed.
![]() Utilization %. Average percentage of the bandwidth currently in use by the traffic on the segment.
Utilization %. Average percentage of the bandwidth currently in use by the traffic on the segment.
![]() Packets/s. Average number of packets per second currently being transmitted on the segment.
Packets/s. Average number of packets per second currently being transmitted on the segment.
![]() KBytes/s. Average number of kilobytes per second currently being transmitted on the segment.
KBytes/s. Average number of kilobytes per second currently being transmitted on the segment.
![]() Errors/s. Average number of errors per second the segment is currently incurring.
Errors/s. Average number of errors per second the segment is currently incurring.
![]() Message. Message describing the current status of the RMON agent on the segment.
Message. Message describing the current status of the RMON agent on the segment.
Follow these steps from the ZENworks for Servers 3 management console to access the List Segment Statistics view:
1. Select a segment or a node from the ZENworks for Servers 3 namespace in the management console.
2. Select View → List Segment from the main menu and a screen similar to the one shown in Figure 10.3 appears.
The Segment Dashboard view is a graphical view that provides real-time statistical information about an individual monitored segment. Shown in Figure 10.4, it displays four gauges that give the following real-time statistics for that segment, as well as node activity for the top nodes on the segment:
![]() Packets/s. The Packets gauge shows the number of packets per second that are being transmitted on the segment.
Packets/s. The Packets gauge shows the number of packets per second that are being transmitted on the segment.
![]() Utilization %. The Utilization gauge shows the current utilization, compared to the maximum network capacity that is currently being consumed on the segment.
Utilization %. The Utilization gauge shows the current utilization, compared to the maximum network capacity that is currently being consumed on the segment.
![]() Errors/s. The Errors gauge shows the number of errors per second the segment is currently incurring.
Errors/s. The Errors gauge shows the number of errors per second the segment is currently incurring.
![]() Broadcasts/s. The Broadcasts gauge shows the number of broadcast packets per second that are currently being transmitted on the segment.
Broadcasts/s. The Broadcasts gauge shows the number of broadcast packets per second that are currently being transmitted on the segment.
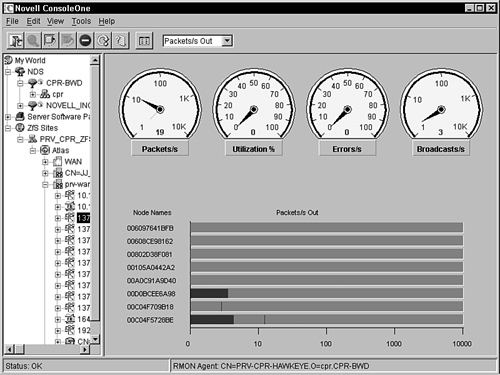
Follow these steps from the ZENworks for Servers 3 management console to access the Segment Dashboard view:
1. Select the segment you want to monitor from the ZENworks for Servers 3 namespace in the management console.
2. Select View → Segment Dashboard from the main menu and a screen similar to the one shown in Figure 10.4 appears.
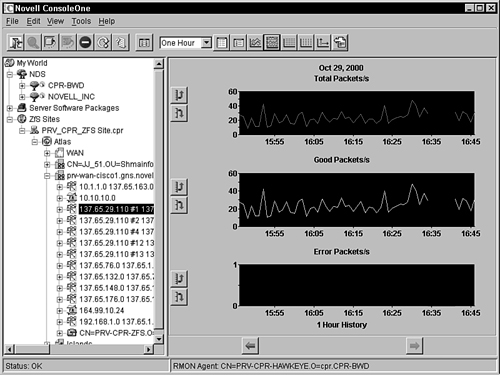
Use the Trend Data view in conjunction with the baseline document, discussed earlier in this chapter. The Trend Data view enables you to determine trends of traffic patterns that indicate that a segment is in trouble or needs to be updated or expanded. To access the Trend Data view for a segment from the ZENworks for Servers 3 management console, follow these steps:
1. Select the segment you want to monitor from the ZENworks for Servers 3 namespace in the management console.
2. Select View → Segment Trends from the main menu and a screen similar to the one shown in Figure 10.5 appears.
You can configure which statistics to monitor in the Trend Data view. Follow these steps to configure the statistics that best fit your network:
1. Click the Profile button in the Trend Data view.
2. Select a profile from the Select Profile column in the Edit Profile window.
3. Choose which statistics you want to view in the Select Series column. The available options depend on your network type.
4. Click the OK button and the Trend Data view should be updated with your new selections.
The Alarm Statistics view shows a list of all alarms for the monitored segment, along with their threshold and sampling rate. Follow these steps from the ZENworks for Servers 3 management console to access the Alarm Statistics view for a segment:
1. Right-click the segment you want to monitor from the ZENworks for Servers 3 namespace in the management console.
2. Select Properties from the pop-up menu.
3. Select the Segment Alarms tab, as shown in Figure 10.6.
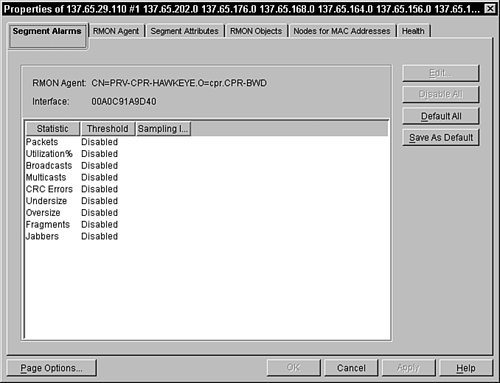
You can edit the alarms manually by highlighting the alarm and clicking the Edit button, or you can use the Default All button to set a predefined set of default values to the alarms.
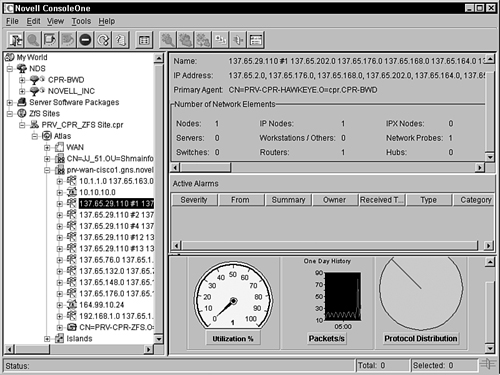
The Segment Summary view is both a graphical and a textual view, which provides a quick summary of the managed segment. This view enables you to quickly assess the current state of the segment. It provides the following static information about the managed segment:
![]() Name. Name or address of the segment
Name. Name or address of the segment
![]() Type. Media type of the segment: Ethernet, token ring, or FDDI
Type. Media type of the segment: Ethernet, token ring, or FDDI
![]() IP Address. IP addresses of the segment
IP Address. IP addresses of the segment
![]() IPX Address. IPX addresses of the segment
IPX Address. IPX addresses of the segment
![]() Primary Agent. Name of the preferred agent, which is monitoring nodes and traffic on the segment
Primary Agent. Name of the preferred agent, which is monitoring nodes and traffic on the segment
![]() Agent Status. Current status of the preferred monitoring agent
Agent Status. Current status of the preferred monitoring agent
![]() Nodes. Number of nodes on the segment
Nodes. Number of nodes on the segment
![]() IP Nodes. Number of nodes on the segment with IP addresses
IP Nodes. Number of nodes on the segment with IP addresses
![]() IPX Nodes. Number of nodes on the segment with IPX addresses
IPX Nodes. Number of nodes on the segment with IPX addresses
![]() Servers. Number of NetWare servers on the segment
Servers. Number of NetWare servers on the segment
![]() Workstations. Number of nodes on the segment that are not NetWare Servers
Workstations. Number of nodes on the segment that are not NetWare Servers
![]() Network Probes. Number of monitoring agents available on the segment
Network Probes. Number of monitoring agents available on the segment
![]() Switches. Number of switches on the segment
Switches. Number of switches on the segment
![]() Routers. Number of routers on the segment
Routers. Number of routers on the segment
![]() Hubs. Number of hubs on the segment
Hubs. Number of hubs on the segment
The Segment Summary view provides the following information about alarms that have occurred on the managed segment:
![]() Severity. Severity level associated with the alarm
Severity. Severity level associated with the alarm
![]() From. Network address of the device that sent the alarm to the alarm management system
From. Network address of the device that sent the alarm to the alarm management system
![]() Summary. Summary of the event, often including the name or address of the object affected by the alarm
Summary. Summary of the event, often including the name or address of the object affected by the alarm
![]() Owner. Segment or device affected by the alarm
Owner. Segment or device affected by the alarm
![]() Received Time. Date and time when the alarm management system received the alarm
Received Time. Date and time when the alarm management system received the alarm
![]() Type. Description of the alarm
Type. Description of the alarm
![]() Category. The category of the alarm, based on the MIB
Category. The category of the alarm, based on the MIB
The Segment Summary view provides the following charts and gauges that show you dynamically captured information about the managed segment:
![]() Utilization %. Displays a gauge representing the current real-time usage of the network in relation to the maximum capacity.
Utilization %. Displays a gauge representing the current real-time usage of the network in relation to the maximum capacity.
![]() Packets. Displays a trend graph based on data about packets that have been transmitted on the segment.
Packets. Displays a trend graph based on data about packets that have been transmitted on the segment.
![]() Protocol Distribution. Displays a pie chart that represents the distribution of protocols on the network.
Protocol Distribution. Displays a pie chart that represents the distribution of protocols on the network.
Follow these steps from the ZENworks for Servers 3 management console to access the Segment Summary view for a segment:
1. Select the segment you want to monitor from the ZENworks for Servers 3 namespace in the management console
2. Select View → Segment Summary from the main menu and a screen similar to the one in Figure 10.7 appears.
ZENworks for Servers 3 also provides several views to help you monitor and analyze traffic associated with nodes connected to a monitored segment. Monitoring at the segment level gives you a good understanding about the general trends and health of the entire segment. But if you want to analyze traffic at a more granular level, you need to analyze traffic at the node level.
The following sections describe how to use the ZENworks for Servers 3 management console to analyze statistics between nodes, and to monitor nodes for inactivity.
The first thing that you should do when analyzing traffic of nodes on a segment is to gather information about the most active ones. Viewing the statistics for the most active nodes gives you an indication of how active nodes are on the segment and whether any nodes are exhibiting troubled behavior. ZENworks for Servers 3 provides the Stations view to enable you to view the following statistics on the most active nodes in the segment:
![]() MAC Address. Physical address of the node
MAC Address. Physical address of the node
![]() Node. Name or address of the node
Node. Name or address of the node
![]() Utilization %. Percentage of maximum network capacity consumed by packets sent from this node
Utilization %. Percentage of maximum network capacity consumed by packets sent from this node
![]() Packets/s In. Packets per second received by this node
Packets/s In. Packets per second received by this node
![]() Packets/s Out. Packets per second sent by this node
Packets/s Out. Packets per second sent by this node
![]() Bytes/s In. Data in bytes per second received by this node
Bytes/s In. Data in bytes per second received by this node
![]() Bytes/s Out. Data in bytes per second sent by this node
Bytes/s Out. Data in bytes per second sent by this node
![]() Errors/s. Errors per second received by this node
Errors/s. Errors per second received by this node
![]() Broadcasts/s. Broadcast packets per second received by this node
Broadcasts/s. Broadcast packets per second received by this node
![]() Multicasts/s. Multicasts per second received by this node
Multicasts/s. Multicasts per second received by this node
![]() Protocols. Types of protocols used by this node
Protocols. Types of protocols used by this node
![]() First Transmit. Date and time this node first transmitted a packet since the traffic analysis agent was loaded
First Transmit. Date and time this node first transmitted a packet since the traffic analysis agent was loaded
![]() Last Transmit. Date and time this node last transmitted a packet since the traffic analysis agent was loaded
Last Transmit. Date and time this node last transmitted a packet since the traffic analysis agent was loaded
Follow these steps from the ZENworks for Servers 3 management console to access the Stations view for a segment:
1. Select the segment on which you want to monitor nodes from the ZENworks for Servers 3 namespace in the management console.
2. Select View → Stations from the main menu and a screen similar to the one in Figure 10.8 appears.

3. Specify what statistic to use in determining a node's activity from the drop-down list at the top of the window.
The Conversations view is another useful ZENworks for Servers 3 view that enables you to view real-time data showing traffic between a specific node and one or more other nodes on the same segment. Use this information when you need to determine communication activity between specific nodes.
Suppose you have a database application installed on a node on the segment and you want to see how traffic from this node behaves when the database is active, as opposed to when it is shut down. You would use the Conversations view before and after activating the database and compare the data from each.
The Conversations view provides statistical data on the following characteristics of internode communication:
![]() Node. Name or address of the destination node communicating with the selected node
Node. Name or address of the destination node communicating with the selected node
![]() % Pkt Load. Percentage of the total packet load being used between this node and the destination node
% Pkt Load. Percentage of the total packet load being used between this node and the destination node
![]() % Byte Load. Percentage of the total byte load being used between this node and the destination node
% Byte Load. Percentage of the total byte load being used between this node and the destination node
![]() Pkts/s In. Number of packets received per second by the destination node from this node
Pkts/s In. Number of packets received per second by the destination node from this node
![]() Pkts/s Out. Number of packets sent per second from the destination node to this node
Pkts/s Out. Number of packets sent per second from the destination node to this node
![]() Bytes/s In. Number of bytes of data received per second by the destination node from this node
Bytes/s In. Number of bytes of data received per second by the destination node from this node
![]() Bytes/s Out. Number of bytes of data sent per second from the destination node to this node
Bytes/s Out. Number of bytes of data sent per second from the destination node to this node
![]() Pkts In. Number of packets received by the destination node from this node since the view was opened
Pkts In. Number of packets received by the destination node from this node since the view was opened
![]() Pkts Out. Number of packets sent by the destination node to this node since the view was opened
Pkts Out. Number of packets sent by the destination node to this node since the view was opened
![]() KBytes In. Number of kilobytes of data received by the destination node from this node since the view was opened
KBytes In. Number of kilobytes of data received by the destination node from this node since the view was opened
![]() KBytes Out. Number of kilobytes of data sent by the destination node to this node since the view was opened
KBytes Out. Number of kilobytes of data sent by the destination node to this node since the view was opened
![]() Protocols. Protocol packet types used by the destination node to communicate with this node
Protocols. Protocol packet types used by the destination node to communicate with this node
![]() First Transmit. Date and time that this node first transmitted on the network since the traffic analysis agent was loaded
First Transmit. Date and time that this node first transmitted on the network since the traffic analysis agent was loaded
![]() Last Transmit. Date and time that this node last transmitted on the network since the traffic analysis agent was loaded
Last Transmit. Date and time that this node last transmitted on the network since the traffic analysis agent was loaded
Follow these steps from the ZENworks for Servers 3 management console to access the Conversations view for a node:
1. Select the node on which you want to monitor conversations from the ZENworks for Servers 3 namespace in the management console.
2. Select View → Conversations from the main menu and a screen similar to the one in Figure 10.9 appears.

Another useful way to monitor network traffic at a node level is to monitor nodes for inactivity. ZENworks for Servers 3 enables you to monitor nodes to determine whether they become inactive and alert you if they do. This does not impact network traffic because the traffic analysis agent does not poll the node to obtain status. Follow these steps from the ZENworks for Servers 3 management console to set it to monitor inactivity of a node:
1. Right-click the node you want to monitor for inactivity from the ZENworks for Servers 3 namespace in the management console.
2. Select Monitor Nodes for Inactivity → Add from the pop-up menu to enable monitoring of the node.
After you select the nodes that you want to monitor, you can view the following information about them from the Monitor Nodes for Inactivity view:
![]() Name. Name of the node being monitored
Name. Name of the node being monitored
![]() MAC Address. Physical address of the node
MAC Address. Physical address of the node
![]() Status. Current status of the node (updated every 60 seconds by default)
Status. Current status of the node (updated every 60 seconds by default)
Follow these steps from the ZENworks for Servers 3 management console to access the Monitor Nodes for Inactivity view:
1. Select the segment for which you want to see a list of nodes monitored for inactivity from the ZENworks for Servers 3 namespace in the management console.
2. Select View → Monitor Nodes for Inactivity from the main menu.
ZENworks for Servers 3 makes it possible for you to be even more detailed than LAN traffic analysis at a node level by enabling you to capture specific sequences of packets from the network. As nodes communicate on a segment, they send packet sequences to each other, which are captured by the RMON agents in a local buffer and can be accessed by the management console.
Packet captures provide much more detail to LAN traffic analysis because they provide information about requests and replies that nodes are making on the network. This can be useful in troubleshooting interserver or client-to-server communication issues.
The following sections describe how to use the ZENworks for Servers 3 management console to set up a filter and capture packets from the network.
The first step in capturing packets from a segment is to set up a filter to limit the number of packets captured. Without a filter, there would be far too many packets captured, making it extremely difficult to use the capture. Filtering enables you to capture only the packets that are needed. If you are troubleshooting a client-to-server communication issue on an IP application, for example, you would want to capture IP packets only between the client node and the server node.
Follow these steps from the ZENworks for Servers 3 management console to define a capture filter:
1. Select a node or a segment from the ZENworks for Servers 3 namespace in ConsoleOne.
2. Select File → Actions → Capture Packets from the main menu. The Packet Capture Setup window, shown in Figure 10.10, appears.

3. Type in a descriptive name for the buffer in the Buffer Name text box. This typically should describe the purpose of the capture.
4. Select the source and destination nodes from drop-down lists in the Stations box and specify whether you want to capture packets based on an IP, IPX, or hardware address. You can use Any for either the source or destination, or Both to include all nodes. If it's possible, use specific nodes to reduce the size of the capture.
5. Select the direction of traffic flow between nodes. You can select only source to destination, only destination to source, or both directions. This can help limit the capture greatly if you need only one direction.
6. Add protocols on which to filter by selecting the protocol in the Selected Protocols list and clicking the Add button. If you do not add protocols on which to filter, all protocols are captured.
7. Specify what kind of packets to capture. See Table 10.6 for a list of available statistics by topology.
8. Specify whether you want to overwrite the buffer or stop the capture when the buffer is full. Overwriting the buffer means that the oldest packets are overwritten with the newest ones. If you specify to overwrite, you must manually stop the capture.
9. Specify the buffer size. This depends on what you need to capture and for how long. If you are capturing all packets from all nodes, you need a very large buffer; however, if you need packets from only one node to another one, the default buffer of 32K is probably enough. Keep in mind that there must be enough free memory at the RMON server to create the buffer.
10. Specify the packet slice size. The Slice Size field specifies the maximum number of bytes of each packet, starting from the packet header, to store in the buffer. This also depends on what you need out of the capture. For header information, you need only 150 bytes or so. But if you need data out of the packet itself, you should select the entire packet. This parameter determines the number of packets that a buffer can hold.
11. Click the OK button and the filter will be set.
Table 10.6. Available Statistics on which to Filter Based on Segment Type
|
SEGMENT TYPE |
AVAILABLE STATISTICS |
DEFAULT STATISTICS |
|---|---|---|
|
Ethernet |
Only good packets, only error packets, both good and error packets |
Both good and error packets |
|
FDDI ring |
All packets, LLC packets, MAC packets, SMT packets |
All packets |
|
Token ring |
All packets, non-MAC packets, MAC packets |
All packets |
After you set the filter, you are ready to start the capture. When you click the OK button from the Packet Capture Filter window, a Capture Status window similar to the one in Figure 10.11 appears. The Capture Status window displays the following information about the capture:
![]() Segment. Name or address of the segment on which the packet capture is occurring
Segment. Name or address of the segment on which the packet capture is occurring
![]() LANalyzer Server. Name or address of the server running the RMON agent that is collecting the captured packets
LANalyzer Server. Name or address of the server running the RMON agent that is collecting the captured packets
![]() Buffer Granted. Size of the buffer used for the capture
Buffer Granted. Size of the buffer used for the capture
![]() Description. Description of the filter settings for the capture
Description. Description of the filter settings for the capture
![]() Count. Incrementing count, shown as 8 in Figure 10.11, for every packet that is captured
Count. Incrementing count, shown as 8 in Figure 10.11, for every packet that is captured
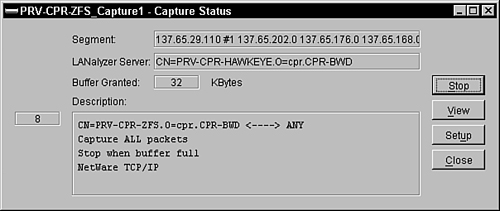
From the Capture Status window, click the Start button to start the capture. If you are trying to capture a specific sequence, start the capture and then perform the sequence—for example, open a database file or start an application. When you have captured enough packets, you can click the Stop button to stop the capture, or you can simply wait until the buffer fills up if you specified to stop the capture when the buffer was full.
After you set up a capture filter and capture the sequence of packets, you are ready to begin analyzing them from the management console. The packet captures reside on the server hosting the RMON agent; however, ZENworks for Servers retrieves the packet data from the RMON agent individually as you view each packet.
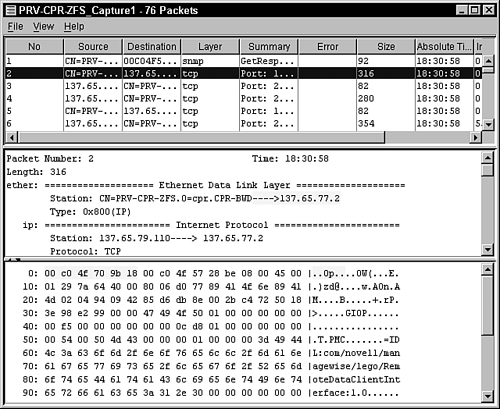
ZENworks for Servers 3 provides an extremely useful Trace Display view to help you view and decode packet data. The Trace Display view, shown in Figure 10.12, provides summary information about the captured packets (top), a decoded view of the selected packet (middle), and a hexadecimal view of the packet (bottom).
You can open the Trace Display view by clicking the View button on the Capture Status window or by Selecting Tools → View Packet File from the main menu in ConsoleOne.
The following sections discuss the three different sections of the Trace Display view.
The summary pane in the Trace Display view displays a list of captured packets, providing you with an overview of the communications between source and destination nodes. You can highlight a packet in this pane to display the decoded and hexadecimal packet data in the panes below. The summary pane provides the following statistical information about the captured packets:
![]() No. Numbers the packets in the order in which they were received at the RMON agent
No. Numbers the packets in the order in which they were received at the RMON agent
![]() Source. Name or MAC address of the node from which the packet was sent
Source. Name or MAC address of the node from which the packet was sent
![]() Destination. Name or MAC address to which the packet was sent
Destination. Name or MAC address to which the packet was sent
![]() Layer. Abbreviation of the highest protocol layer in the packet—for example, “ncp” for NetWare Core Protocol or “ether” for Ethernet
Layer. Abbreviation of the highest protocol layer in the packet—for example, “ncp” for NetWare Core Protocol or “ether” for Ethernet
![]() Summary. Displays a brief description of the contents of the highest protocol layer
Summary. Displays a brief description of the contents of the highest protocol layer
![]() Error. Shows the error type, if any, that occurred in the packet
Error. Shows the error type, if any, that occurred in the packet
![]() Size. Displays the number of bytes contained in the packet
Size. Displays the number of bytes contained in the packet
![]() Absolute Time. Displays the hardware clock time when the packet arrived
Absolute Time. Displays the hardware clock time when the packet arrived
![]() Interpacket Time. Displays the time that elapsed from the end of the preceding packet to the end of the current packet
Interpacket Time. Displays the time that elapsed from the end of the preceding packet to the end of the current packet
![]() Relative Time. Displays the time that elapsed since the arrival of the oldest packet still in the buffer
Relative Time. Displays the time that elapsed since the arrival of the oldest packet still in the buffer
The decode pane in the Trace Display view displays detailed information about the contents of the selected packet. The packet data is decoded and displayed according to defined protocol fields. This is an extremely useful tool because it tells you information such as the station that sent the packet, protocol, NCP request information, reply results, and so forth. You typically use this field to understand packet sequences and why they failed.
The hexadecimal pane in the Trace Display view displays the raw packet data in hexadecimal format. The column on the left is the hexadecimal offset from the packet header. The second column is the raw hexadecimal data of the packet. The column on the right is the ASCII form of the hexadecimal data.
You will likely use only the hexadecimal display if you know exactly what you are looking for. If, for example, you know the structure of the data that is being sent from a client application to a server, you would be able to manually decode the hexadecimal data. The text column of the hexadecimal display, however, is often useful because it shows textual data in the packet. File pathnames, for example, show up in the ASCII column.
ZENworks for Servers 3 also enables you to filter out packets even after you have begun viewing the packet trace. This is extremely useful in situations where after you begin viewing a packet trace, you narrow down the problem to a specific node or even a specific request.
Suppose you originally capture all packets going between a server and all network nodes, but you need to see only the packets going to that server from a specific node. You could filter on only those packets that are going to the specific node you are troubleshooting.
Another example is if you know the structure of the exact packet type you want to view. You can filter on a value, such as a key sequence, at a specific offset, and see only those packets that match.
Follow these steps to set a display filter for captured packets from the Capture Trace view in ConsoleOne:
1. Select View → Filter from the main menu and the Display Filter dialog box, shown in Figure 10.13, appears.

2. Modify the stations setting to narrow your filtering down to specific stations.
3. Modify the packet direction, if possible, to packets going one way.
4. Add or remove protocols from the selected protocols list.
5. Set the hexadecimal Offset and the From fields if you are looking for packets containing specific data.
6. Specify the data value and type to search for at the specified offset.
7. Click the OK button and your capture display filters on the criteria you have specified.
NOTE
If your packet capture is large, you may have to wait a considerable time for the ZENworks for Servers 3 management console to transfer enough of each packet to filter on. This takes up considerable bandwidth. We recommend that you use the capture filter setting to narrow down your captures first.
One of the most valuable features of the Trace Display view is its capability to match data in the decoded pane with the hexadecimal values in the hexadecimal pane. It does this by highlighting the data areas that you select in the decode pane, the hexadecimal pane, or in both panes. The following is a list of examples of how you can use the highlighting tool:
![]() Highlight a protocol layer in the decode pane and view the hexadecimal bytes in the Hex view.
Highlight a protocol layer in the decode pane and view the hexadecimal bytes in the Hex view.
![]() Click a specific field in the decode pane and view the hexadecimal value associated with it.
Click a specific field in the decode pane and view the hexadecimal value associated with it.
![]() Click a hexadecimal byte in the hexadecimal pane and see which protocol field is associated with it in the decode pane.
Click a hexadecimal byte in the hexadecimal pane and see which protocol field is associated with it in the decode pane.
![]() Click ASCII text in the hexadecimal pane and see the hexadecimal values and the specific decode field associated with it.
Click ASCII text in the hexadecimal pane and see the hexadecimal values and the specific decode field associated with it.
The ZENworks for Servers 3 traffic analysis agent also enables you to monitor statistics of traffic generated by protocols in your network.
The RMON2 agent object in the eDirectory tree provides a Protocol Directory property page to view a list of supported and custom protocols used in the network. This is a hierarchical list with the protocols used in the Data Link layer at the top level. Follow these steps from within ConsoleOne to display the protocols used on your network:
1. Select the node object running the RMON2 agent from the ZENworks for Servers 3 namespace.
2. Expand the view by clicking the plus sign next to it.
3. Expand the view for the services object.
4. Right-click the RMON2 object under Services and select Properties from the pop-up menu.
5. Select the Protocol Directory tab.
From the Protocol Directory tab, you can also add custom protocols to the supported protocol tree by clicking the Add button. You can also click the Remove button to remove a protocol from being monitored in the tree.
ZENworks for Servers 3 also enables you to view the distribution of protocols on a segment. This gives the following statistics of the protocol communications in the Network layer, Transport layer, and Application layer that are occurring on your network:
![]() Protocol Name. The name of the protocol
Protocol Name. The name of the protocol
![]() Packets/s. The average number of packets per second that are being sent with this protocol
Packets/s. The average number of packets per second that are being sent with this protocol
![]() Bytes/s. The average number of bytes of data per second that are being sent with this protocol
Bytes/s. The average number of bytes of data per second that are being sent with this protocol
![]() Packet Rate %. The percentage of packets transmitted with this protocol, relative to the total percentage of packets transmitted
Packet Rate %. The percentage of packets transmitted with this protocol, relative to the total percentage of packets transmitted
![]() Byte Rate %. The percentage of bytes of data transmitted with this protocol, relative to the total bytes of data being transmitted
Byte Rate %. The percentage of bytes of data transmitted with this protocol, relative to the total bytes of data being transmitted
Follow these steps from within the ZENworks for Servers 3 namespace in ConsoleOne to view the distribution of protocols in a segment:
1. Select the managed segment for which you want to view protocols.
2. Select View → Protocol Distribution from the main menu. A window similar to the one in Figure 10.14 appears.

The ZENworks for Servers 3 traffic analysis agent also enables you to monitor statistics of traffic generated on switches in your network. This helps you determine the load on workstation and workgroup switches in your network, enabling you to plan for future upgrades.
ZENworks for Servers 3 monitors ports and nodes connected to those ports by using an RMON agent, an external RMON agent, or a bridge agent. The following sections discuss how to use these agents to display statistics for ports on the switches on your network and to view the summarized information for a specific switch.
You can view a switch's port statistics by using the ZENworks for Servers Unified Port Traffic view. This view obtains statistical information about every port in your network. It then displays a list of nodes connected to ports on the switch and statistics for each port.
Follow these steps from within the ZENworks for Servers 3 namespace in ConsoleOne to display the Unified Port Traffic view:
1. Select the managed switch on which to view port statistics.
2. Expand the view by clicking the plus sign next to the switch.
3. Expand the view by clicking the plus sign next to services under the switch.
4. Select Switch/Bridge under services.
5. Select View → Port Traffic from the main menu to bring up the Unified Port Traffic view.
ZENworks for Servers 3 also provides a summary view of switch data that provides brief information about the switch. This gives you a quick look at the current status, usage, and alarms generated on the switch. The following statistical information is provided in the switch summary view:
![]() Vendor. Name of the manufacturer of the switch
Vendor. Name of the manufacturer of the switch
![]() Switch Type. Type of switch: transparent or source route
Switch Type. Type of switch: transparent or source route
![]() Number of Ports Active. Number of ports currently active on the switch
Number of Ports Active. Number of ports currently active on the switch
![]() Forwarding Table Overflow Count. Number of times the forwarding table has exceeded its capacity
Forwarding Table Overflow Count. Number of times the forwarding table has exceeded its capacity
![]() Up Time. Time since the switch was last rebooted
Up Time. Time since the switch was last rebooted
![]() Number of Ports Present. Number of ports that actually exist on the switch
Number of Ports Present. Number of ports that actually exist on the switch
![]() Number of MAC Addresses Learned. Number of MAC addresses dynamically discovered by the switch
Number of MAC Addresses Learned. Number of MAC addresses dynamically discovered by the switch
Follow these steps from within the ZENworks for Servers 3 namespace in ConsoleOne to display the Unified Port Traffic view:
1. Select the managed switch for which to view the summary.
2. Click View → Switch Summary from the main menu to bring up the Switch Summary view.
ZENworks for Servers 3 provides traffic analysis agents and RMON agents for both NetWare and Windows NT/2000 to enable you to monitor heterogeneous LANs. These agents collect information about activity on your network and relay that information back to the management agent, which in turn sends it to the management console for viewing.
The following sections describe how to set up and use the traffic analysis agents for both NetWare and Windows NT/2000.
You should take some time to set up the traffic analysis agents on the NetWare Servers on which they are installed. This involves setting the SNMP parameters, modifying the LANZ.NCF file, and restarting the agents.
The first step in setting up ZENworks for Servers 3 traffic analysis agents on NetWare Servers is to configure the SNMP parameters. This involves setting the appropriate read, write, and error-handling options for your agent server.
Follow these steps to configure the SNMP parameters on NetWare servers:
1. At the traffic analysis agent server, load the INETCFG utility.
2. From the Internetworking Configuration screen in the INETCFG utility, select Manage Configuration → Configure SNMP Parameters.
3. From Monitor Community Handling options, select Specified Community May Read, and then enter public for the community name.
4. From Control Community Handling options, select Specified Community May Write, and then enter public for the community name.
5. From Trap Handling options, select Send Traps with Specified Community, and then enter public for the community name.
6. Press ESC to exit from the SNMP Parameters screen and save changes.
7. Press ESC again to exit from the Internetworking Configuration screen and restart the server. These are not changes that the Reinitialize System command makes. For these changes to take place, you have to unload and reload SNMP, and that is done by restarting the server.
The LANZ.NCF file is a script used to launch the traffic analysis agent on NetWare servers. You can modify the LANZ.NCF file to customize agent loading. Use a text editor to modify the commands in Table 10.7 to customize your LANZ.NCF file.
Table 10.7. LANZ.NCF File Commands for the Traffic Analysis Agents
|
COMMAND |
DESCRIPTION |
|---|---|
|
|
Enables the LANZ control screen. Add the DEBUG=1 option to turn on the LANZ control screen, which reports significant events for traffic analysis agent on NetWare. |
|
|
Disables packet capturing to prevent someone from observing secure traffic to and from the server. Comment out the load line for LANZFCB by putting a # sign in front of the statement to disable packet capturing. |
|
|
Disables generation of duplicate IP address alarms to prevent alarm generation in a DHCP environment. Add the DUPIP=0 option to disable duplicate IP address alarms. |
|
|
Sets packet flow control to yield to other server operations when traffic is high. This reduces the impact of traffic analysis on the server. Add the LEVEL=1 option to enable flow control. |
|
|
Sets the upper limit of available memory to increase the memory that the traffic analysis agents will take. Add the BOUND=#### option to set the amount of memory (####) traffic analysis will use before returning an out-of-memory error. |
|
|
Sets the amount of time the traffic analysis agent will hold data in memory. Add the age to specify the amount of time, measured in hours, that traffic analysis data will be left in memory before it is purged. |
|
|
Sorts the number of concurrent sort computations per network adapter. Add the TOPN=# to set the number, between 2 and 10, of sort computations. |
|
|
Enables alarms to be sent automatically to the management console. Add the TRAPREG=1 option to tell the traffic analysis agent to automatically send SNMP alarms to management consoles. |
|
|
Enables/disables polling of source routed bridges on token ring networks. Add the |
The ZENworks for Servers 3 LAN traffic agents for NetWare comprise several modules. The following two script files are included with ZENworks for Servers 3 and should be used to start and stop the LAN traffic agents:
![]() LANZ.NCF. Script file that loads the LAN traffic agent NLMs
LANZ.NCF. Script file that loads the LAN traffic agent NLMs
![]() ULANZ.NCF. Script file that unloads the LAN traffic agent NLMs
ULANZ.NCF. Script file that unloads the LAN traffic agent NLMs
The LANZCON utility provided with ZENworks for Servers 3 enables you to configure and view the traffic analysis agents. The LANZCON utility is an NLM that is installed into the SYS:LANZ directory on the servers in which the traffic analysis agents were installed.
Load the LANZCON utility on your NetWare Server with the traffic analysis agents running to view and configure the following items:
![]() Network Adapter Information. Types of items that the adapter is currently monitoring. You can also enable or disable an adapter from monitoring the network.
Network Adapter Information. Types of items that the adapter is currently monitoring. You can also enable or disable an adapter from monitoring the network.
![]() Agent Status. Status of the selected agent and items related to the agent monitoring the segment.
Agent Status. Status of the selected agent and items related to the agent monitoring the segment.
![]() Statistics Information. Packet and event statistics for the selected network adapter.
Statistics Information. Packet and event statistics for the selected network adapter.
![]() History Information. Provides sampling information collected at intervals for the networks that are being monitored by this agent—for example, data source, buckets requested, and buckets granted.
History Information. Provides sampling information collected at intervals for the networks that are being monitored by this agent—for example, data source, buckets requested, and buckets granted.
![]() Hosts Information. Statistics about specific host or nodes on the monitored network.
Hosts Information. Statistics about specific host or nodes on the monitored network.
![]() Matrix Information. Consists of three tables that record information about conversations between pairs of nodes on the monitored segment.
Matrix Information. Consists of three tables that record information about conversations between pairs of nodes on the monitored segment.
After you set up the traffic analysis agent on your NetWare Servers, you should take some time to set up the traffic analysis agents on your Windows NT/2000 Servers as well. Once again, this involves setting the SNMP parameters and then restarting the agents.
The first step in setting up ZENworks for Servers 3 traffic analysis agents on NT/2000 Servers is to configure the SNMP parameters. This involves setting the appropriate read, write, and error-handling options for your agent server. Follow these steps to configure the SNMP parameters on your Windows NT/2000 servers:
1. Open the Windows Services Manager dialog box. In Windows NT, double-click on Network in the Control panel and select the Services tab. In Windows 2000, select Start → Program Files → Administrative Services → Services.
2. Select SNMP Services from the list of services.
3. Click the Properties button.
4. Click the Traps tab.
5. From the Accepted Community Names box, click the Add button.
6. Enter public in the Service Configuration dialog box.
7. Click the Add button.
8. Enter the DNS names or IP addresses of workstations or servers that should receive traps.
9. Click the Add button.
10. Click the Security tab.
11. From the Accepted Community Names, click the Add button.
12. Enter public in the Service Configuration dialog box.
13. Set the appropriate rights.
14. Click the Add button.
15. Select Accept SNMP Packets from Any Host.
16. Click the OK button to return to the Network window.
Whenever you make changes to the settings for the SNMP service, you should stop and restart the agent. Follow these steps to stop and restart the traffic analysis agent on a Windows NT/2000 Server:
1. Open the Services manager.
2. Select SNMP Services.
3. Click the Stop Button.
4. When the agent is stopped, click the Start button.
The Windows LANZCON utility provided with ZENworks for Servers 3 enables you to configure and view the traffic analysis agents. The Windows LANZCON utility is an executable that is installed on the desktop of the Windows NT/2000 Servers to which the traffic analysis agents were installed. Load the LANZCON utility on your Windows NT/2000 Server with the traffic analysis agents running to view and configure the following items:
![]() Configure LANalyzer Agent. Takes the place of editing the LANZ.NCF file on NetWare servers by letting you enable or disable packet capture and enable/disable station monitoring, and set memory bounds and age (how long to retain packet data before it is too old), concurrent sorting, and duplicate IP address alarms.
Configure LANalyzer Agent. Takes the place of editing the LANZ.NCF file on NetWare servers by letting you enable or disable packet capture and enable/disable station monitoring, and set memory bounds and age (how long to retain packet data before it is too old), concurrent sorting, and duplicate IP address alarms.
![]() Network Adapter. Displays a list of network adapters discovered by the agent. You can enable or disable a network adapter from monitoring the network.
Network Adapter. Displays a list of network adapters discovered by the agent. You can enable or disable a network adapter from monitoring the network.
![]() Agent Log. Displays a list of significant events and errors that occurred during a session.
Agent Log. Displays a list of significant events and errors that occurred during a session.
![]() Agent Status. Displays the current status and description of all agents that are installed on the server.
Agent Status. Displays the current status and description of all agents that are installed on the server.
![]() RMON Tables. Displays the statistics, history control, history data, host control, host entry, host topN control, host topN entry, matrix control, matrix SD entry, filter, channel, and buffer RMON tables for the network adapter. Also displays the alarm, event, and log RMON tables.
RMON Tables. Displays the statistics, history control, history data, host control, host entry, host topN control, host topN entry, matrix control, matrix SD entry, filter, channel, and buffer RMON tables for the network adapter. Also displays the alarm, event, and log RMON tables.
![]() SNMP Traps. Displays a list of traps that occurred on the managed segment, including the received time and a summary of the trap.
SNMP Traps. Displays a list of traps that occurred on the managed segment, including the received time and a summary of the trap.