

Chapter 8
Correlation-Driven Nonparametric
Learning
As described in Part II, several approaches have been proposed to select portfolios
from financial markets. The pattern matching–based approach, which is intuitive in
nature, can achieve best performance at the present time. However, one key chal-
lenge to this approach is to effectively locate a set of trading days whose price
relative vectors are similar to the coming one. As detailed in Section 6.1, existing
strategies often adopt Euclidean distance to measure the similarity between two pre-
ceding market windows. Euclidean distance can somehow measure the similarity;
however, it simply considers the neighborhood of the latest market windows and
ignores the linear or nonlinear relationship between two market windows, which is
important for price relative estimation. In this chapter, we propose to exploit similar
patterns via a correlation coefficient, which effectively measures the linear relation-
ship, and further propose a novel pattern matching–based online portfolio selection
algorithm “CORrelation-driven Nonparametric learning” (CORN) (Li et al. 2011a).
The proposed CORN algorithm can better locate a similarity set, and thus can output
portfolios that are more effective than existing pattern matching–based strategies.
Moreover, we also proved CORN’s universal consistency,
∗
which is a nice property
for the pattern matching–based algorithms. Further, in Part IV, we will extensively
evaluate the algorithm on several real stock markets, where the encouraging results
show that the proposed algorithm can easily beat both market index and best stock
substantially (without or with small transaction costs) and also surpass a variety of
the state-of-the-art techniques significantly.
This chapter is organized as follows. Section 8.1 motivates the proposed correla-
tion metric for selecting similarity sets. Section 8.2 details the ideas of the proposed
online portfolio selection algorithm, and then Section 8.3 illustrates the proposed
algorithms. Section 8.4 proves CORN’s universal consistency and further analyzes
the proposed algorithms. Finally, Section 8.5 summarizes this chapter and indicates
future directions.
∗
This property is missing in Li et al. (2011a).
47
T&F Cat #K23731 — K23731_C008 — page 47 — 9/28/2015 — 21:18
48 CORRELATION-DRIVEN NONPARAMETRIC LEARNING
8.1 Preliminaries
8.1.1 Motivation
One main idea of existing approaches is to optimize portfolios by mining similar
patterns and information from historical market sequences. Anticor (Borodin et al.
2004) attempts to find statistical relations between pairs of stocks, such as posi-
tive auto covariance and negative cross-covariance, while pattern matching–based
strategies (Györfi et al. 2006, 2008) try to discover similar appearances among histor-
ical markets. Though successful in mining statistical relations among stocks, Anticor
ignores market movements, which are crucial for a portfolio selection task. Moreover,
Anticor is heuristic in nature, which could lead to suboptimal solutions. On the other
hand, existing pattern matching–based strategies (Györfi et al. 2006, 2008) rely on
Euclidean distance to measure the similarity between two market windows. Though
their empirical performance is excellent, the Euclidean distance cannot exploit the
directional information between the two market windows. Therefore, it may detect
some useful price relatives, but often includes some potentially useless or even harm-
ful price relatives and excludes many beneficial price relatives. Such a similarity set
will finally weaken the following portfolio optimization step, resulting in less effective
portfolios.
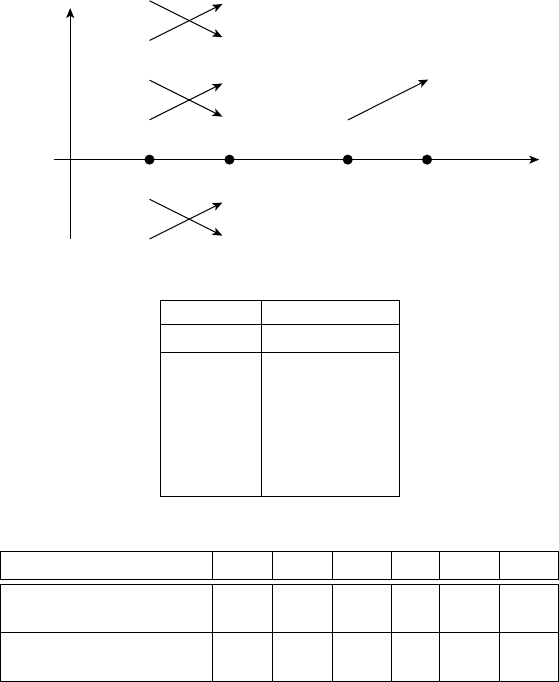
To better understand the drawbacks of Euclidean distance in measuring the simi-
larity between two market windows, we give a motivating example in Figure 8.1. Let
us assume that all market windows consist of two price relatives, such as a market of
one asset and the window size is two, or a market with two assets and the window size
equals one. Let the latest market window for the t-th period be x
t−1
t−2
= (1.10, 1.20).
Clearly, x
t−1
t−2
shows an increasing trend, and we aim to locate similar market windows
that also show increasing trends. Suppose we have three possible pairs of market win-
dows: A1: (0.90, 0.80), A2: (0.80, 0.90); B1: (1.2, 1.1), B2: (1.1, 1.2); C1: (1.4, 1.3),
C2: (1.3, 1.4). Note that in a long-only portfolio, relative trends, rather than absolute
trends, determine the allocations of capital.
∗
For example, although A2 contains two
decreasing price relatives (both 0.90 and 0.80 are less than 1), the market sequence is
relatively increasing (0.90 > 0.80). In case that the vectors contain two assets, for the
recent market window x
t−1
t−2
, it is better to allocate more capital on the second asset
(1.20 > 1.10), which is also the case in A2. However, this is not the case in B1 or C1,
though their absolute price relatives are all increasing.
†
Among the three pairs, A2,
B2, and C2 show increasing trends, while A1, B1, and C1 show decreasing trends.
Thus, a good similarity measure should classify A2, B2, and C2 as similar appear-
ances, which will benefit the next step, and A1, B1, and C1 as dissimilar appearances,
which will harm the subsequent portfolio optimization step.
Now let us classify these market sequences via a Euclidean distance measure with
a radius of 0.2,
‡
that is,
x
i−1
i−2
−x
t−1
t−2
≤ 0.2. According to Figure 8.1c, a Euclidean
∗
In our problem setting, there are no cash or risk-free assets. In reality, a weaker constraint (e.g., at
most, 90% of capital can be put in assets), may appear in mutual funds.
†
Because their first asset is more favorable than the second one, which is different from the latest x
t−1
t−2
.
‡
The radius is arbitrarily chosen to to limit the number of selected price relatives.
T&F Cat #K23731 — K23731_C008 — page 48 — 9/28/2015 — 21:18
PRELIMINARIES 49
Periods
Price relatives
0.80
1.00
1.20
1.40
X
t–1
t–2
i –2
i –1
t –2 t –1
...
A1
(a)
A2
B1
B2
C1
C2
Sequence Price relatives
x
t−1
t−2
(1.1, 1.2)
A1 (0.9, 0.8)
A2 (0.8, 0.9)
B1 (1.2, 1.1)
B2 (1.1, 1.2)
C1 (1.4, 1.3)
C2 (1.3, 1.4)
(b)
x
t−1
t−2
A1 A2 B1 B2 C1 C2
Euclidean distances 0.45 0.42 0.14 0 0.32 0.28
Similar? (Y/N) N N Y Y N N
Correlation coefficients −1 1
−1 1 −1
1
Similar? (Y/N)
N Y N Y N Y
(c)
Figure 8.1 A motivating example to illustrate the limitation of Euclidean distance.
(a) Market windows A1, A2, B1, B2, C1, C2, and x
t−1
t−2
, each of which contains two price
relatives. (b) The price relative vectors. (c) The market windows via Euclidean distance and
correlation coefficient.
measure will classify B1 and B2 to the similarity set, since they are both located
within the Euclidean ball of x
t−1
t−2
(with a radius of 0.2). Such a classification is
clearly suboptimal, as it includes harmful B1 and excludes beneficial A2 and C2. As a
consequence of the imperfect similarity set, the subsequent portfolio optimization
will considerably suffer from irrelevant or even harmful market windows (such as
market window B1) and the neglect of beneficial market windows (such as market
T&F Cat #K23731 — K23731_C008 — page 49 — 9/28/2015 — 21:18
50 CORRELATION-DRIVEN NONPARAMETRIC LEARNING
windows A2 and C2). This motivates us to overcome the limitation by exploring a
more effective similarity measure.
8.2 Formulations
The proposed algorithm is mainly inspired by the idea of exploiting statistical correla-
tions between two market windows, and also driven by the consideration of exploring
the powerful nonparametric learning techniques to effectively optimize a portfolio.
Traditional portfolio selection methods in finance often try to estimate a target
function based on past data and build portfolios based on the learned function. How-
ever, since the financial market is complex and accurate modeling of its movements
is a difficult task, we adopt a nonparametric learning approach (or instance-based
learning, or case-based learning) (Aha 1991; Aha et al. 1991; Cherkassky and Mulier
1998). Nonparametric learning makes no assumptions on data distribution (or mar-
ket distribution), and it captures the knowledge from stored training data without
building any target functions. In particular, at the beginning of every period, the pro-
posed algorithm locates similar price relatives among all past price relatives, and then
maximizes the expected multiplicative portfolio return directly based on the similar
appearances. Without estimating any global functions of the market movements, the
proposed algorithm estimates a target value of next price relative.
To overcome the limitation of Euclidean distance in mining historical market
windows and the negligence of whole-market movements in all existing strategies,
we propose to employ the Pearson product–moment correlation coefficient, which is
an effective tool for measuring statistical linear relationships. Note that it measures
the statistical correlations between market windows of all assets, rather than pairs
of assets as Anticor does. Since market windows of all assets represent the whole-
market movements in a period, they could be more effective to match the similar price
relatives regarding the whole market.
Till now, we declare a correlation-similar set that contains historical trading days
whose previous market windows are statistically correlated to the latest one, and
formally define it as
C
t
(w, ρ) =
w<i<t+1
cov
x
i−1
i−w
, x
t
t−w+1
std
x
i−1
i−w
std
x
t
t−w+1
≥ ρ
!
,
where w denotes the window size, −1 ≤ ρ ≤ 1 is a correlation coefficient threshold,
cov(A, B) denotes the covariance between market windows A and B, and std(A)
denotes the standard deviation of market window A. If either std term equals 0, that
is, the market is of zero volatility in a specific window, we simply set the correlation
coefficient to 0. In the above calculation, both matrix x
i−1
i−w
and x
t
t−w+1
are concate-
nated into m ×w-dimensional vectors, and we can obtain the univariate correlation
coefficient between the two market windows.
The correlation coefficient measure distinguishes the proposed algorithm from
previous nonparametric learning strategies, which measure the similarity via
Euclidean distance. First, Euclidean distance only considers the magnitude between
T&F Cat #K23731 — K23731_C008 — page 50 — 9/28/2015 — 21:18
ALGORITHMS 51
two market windows, while the proposed correlation coefficient measures their linear
similarity, in both magnitude and direction. On the one hand, it considers the direction.
For example, ρ
1
= 0.8 and ρ
2
=−0.8 intuitively correspond to equivalent magni-
tudes of linear dependence or similarity; however, they are in opposite directions, that
is, the first market window is in the same trend with the latest market window, and the
other is opposite. On the other hand, it also considers the magnitude. For example,
ρ
1
= 0.8 and ρ
2
= 0.2 clearly indicate that the first market window is more suitable
than the second one (ρ
1
> ρ
2
). Thus, the correlation coefficient measure considers not
only magnitude but also direction, which are appropriately balanced. With such lin-
ear dependence, we can better identify similar price relatives, thus leading to superior
performance. Euclidean distance may also be used to measure directional information
indirectly, for example, by using the slope of two centralized points. However, such
a method only measures the directional information but ignores their magnitude.
Second, to calculate the univariate correlation coefficient, we will calculate the
arithmetic mean of both m ×w-dimensional vectors. This mean return is uniformly
distributed among m assets over w periods, which is in essence the market strategy.
As a result, the mean return actually reflects the whole-market movements during the
window.Thecorrelationcoefficient measures the lineardependencybetweentwo mar-
ket windows, whose means represent the whole-market movements. This, therefore,
distinguishes the proposed strategy from Anticor strategy and existing nonparametric
learning strategies, which ignore the whole market.
Now let us return to the preceding motivating example and select a similarity
set via correlation coefficient metric, with a threshold of 0. Figure 8.1(c) clearly
shows that the metric can correctly classify these market windows, whose results are
identical to our intuitive analysis. In particular,A2, B2, and C2 are classified as similar,
and A1, B1, and C1 are classified as dissimilar. Note that our example is extremely
straightforward and thus results in extreme values (either +1or−1), which is not
always the case.
8.3 Algorithms
Next, we present the proposed CORN algorithm, which exploits the correlation-
similar set in optimizing portfolios for actively rebalancing.
We start by defining a set of W ×P experts, each expert indexed by (w, ρ), that is,
{E(w, ρ) : w ≥ 1, −1 ≤ ρ ≤ 1},
and W represents the maximum window size and P represents the number of corre-
lation coefficient thresholds. Each expert E(w, ρ) represents a CORN expert learning
algorithm and outputs a portfolio, denoted as E(w, ρ) = b(w, ρ).
As summarized in Algorithm 8.1, a CORN expert learning algorithm consists of
two major steps. The first step, as illustrated in Section 8.2, is to locate a correlation-
similar set via the correlation coefficient metric, and the second step is to obtain an
optimized portfolio that can maximize the expected return, which is the main target
of our research. After calculating the correlation-similar set C
t
(w, ρ) at the end of
T&F Cat #K23731 — K23731_C008 — page 51 — 9/28/2015 — 21:18
..................Content has been hidden....................
You can't read the all page of ebook, please click here login for view all page.