THE PMP® EXAM CONTENT FROM THE PLANNING PERFORMANCE DOMAIN COVERED IN THIS CHAPTER INCLUDES THE FOLLOWING:
✓ Review and assess detailed project requirements, constraints, and assumptions with stakeholders based on the project charter, lessons learned, and by using requirement gathering techniques in order to establish the project deliverables.
✓ Develop a scope management plan, based on the approved project scope and using scope management techniques, in order to define, maintain, and manage the scope of the project.
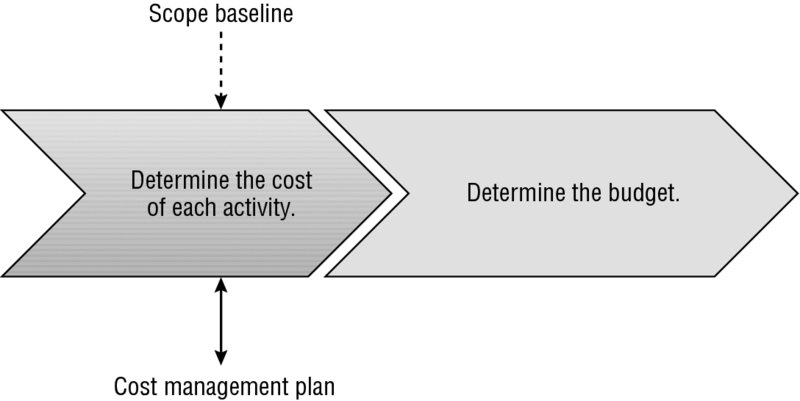
✓ Develop the cost management plan based upon the project scope, schedule, resources, approved project charter and other information, using estimating techniques, in order to manage project costs.
✓ Develop the project schedule based on the approved project deliverables and milestones, scope, and resource management plans in order to manage timely completion of the project.
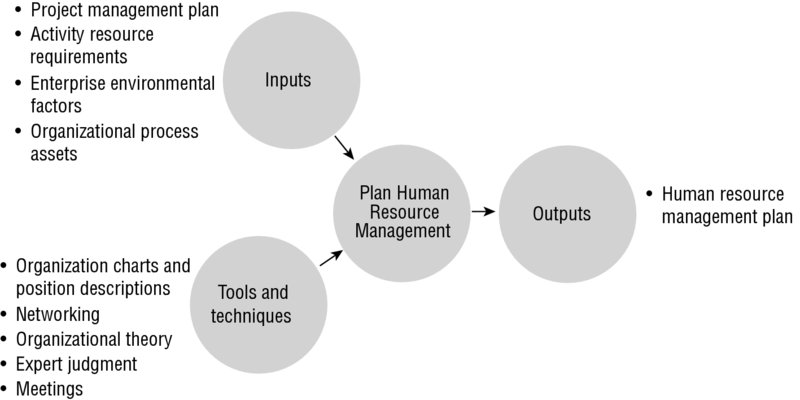
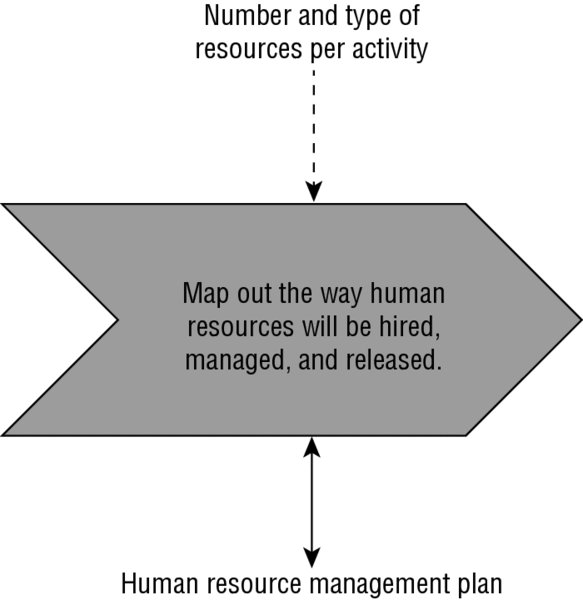
✓ Develop the human resource management plan by defining the roles and responsibilities of the project team members in order to create a project organizational structure and provide guidance regarding how resources will be assigned and managed.
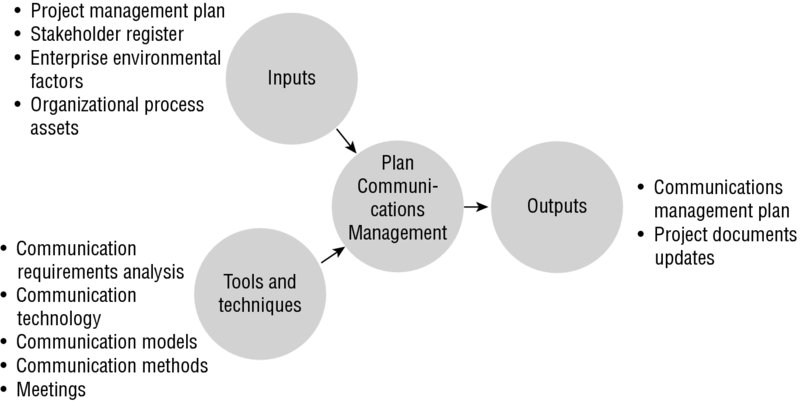
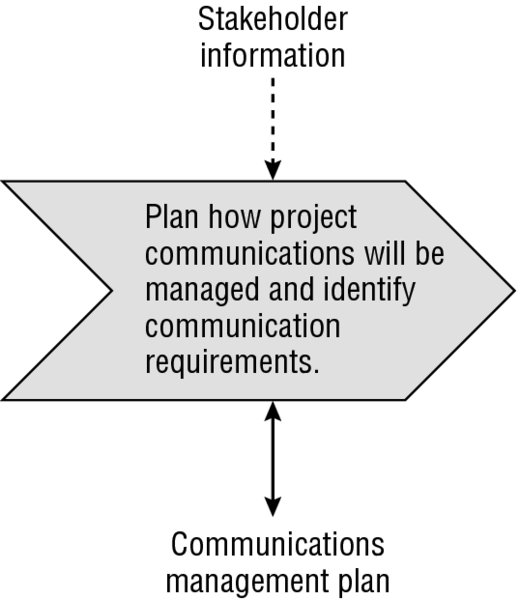
✓ Develop the communication management plan based on the project organizational structure and stakeholder requirements in order to define and manage the flow of project information.
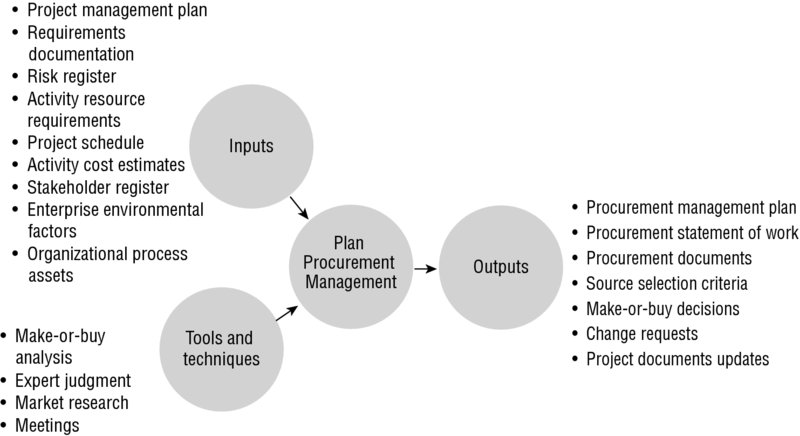
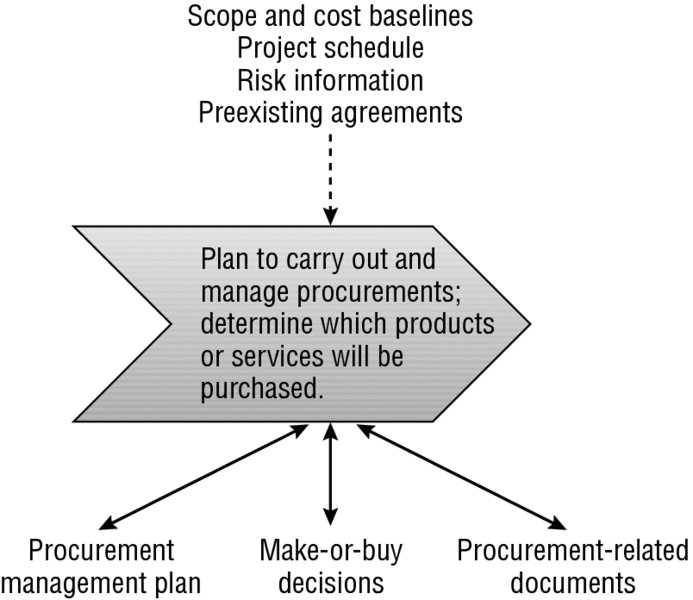
✓ Develop the procurement management plan based on the project scope, budget, and schedule in order to ensure that the required project resources will be available.
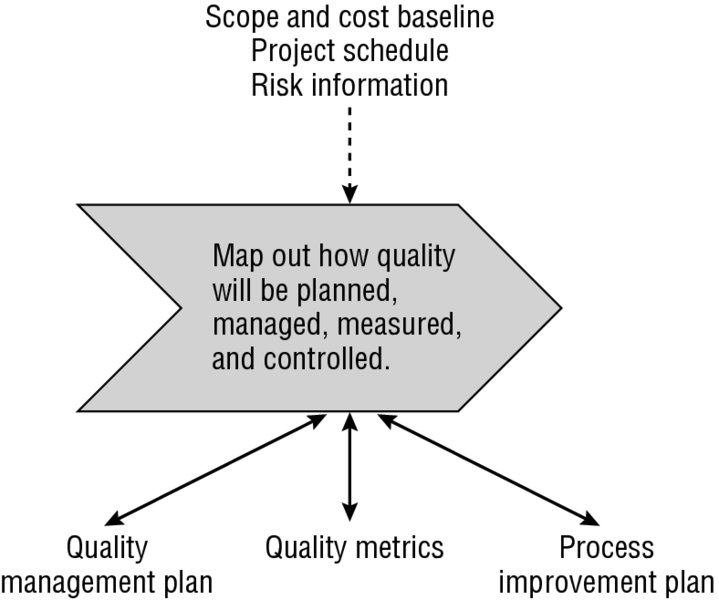
✓ Develop the quality management plan and define the quality standards for the project and its products, based on the project scope, risks, and requirements in order to prevent the occurrence of defects and reduce the cost of quality.
✓ Develop the change management plan by defining how changes will be addressed and controlled in order to track and manage change.
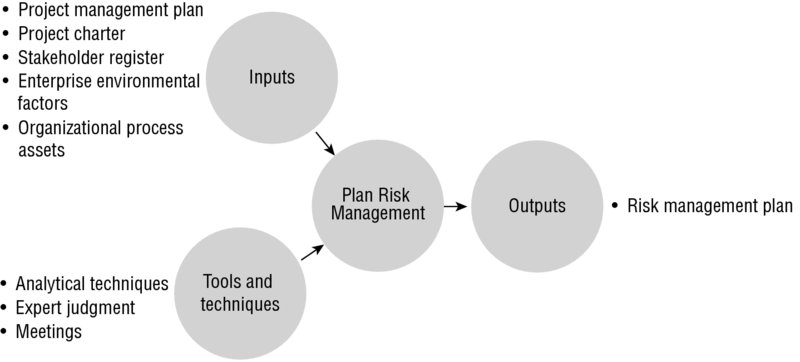
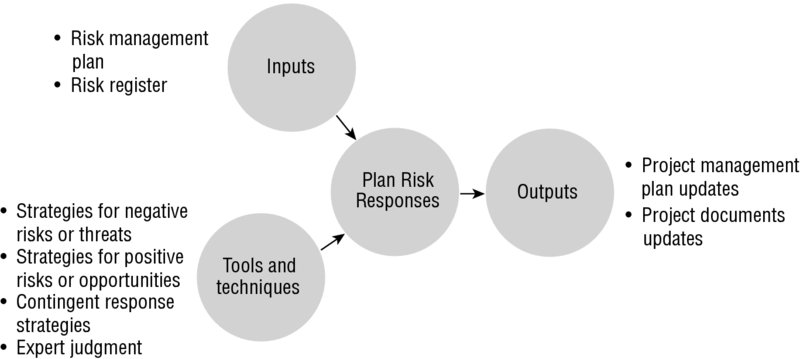
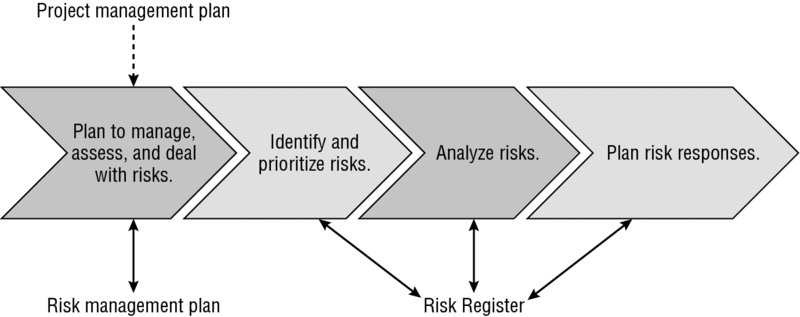
✓ Plan for risk management plan by developing a risk management plan; identifying, analyzing, and prioritizing project risk; creating the risk register; and defining risk response strategies in order to manage uncertainty and opportunity throughout the project life cycle.
✓ Present the project management plan to the relevant stakeholders according to applicable policies and procedures in order to obtain approval to proceed with project execution.
✓ Conduct kick-off meeting, communicating the start of the project, key milestones, and other relevant information in order to inform and engage stakeholders and gain commitment.
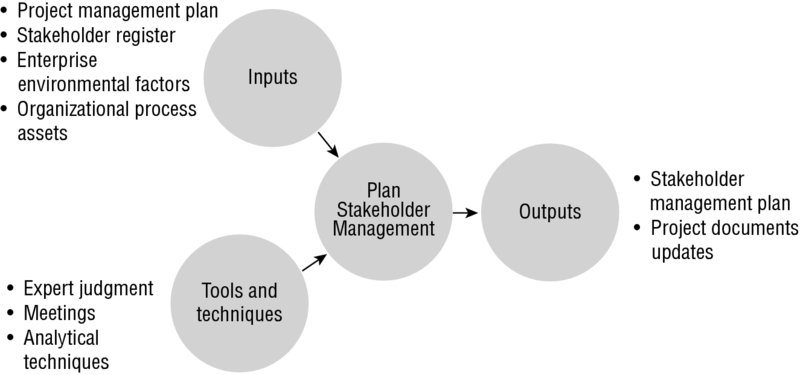
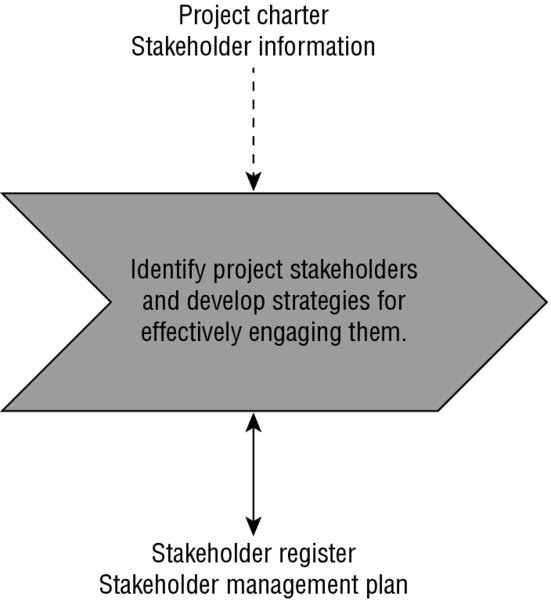
✓ Develop the stakeholder management plan by analyzing needs, interests, and potential impact in order to effectively manage stakeholders’ expectations and engage them in project decisions.
Planning is the second of five project management process groups and includes the largest number of processes. Throughout the planning processes, the objectives are defined and refined, and a course of action is mapped out to successfully complete the project objectives as outlined by the project scope.
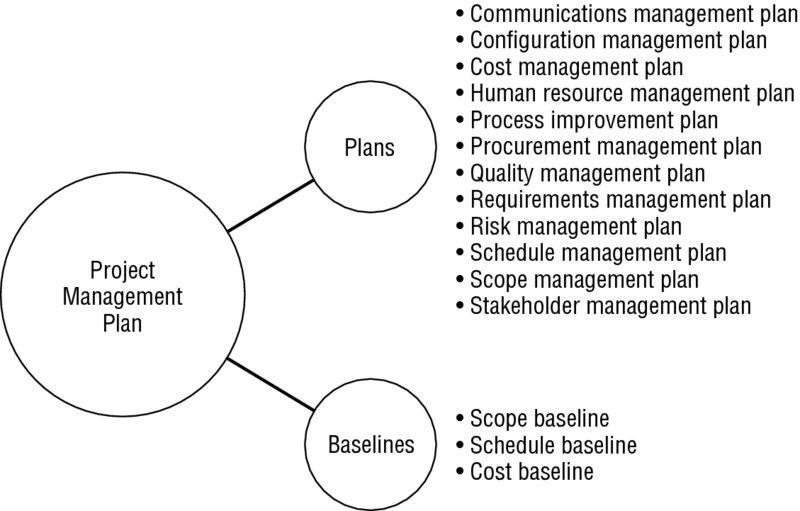
Several key project documents are created within this process group, including the project management plan and its collection of subsidiary plans and baselines, which will guide the project management activities.
The Planning process group accounts for 24 percent of the questions on the Project Management Professional (PMP®) exam.
Developing a Scope Management Plan
The Project Scope Management Knowledge Area is kicked off through a process that develops two key plans that will guide the identification of requirements, as well as the development, validation, and management of the project’s scope. These plans, referred to as the scope management plan and requirements management plan, are subsidiary documents of an overarching plan called the project management plan.
Understand Project Scope Management
The scope management plan is the culmination of the processes needed to guarantee that the project includes all the work required to complete the project successfully. It also works to make sure that the project focuses only on the work required to complete the project and does not include unneeded tasks. As you learned in Chapter 2, “Initiating the Project,” the Project Scope Management Knowledge Area consists of six processes, but only four of them are a part of the Planning process group. The four processes used in the Planning process group are Plan Scope Management, Collect Requirements, Define Scope, and Create WBS.
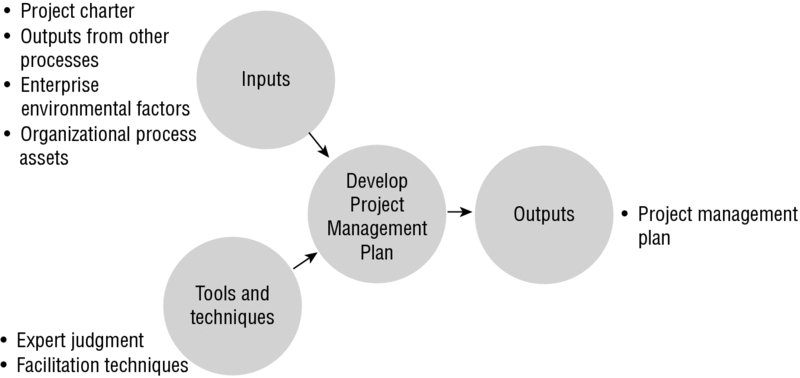
Plans not created out of a formal process are considered to be generated out of the Develop Project Management Plan process, which is a high-level planning process that will be covered later in this chapter.
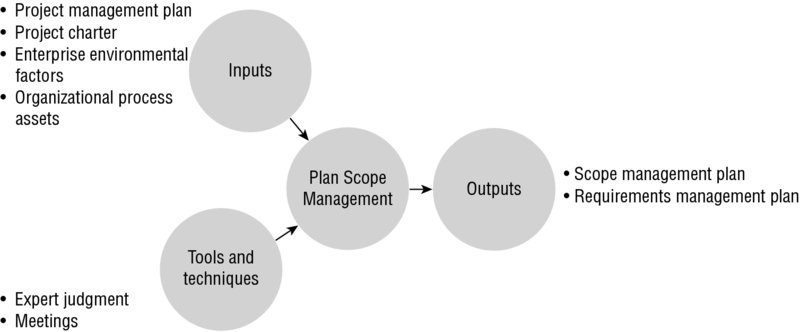
Figure 3.1 shows the inputs, tools and techniques, and outputs of the Plan Scope Management process.
The scope management plan contains the following information or explanations:
The process used to prepare the project scope statement
A process for creating the work breakdown structure (WBS)
A definition of how the deliverables will be validated for accuracy and the process used for accepting deliverables
A description of the process for controlling scope change requests, including the procedure for requesting changes and how to obtain a change request form
Keep in mind that throughout the Project Scope Management Knowledge Area, the scope management plan serves as a guide for documenting and controlling the scope of the project.
Inputs of Plan Scope Management
Know the following four inputs of the Plan Scope Management process:
Project Management Plan To help inform what the project is intended to accomplish, the project management plan with all of its approved subsidiary plans are used to help create the scope management plan.
Project Charter As the project charter helps to communicate the high-level goals, business needs, assumptions, and constraints, it is used in this process to align the scope management plan with stakeholder expectations.
Enterprise Environmental Factors Several enterprise environmental factors can influence the Plan Scope Management process, including but not limited to the organization’s culture, its infrastructure, marketplace conditions, and personnel administration.
Organizational Process Assets Policies, procedures, and historical information, including a lessons learned knowledge base, are a few of the organizational process assets that help shape the scope management plan.
Tools and Techniques of Plan Scope Management
The two tools and techniques that the Plan Scope Management process uses are expert judgement and meetings:
Expert Judgment Input that is received from experienced team members and those who are knowledgeable about the project area provide what is considered to be expert judgment. Be sure that you look to all corners of your organization for any person or group with specialized education or training, or who might possess knowledge, skills, and/or experience in helping to develop the scope management plan.
Meetings In the course of developing the scope management plan, members of project teams may attend meetings to help with information exchange and decision making. Depending on the meeting, the following members might be a part of the discussion to include: project manager, project sponsor, selected project team members, and anyone having responsibility in this area.
Outputs of Plan Scope Management
For the exam, know the outputs of the Plan Scope Management process. This includes, naturally, the scope management plan, as well as the requirements management plan.
The components of this plan include processes for
Preparing a detailed project scope statement
Creating a WBS from the detailed project scope statement
Establishing how the WBS will be maintained and approved
Specifying how formal acceptance will be obtained for completed project deliverables
Controlling and handling change requests to the detailed project scope statement
Requirements Management Plan
The requirements management plan defines how the requirements will be analyzed, documented, and managed throughout all phases of the project. The type of phase relationship used to manage the project will determine how requirements are managed throughout the project. A requirements management plan includes the following components:
How planning, tracking, and reporting of requirements activities will occur
How changes to the requirements will be requested, tracked, and analyzed along with other configuration management activities
How requirements will be prioritized
Which metrics will be used to trace product requirements
Which requirements attributes will be documented in the traceability matrix
The structure that will be used to help create the traceability matrix
Collect Requirements
During the early stages of planning, requirements will need to be collected, documented, and assessed. This is carried out through the Collect Requirements process (one of the 47 project management processes). This tends to be an iterative process because requirements often need to be refined as the project moves forward.
As covered in Chapter 2, high-level requirements are documented within the project charter. Based on this document and lessons learned from past projects, detailed requirements will need to be gathered and assessed with the stakeholders. This is necessary to establishing the project deliverables. Detailed requirements can be gathered through the use of several requirement-gathering techniques that will produce a comprehensive list of requirements and that are needed to later establish the project deliverables. Collect Requirements is the third process within the Planning process group, following the creation of the scope management plan, and the second process in the Project Scope Management Knowledge Area. The primary purpose of the Collect Requirements process is to define and document the project sponsors’, customers’, and stakeholders’ expectations and needs for meeting the project objectives. This can be done through the use of lessons learned from previous projects, information from within the project charter and stakeholder register, and several requirement-gathering techniques. By the end of this process, the project will include a plan that defines how the requirements will be documented and managed throughout all phases of the project.
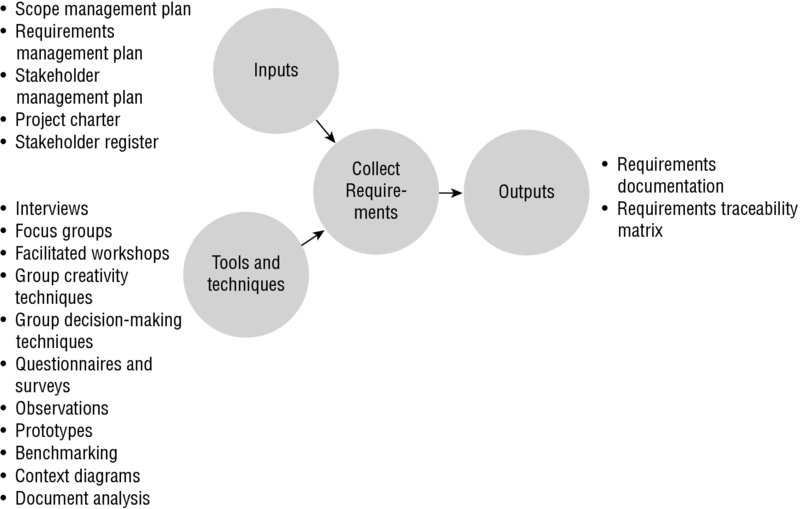
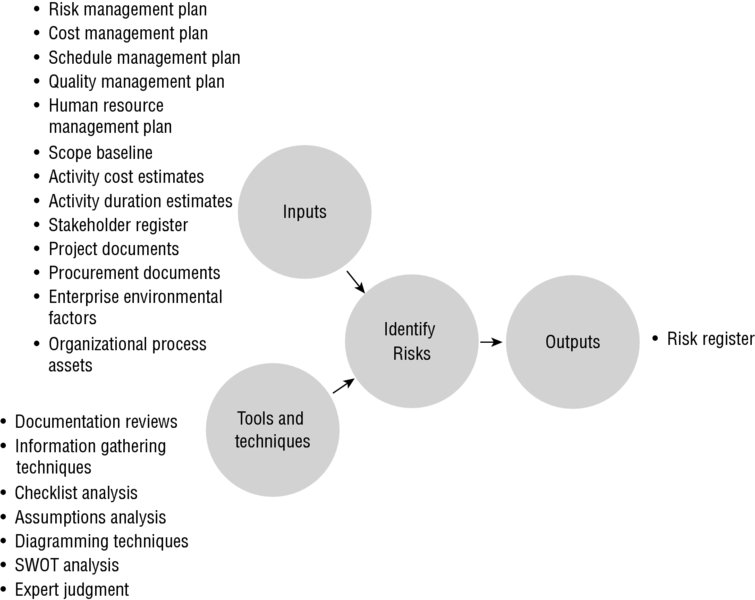
Figure 3.2 shows the inputs, tools and techniques, and outputs of the Collect Requirements process.
Know the following inputs of the Collect Requirements process:
Scope Management Plan The scope management plan provides direction on how members of the project pick the type of requirements needed to be collected for the project.
Requirements Management Plan The requirements management plan helps define and document the stakeholders’ wants and needs.
Stakeholder Management Plan We will cover the stakeholder management plan in the “Developing a Stakeholder Management Plan” section later in this chapter. For the collect requirements process, the stakeholder management plan is used to document the stakeholder communication requirements and their level of engagement. This will help the project team adjust the requirements activities to the level of stakeholder participation that is needed.
Project Charter In this process, the high-level project requirements and product description are used from within the project charter.
Stakeholder Register In this process, the stakeholder register is used as a way of determining who can provide the necessary information on the project and product requirements.
Tools and Techniques of Collect Requirements
Know the following tools and techniques that can be used during the Collect Requirements process:
Interviews
Focus groups
Facilitated workshops
Group creativity techniques
Group decision-making techniques
Questionnaires and surveys
Observations
Prototypes
Benchmarking
Context diagrams
Document analysis
Interviews Interviews allow subject matter experts and experienced project participants to impart a lot of information in a short amount of time. The following are characteristics of interviews:
Typically structured as a one-on-one conversation with stakeholders
Can be formal or informal
Consist of questions prepared ahead of time
Focus Groups Focus groups are usually conducted by a trained moderator. The key to this tool lies in picking the subject matter experts and stakeholders to participate in the focus group; they then engage in discussion and conversation as a way of imparting their feedback about the project’s end result.
Facilitated Workshops Cross-functional stakeholders come together in a facilitated workshop to discuss and define requirements that affect more than one department. The following are characteristics of facilitated workshops:
All the participants of the workshops understand the various project needs.
The workshops provide a facilitated forum to discuss and resolve their participants’ issues.
A consensus is reached more easily than through other methods.
Group Creativity Techniques Group creativity involves the following techniques:
Brainstorming Brainstorming involves getting together to generate ideas and gather the project requirements.
Nominal Group Technique Nominal group technique works to engage all participants through an idea-gathering or structured brainstorming session and ranking process.
Idea/Mind Mapping In idea/mind mapping, participants use a combination of brainstorming and diagramming techniques to record their ideas.
Affinity Diagrams Affinity diagrams sort ideas into related groups for further analysis and review.
Multicriteria Decision Analysis With multicriteria decision analysis, a decision matrix is used for establishing criteria for a systematic analytical approach.
Group Decision-Making Techniques According to the PMBOK ® Guide, several group decision-making techniques are used. The four methods mentioned are as follows:
Unanimity, where everyone agrees on the resolution or course of action
Majority, where more than 50 percent of the members support the resolution
Plurality, where the largest subgroup within the group makes the decision if a majority is not reached
Dictatorship, where one person makes the decision on behalf of the group
Questionnaires and Surveys Questionnaires and surveys involve querying a large group of participants via questionnaires or surveys and applying statistical analysis, if needed, to the results. This is considered to be a quick way of obtaining feedback from a large number of stakeholders.
Observations Observations consist of a one-on-one experience where an observer sits side by side with the participant to observe how the participant interacts with the product or service. This technique is also known as job shadowing; it can also involve participant observers who perform the job themselves to ascertain requirements, or the observation of a group of participants performing a job function. Observations are particularly useful when stakeholders have a difficult time verbalizing requirements.
Prototypes Prototyping is a technique involving constructing a working model or mock-up of the final product for participants to experiment with. The prototype does not usually contain all the functionality the end product does, but it gives participants enough information that they can provide feedback regarding the mock-up. This is an iterative process where participants experiment and provide feedback, the prototype is revised, and the cycle starts again. Prototypes are a great way of getting feedback during the early stages of a project’s life cycle.
Benchmarking Ever like to see how you measure up against other organizations or internal projects? With benchmarking there is a comparison of actual or planned practices against comparable organizations to measure performance, to glean new ideas to be used to improve your organization, and to identify best practices.
Context Diagrams Use of context diagrams helps to visually represent the product scope by mapping a business system with the people and other systems that interact with that business system. This is done by displaying the business system inputs and user roles, and then depicting the inputs, outputs, and user roles for those who receive the output.
Document Analysis Another technique used in the identification of requirements is documents analysis, where existing documentation is reviewed to see if there is relevant information to complete the requirements. According to the PMBOK® Guide, a great variety of documents could be scrutinized, including but not limited to the following:
Business plans
Marketing materials
Contractual agreements
Requests for proposals
Business processes or interface documentation
Use cases
Problem/issues logs
Policies and procedures
Regulatory documents
Outputs of Collect Requirements
For the exam, know the outputs of the Collect Requirements process, which are as follows:
Requirements Documentation This output involves recording the requirements in a requirements document. According to the PMBOK® Guide, this document includes at least the following elements:
Business need for the project and why it was undertaken
Objectives of the project and the business objectives the project hopes to fulfill
Stakeholder requirements, including impacts to other organizational areas
Functional requirements
Nonfunctional requirements
Quality requirements
Acceptance criteria
Business rules
Organizational areas and outside entities impacted
Support and training requirements
Assumptions and constraints
Signatures of the key stakeholders
Requirements Traceability Matrix The traceability matrix links requirements to business needs and project objectives and also documents the following:
Where the requirement originated
What the requirement will be traced to
Status updates all the way through delivery or completion
Table 3.1 shows a sample traceability matrix with several attributes that identify the requirement.
Here are the characteristics of a traceability matrix:
Each requirement should have its own unique identifier.
A brief description includes enough information to easily identify the requirement.
The source column refers to where the requirement originated.
Priority refers to the priority of the requirement.
The test scenario records how the requirement will be tested or during which project phase, and test verification indicates if it passes or fails the test.
Status may capture information about the requirement that refers to whether the requirement has been approved to be included in the project. Examples include added, deferred, and canceled.
After requirements have been gathered, the next step is to begin breaking down and documenting the project and product’s scope. The end result will be a WBS, which is a deliverable-oriented, high-level decomposition of the project work. But before the WBS can be generated, a few additional steps must be addressed:
The creation and sign-off of the project scope statement
The creation of a scope baseline
The project scope statement is an output of the Define Scope process and is where the project deliverables are documented along with the constraints and assumptions of the project. Once the project scope statement, WBS, and another output called the WBS dictionary are created, they become part of a scope baseline.
Define Scope
The result and main objective of the Define Scope process is the creation of the project scope statement. The project scope statement is used to develop and document a detailed description of the deliverables of the project and the work needed to produce them. This process addresses the project objectives, requirements, constraints, assumptions, and other elements of writing the project scope statement and is progressively elaborated as more detail becomes known.
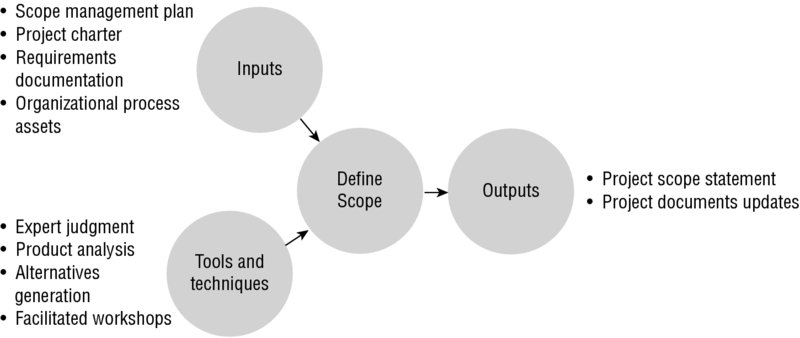
Figure 3.3 shows the inputs, tools and techniques, and outputs of the Define Scope process.
The Define Scope process has four inputs you should know:
Scope Management Plan The scope management plan outlines how this process is to be carried out.
Project Charter From within the project charter, this process primarily utilizes the project objectives. Objectives are quantifiable criteria used to measure project success. They describe what the project is trying to do, accomplish, or produce. Quantifiable criteria should at least include the following items:
Schedule
Cost
Quality measures
Business measures or quality targets (sometimes)
Requirements Documentation The requirements documentation includes elements such as functional and nonfunctional characteristics, quality metrics, and acceptance criteria. For a more detailed description, see “Outputs of Collect Requirements” earlier in this chapter.
Organizational Process Assets This process uses historical information from within the organizational process assets as well as policies, procedures, and project scope statement templates.
Tools and Techniques of Define Scope
Know the following tools and techniques that you will use during the Define Scope process:
Expert Judgment According to the PMBOK® Guide, the following items are examples of expert judgment used in this process:
Subject matter experts or consultants
Stakeholders
Industry groups and associations
Other departments or units internal to the organization
Product Analysis Product analysis is a method for converting the product description and project objectives into deliverables and requirements. According to the PMBOK® Guide, product analysis might include performing the following to further define the product or service:
Value analysis
Functional analysis
Requirements analysis
Systems-engineering techniques
Systems analysis
Product breakdown
Value-engineering techniques
Alternatives Generation Alternatives generation is a technique used for discovering different methods or ways of accomplishing the work of the project. Examples of alternatives generation are brainstorming and lateral thinking.
Lateral thinking is a process of separating problems, looking at them from angles other than their obvious presentation, and encouraging team members to come up with ways to solve problems that are not apparently obvious or look at scope in a different way. This can also be described as out-of-the-box thinking.
Facilitated Workshops Facilitated workshops involve stakeholders coming together to discuss and define requirements that affect more than one department.
Outputs of Define Scope
Know the following outputs of the Define Scope process:
Project Scope Statement The purpose of the project scope statement is to document the project objectives, deliverables, and the work required to produce the deliverables so that it can be used to direct the project team’s work and as a basis for future project decisions. The project scope statement is an agreement between the project organization and the customer that states precisely what the work of the project will produce.
According to the PMBOK® Guide, the project scope statement should include all of the following:
Product scope description
Product acceptance criteria
Project deliverables
Project exclusions
Project constraints
Project assumptions
Product Scope Description The product scope description describes the characteristics of the product, service, or result of the project.
Product Acceptance Criteria Product acceptance criteria include the process and criteria that will be used to determine whether the deliverables and the final product, service, or result of the project is acceptable and satisfactory.
Project Deliverables Deliverables are measurable outcomes, measurable results, or specific items that must be produced to consider the project or project phase completed. Deliverables should be specific, unique, and verifiable and may include supplementary outcomes.
Project Exclusions Project exclusions are anything that isn’t included as a deliverable or work of the project. Project exclusions should be noted in the project scope statement for stakeholder management purposes.
Project Constraints Anything that either restricts the actions of the project team or dictates the actions of the project team or the way the project should be performed is considered a constraint. The project manager must balance the project constraints while meeting or exceeding the expectations of the stakeholders.
Examples of project constraints include, but are not limited to, the following items:
Scope
Quality
Schedule
Budget
Resources
Risk
Project Assumptions Assumptions are things considered true, real, or certain, for planning purposes. Each project will have its own set of assumptions, and the assumptions should be identified, documented, validated, and updated throughout the project. Defining new assumptions and refining old ones are forms of progressive elaboration. The following list includes examples of assumptions:
Vendor delivery times
Product availability
Contractor availability
Accuracy of the project plan
Belief that key project members will perform adequately
Contract signing dates
Project start dates
Project phase start dates
Project Documents Updates Project documents encompass those documents from within the project that are not plans or baselines. There may be several common updates and changes to project documents resulting from this process:
Original project objectives
Stakeholder register
Requirements documentation
Requirements traceability matrix
The scope statement as a result of approved changes
Create WBS
The Create WBS process takes the well-defined deliverables and requirements and begins the process of breaking down the work via a WBS. WBS stands for work breakdown structure, which defines the scope of the project and breaks down the deliverables into smaller, more manageable components of work that can be scheduled and estimated as well as easily assigned, monitored, and controlled. The WBS should detail the full scope of work needed to complete the project.
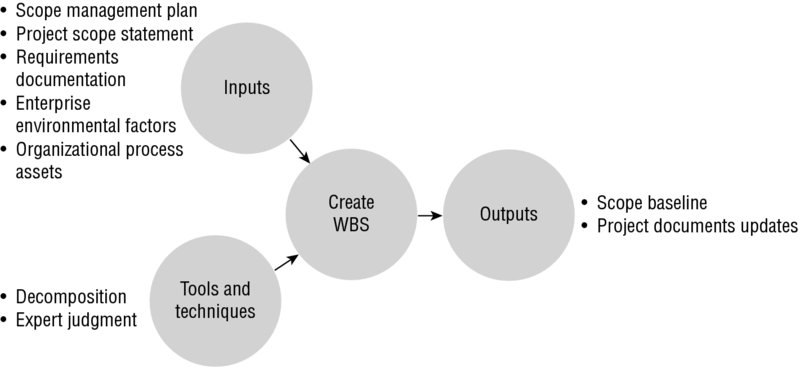
Figure 3.4 shows the inputs, tools and techniques, and outputs of the Create WBS process.
For the exam, know the following inputs of the Create WBS process:
Scope Management Plan The scope management plan is a planning tool that documents how the project team will define project scope, how changes to scope will be maintained and controlled, and how scope will be verified.
Project Scope Statement The project scope statement contains information valuable to creating the WBS, most notably the list of project deliverables.
Requirements Documentation The requirements documentation describes how the requirements meet the business needs of the project.
Enterprise Environmental Factors In addition to enterprise environmental factors that have already been discussed, there may be industry-specific WBS standards that are relevant to the type of project that you are undertaking. If so, that information may serve as an additional reference to the creation of the WBS.
Organizational Process Assets This process uses historical information from within the organizational process assets as well as policies, procedures, and WBS templates.
Tools and Techniques of Create WBS
The Create WBS process has two tools and techniques: decomposition and expert judgment.
Decomposition Decomposition involves breaking down the project deliverables into smaller, more manageable components of work that can be easily planned, executed, monitored and controlled, and closed out.
The project manager typically decomposes the work with the help of the project team, whose members have expert knowledge of the work. Benefits of team involvement include a more realistic decomposition of the work and getting team buy-in.
Decomposition provides a way of managing the scope of the project and also does the following:
Improves estimates
More easily assigns performance measures and controls
Provides a baseline to compare against throughout the project or phase
Ensures that assignments go to the proper parties
According to the PMBOK® Guide, decomposition consists of the following five-step process:
Identify the deliverables and work.
Organize the WBS.
Decompose the WBS components into lower-level components.
Assign identification codes.
Verify the WBS.
Expert Judgment For creating the WBS, expert judgment is routinely used to start breaking down project deliverables by analyzing the information available. Don’t forget that expert judgment can also come in the form of predefined templates, which provide instructions on how to effectively break down common deliverables. Templates can come from the industry you are working in, or created by your organization as a result of experience gained from performing similar projects.
Outputs of Create WBS
The Create WBS process has two outputs:
Scope baseline
Project documents updates
Scope Baseline The scope baseline for the project is the approved project scope statement, the WBS, and the WBS dictionary. These documents together describe in detail all the work of the project. The documents allow managers to carry out the following activities:
Document schedules
Assign resources
Monitor and control the project work
Work Breakdown Structure (WBS) The following are various ways of organizing the WBS:
Major Deliverables The major deliverables of the project are used as the first level of decomposition in this structure.
Subprojects Another way to organize the work is by subprojects. Each of the subproject managers will develop a WBS for their subproject that details the work required for that deliverable.
Project Phases Many projects are structured or organized by project phases. Each phase listed here would be the first level of decomposition, and its deliverables would be the next level.
The following is a general description of the various levels within the WBS:
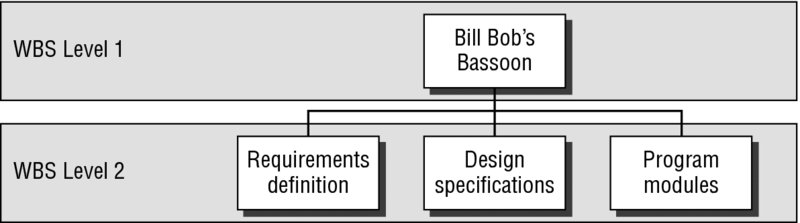
Level 1 According to the PMBOK® Guide, Level 1 of the WBS is the project level. The first level of decomposition, however, may be the second level of the WBS, which could include deliverables, phases, and subprojects—see Figure 3.5 for an example.
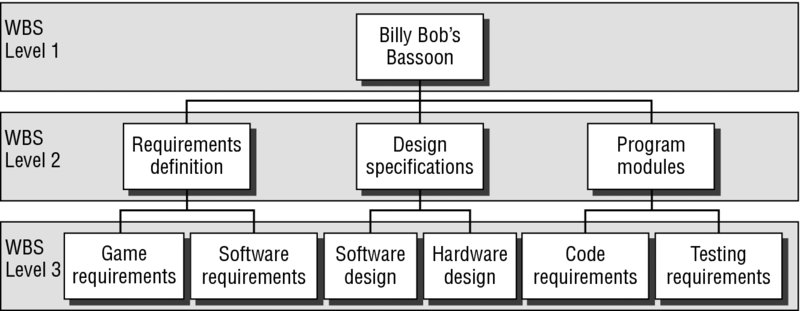
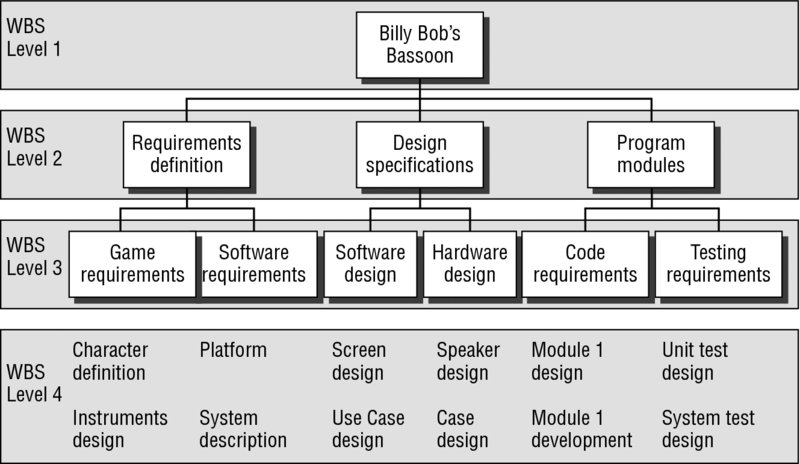
Level 2 Level 2 and levels that follow show more and more detail. Each of these breakouts is called a level in the WBS. See Figures 3.6 and 3.7 for examples.
Lowest Level The lowest level of any WBS is called the work package level. The goal is to construct the WBS to the work package level where cost estimates and schedule dates can be estimated reliably and easily.
Collectively, all the levels of the WBS roll up to the top so that all the work of the project is captured. According to the PMBOK® Guide, this is known as the 100 percent rule.
Here are the other elements of the WBS that you should know:
WBS Templates Work breakdown structures can be constructed using WBS templates or the WBS from a similar completed project. Although every project is unique, many companies and industries perform the same kind of projects repeatedly.
Rolling Wave Planning Rolling wave planning is a process of elaborating deliverables, project phases, or subprojects in the WBS to differing levels of decomposition depending on the expected date of the work.
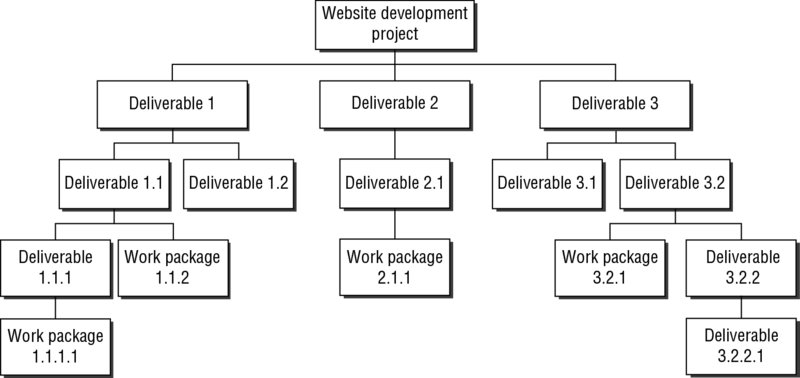
Unique WBS Identifiers Each element at each level of the WBS is generally assigned a unique identifier according to the PMBOK® Guide. Figure 3.8 shows what a WBS with unique identifiers displayed might look like.
WBS Dictionary The WBS dictionary is where work component descriptions are documented. According to the PMBOK® Guide, the WBS dictionary should include the following elements for each component of the WBS:
Code of accounts identifier
Description of the work of the component
Organization responsible for completing the component
List of schedule milestones
Schedule activities associated with the schedule milestones
Required resources
Cost estimates
Quality requirements
Criteria for acceptance
Technical references
Contract information
Project Documents Updates The following documents may need to be updated as a result of this process:
Project scope statement
Requirements documentation
Any other project documents that should reflect approved changes to the project scope statement
Developing a Project Schedule
Like the Project Scope and Project Cost Management Knowledge Areas, the Project Time Management Knowledge Area also has a plan that guides the processes within it: the schedule management plan. A good tip to remember is that there is a pattern to the logic regarding a standard and consistent methodology in each of the Knowledge Areas described in this chapter, namely that each Knowledge Area leads with a process to develop the plan for that area of management. In this chapter, that process is called Plan Schedule Management.
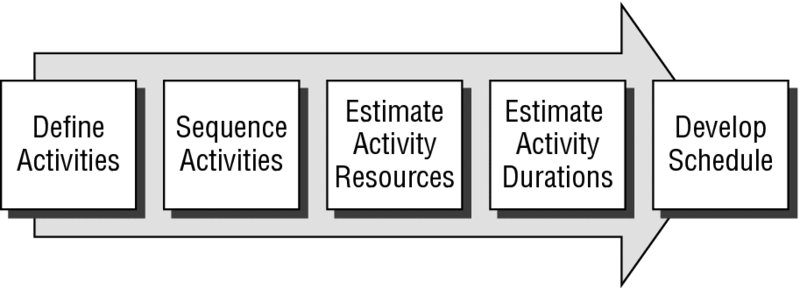
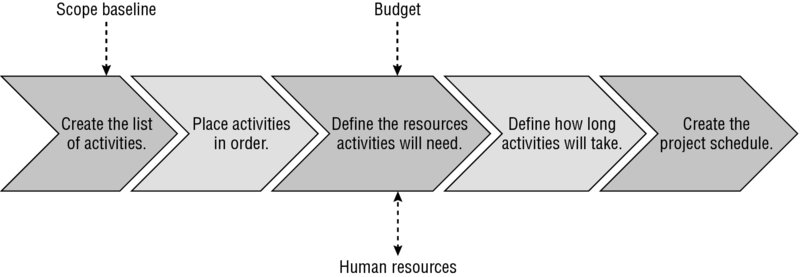
Developing a schedule consists of six steps, each carried out through a formal planning process:
Plan Schedule Management, which is similar to processes in other Knowledge Areas, sets the policies, procedures, and documentation used in the planning, creation, managing, executing, and controlling of the project schedule.
Define Activities, which breaks down the work packages of the WBS into detailed work (activities) to be carried out by project team members.
Sequence Activities, which places the activities into a logical order based on existing dependencies.
Estimate Activity Resources, which estimates the type and quantity of resources needed to carry out each activity.
Estimate Activity Durations, which estimates how long each activity will take.
Develop Schedule, which produces an accepted and signed-off project schedule.
Through the use of the planning processes noted, the project management team builds a schedule that is based on the project’s timeline, scope, and resource plan to arrive at the timely completion of the project. The accepted and signed-off version of the project schedule becomes the schedule baseline.
Figure 3.9 shows the inputs, tools and techniques, and outputs of the Plan Schedule Management process.
The schedule management plan should be created early within the planning stages of a project. The plan is responsible for guiding the creation, management, and control of the project schedule.
Inputs of Plan Schedule Management
Similar to the Plan Scope Management process, you will need to know the following four inputs of the Plan Schedule Management process:
Project Management Plan To help inform what the project is intended to accomplish, the project management plan with all of its approved subsidiary plans is used to help create the schedule management plan. Specifically, the scope baseline and other information about risk, cost, and communication decisions are used to help create the schedule.
Project Charter In regard to this process, the project charter is used to define the summary milestone schedule and the requirements to obtain project approval as it relates to managing the project schedule.
Enterprise Environmental Factors Several enterprise environmental factors can influence the Plan Schedule Management process, including but not limited to the organization’s culture, its infrastructure, project management software that provides the scheduling tool and schedule alternative generation, published commercial information, and organizational work systems.
Organizational Process Assets Quite a few process assets influence the Plan Schedule Management process, including but not limited to these:
The use of monitoring and reporting tools
Schedule control tools
Historical information
Policies, procedures, and guidelines related to formal and informal schedule control
Templates
Project closure guidelines
Change control procedures
Risk control procedures
Tools and Techniques of Plan Schedule Management
The three tools and techniques that the Plan Schedule Management process uses are expert judgment, analytical techniques, and meetings:
Expert Judgment Expert judgment brings invaluable perspective about prior similar projects attempted, as well as the existing environment that will affect the project. This can also be useful in considering how to combine methods of schedule planning and how to best resolve differences between those methods.
Analytical Techniques Most management involves picking between different options, and it is no different for this process. Plan schedule management may ask you to pick between strategic options to estimate and schedule the project like the scheduling methodology, which scheduling tools and techniques to use, estimating approaches, formats, and project management software. As the project develops, the schedule management plan may require analysis to determine options that fast track or crash the project schedule. Remember, that these options may introduce risk to the project, so don’t forget to update the risk register.
Meetings In the course of developing the schedule management plan, members of project teams may attend schedule development meetings. Depending on the meeting, the following members might include the project manager, project sponsor, selected project team members, and anyone having responsibility in this area.
Outputs of Plan Schedule Management
The primary output of the Plan Schedule Management process is the schedule management plan.
The components of this plan establish the following:
Project schedule model development, which specifies the methodology and tools to be used
Level of accuracy, which sets the tolerances used to determine realistic activity duration estimates and the amount needed for contingencies
Units of measure, which could be vital depending on the industry the project is in and whether the project involves multiple countries
Organizational procedure links, as provided by the framework of the WBS
Project schedule model maintenance, or a model for updating status and progress of the project
Control thresholds, which establish the variance thresholds for monitoring schedule performance and define the amount of variation the project can sustain before some action must be performed
Rules of performance measurement, where physical measurement, rules of performance measurement, or earned value measurement rules are set
Reporting formats and frequency of reports
Process descriptions for each of the schedule management processes
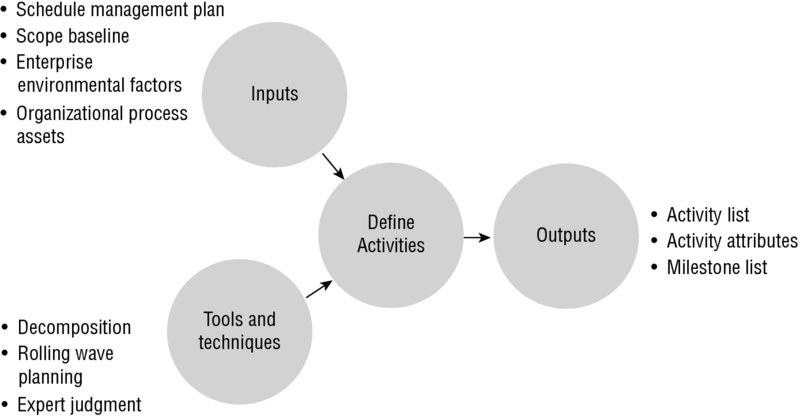
Define Activities
The purpose of the Define Activities process is to decompose the work packages into schedule activities where the basis for estimating, scheduling, executing, and monitoring and controlling the work of the project is easily supported and accomplished. This process documents the specific activities needed to fulfill the deliverables detailed in the WBS. By the end of this process, the project team will have defined a list of activities, their characteristics, and a milestones list.
Figure 3.10 shows the inputs, tools and techniques, and outputs of the Define Activities process.
You should know the following inputs of the Define Activities process:
Schedule Management Plan The critical input from this plan is the defined level of detail needed to manage the work.
Scope Baseline The scope baseline takes into account the following:
Work packages, from within the WBS
Constraints and assumptions, from within the project scope statement
Enterprise Environmental Factors Enterprise environmental factors include the project management information system; the organizational culture and structure; and published, commercially available information.
Organizational Process Assets The organizational process assets provide existing guidelines and policies, historical project documents (such as partial activity lists from previous projects), and a lessons-learned knowledge base, all of which are used for defining the project activities.
Tools and Techniques of Define Activities
You can use the following three tools and techniques in the Define Activities process:
Decomposition Decomposition in this process involves breaking the work packages into smaller, more manageable units of work called activities. Activities are individual units of work that must be completed to fulfill the deliverables listed in the WBS.
Rolling Wave Planning Rolling wave planning is a form of progressive elaboration that involves planning near-term work in more detail than future-term work. As the work progresses, the work that was once considered future-term is then broken out into more granular detail.
Expert Judgment Expert judgment helps define activities and involves project team members with prior experience developing project scope statements and WBSs.
Outputs of Define Activities
The following are outputs of the Define Activities process:
Activity List Activity lists contain all the schedule activities that will be performed for the project, with a scope-of-work description of each activity and an identifier so that team members understand what the work is and how it is to be completed.
Activity Attributes Activity attributes describe the characteristics of the activities and are an extension of the activity list. Activity attributes will change over the life of the project, as more information is known.
During the early stages of the project, activity attributes typically consist of the following:
Activity ID
WBS identification code it’s associated with
Activity name
As the project progresses, the following activity attributes may be added:
Predecessor and successor activities
Logical relationships
Leads and lags
Resource requirements
Constraints and assumptions associated with the activity
Milestone List Milestones are major accomplishments of the project and mark the completion of major deliverables or some other key event in the project. The milestone list documents several things:
Records the accomplishments
Documents whether a milestone is mandatory or optional
Becomes part of the project management plan
Helps develop the project schedule
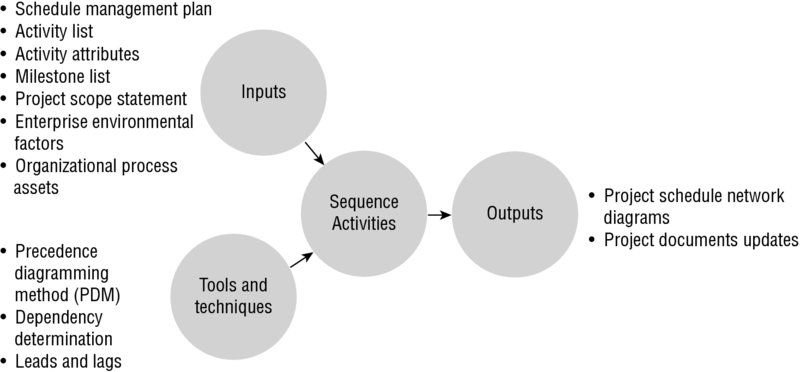
Sequence Activities
The Sequence Activities process takes the identified schedule activities from the Define Activities process, sequences them in logical order, and identifies any dependencies that exist among the activities. The interactivity of logical relationships must be sequenced correctly in order to facilitate the development of a realistic, achievable project schedule. The end of this process results in the creation of project schedule network diagrams, which visually show the sequence of activities and their dependencies.
Figure 3.11 shows the inputs, tools and techniques, and outputs of the Sequence Activities process.
Within the Sequence Activities process, you will use the following inputs:
Schedule management plan
Activity list
Activity attributes
Milestone list
Project scope statement
Enterprise environmental factors
Organizational process assets
Schedule Management Plan The schedule management plan clarifies the tools and methods to be used in scheduling, which informs how activities may be sequenced.
Activity List To sequence activities, you would first need to acquire the activity list as an input. The activity list includes the activities along with their identifiers and a description of the work’s scope.
Activity Attributes Activity attributes may reveal information on the sequencing of activities, such as through predecessor or successor relationships.
Milestone List Milestone lists may contain milestones with scheduled dates. These dates might impact the sequencing of activities.
Project Scope Statement The product scope description in the project scope statement includes product details that may be used for sequencing activities.
Enterprise Environmental Factors Sequence activities may be influenced by enterprise environmental factors such as government or industry standards, the project management information system, schedule tool, and any company work authorization systems.
Organizational Process Assets The project files found within the corporate knowledge base are used from within the organizational process assets for scheduling purposes.
Tools and Techniques of Sequence Activities
You will need to be familiar with the following tools and techniques of the Sequence Activities process:
Precedence diagramming method (PDM)
Dependency determination
Leads and lags
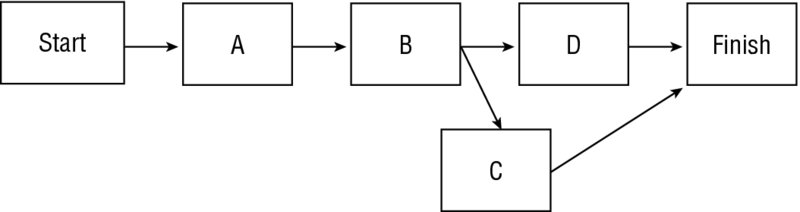
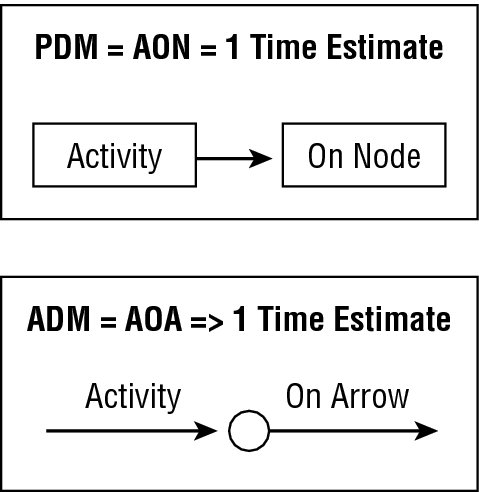
Precedence Diagramming Method The precedence diagramming method (PDM) uses boxes or rectangles to represent the activities (called nodes). The nodes are connected with arrows showing the dependencies between the activities. This method is also called activity on node (AON). PDM uses only one-time estimates to determine duration.
The following information is displayed on a node:
Activity name (required)
Activity number (optional)
Start and stop dates (optional)
Due dates (optional)
Slack time (optional)
Any additional or relevant information (optional)
The following illustration shows a general example of a PDM, or AON.
The PDM is further defined by the following four types of dependencies, also known as logical relationships:
Finish-to-Start The finish-to-start (FS) relationship is the most frequently used relationship. In this relationship, the predecessor activity must finish before the successor activity can start.
Start-to-Finish In the start-to-finish (SF) relationship, the predecessor activity must start before the successor activity can finish. This logical relationship is seldom used.
Finish-to-Finish In the finish-to-finish (FF) relationship, the predecessor activity must finish before the successor activity finishes.
Start-to-Start In the start-to-start (SS) relationship, the predecessor activity must start before the successive activity can start.
Dependency Determination Dependencies are relationships between the activities in which one activity is dependent on another to complete an action, or perhaps an activity is dependent on another to start an action before it can proceed. Dependency determination is a matter of determining where those dependencies exist.
The following are four types of dependencies, defined by characteristics:
Mandatory Dependencies Mandatory dependencies, also known as hard logic or hard dependencies, are defined by the type of work being performed. The nature of the work itself dictates the order in which the activities should be performed.
Discretionary Dependencies Discretionary dependencies are defined by the project team. Discretionary dependencies are also known as preferred logic, soft logic, or preferential logic. These are usually process- or procedure-driven or best-practice techniques based on past experience.
External Dependencies External dependencies are external to the project. The PMBOK® Guide points out that even though the dependency is external to the project (and therefore a non-project activity), it impacts project activities.
Internal Dependencies Internal dependencies are internal to the project. These dependencies involve a precedence relationship between project activities that are within the project team’s ability to control.
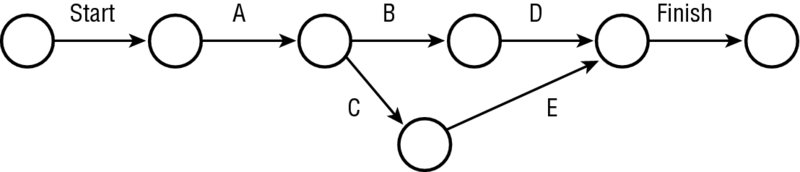
Arrow Diagramming Method The arrow diagramming method (ADM) technique isn’t used nearly as often as PDM. ADM is visually the opposite of the PDM. The arrow diagramming method places activities on the arrows, which are connected to dependent activities with nodes. This method is also called activity on arrow (AOA). Characteristics of the ADM technique are as follows:
ADM allows for more than one-time estimates to determine duration and uses only the finish-to-start dependency.
Dummy activities may be plugged into the diagram to accurately display the dependencies.
The following illustration shows a general example of the ADM method.
The following illustration is meant to help you remember the difference between PDM and ADM for the exam.
Leads and Lags Consider applying leads and lags when determining dependencies:
Leads Leads speed up the successor activities and require time to be subtracted from the start date or the finish date of the activity you’re scheduling.
Lags Lags delay successor activities (those that follow a predecessor activity) and require time added either to the start date or to the finish date of the activity being scheduled.
Outputs of Sequence Activities
There are two outputs of the Sequence Activities process that you should be familiar with:
Project Schedule Network Diagrams Like the WBS, the project schedule network diagrams might contain all the project details or contain only summary-level details, depending on the complexity of the project. Summary-level activities are a collection of related activities also known as hammocks. Hammocks are a group of related activities rolled up into a summary heading that describes the activities likely to be contained in that grouping.
Project Documents Updates The following project documents may require updates as a result of this process:
Activity lists
Activity attributes
Milestone list
Risk register (for an introduction to the risk register, see “Outputs of Identify Risks” later in this chapter)
Figure 3.12 shows the position of the Sequence Activities process in relation to the other time management processes.
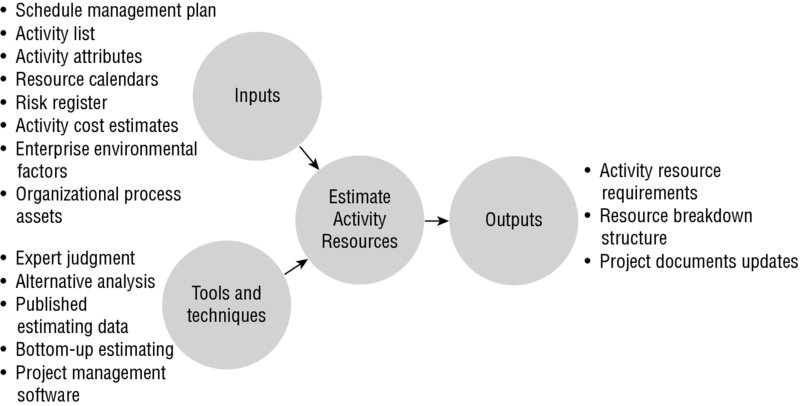
After the activities are sequenced, the next steps involve estimating the resources and estimating the durations of the activities so that they can be plugged into the project schedule. The Estimate Activity Resources process is concerned with determining the types and quantities of resources (both human and materials) needed for each schedule activity within a work package.
Figure 3.13 shows the inputs, tools and techniques, and outputs of the Estimate Activity Resources process.
You should know the following inputs for the Estimate Activity Resources process:
Schedule management plan
Activity list
Activity attributes
Resource calendars
Risk register
Activity cost estimates
Enterprise environmental factors
Organizational process assets
Schedule Management Plan To help assist in determining the resources to be estimated, the schedule management plan identifies the level of accuracy and the units of measure.
Activity List The activity list is necessary to know which activities will need resources.
Activity Attributes The activity attributes provide the details necessary to come up with an estimate of the resources needed per activity.
Resource Calendars Resource calendars describe the time frames in which resources are available and include the following:
Skills
Abilities
Quantity
Availability
Resource calendars also examine the quantity, capability, and availability of equipment and material resources that have a potential to impact the project schedule.
Risk Register The risk register helps inform how risk events can disrupt resource selection and availability.
Activity Cost Estimates The activity cost estimates are necessary to know how cost may impact resource selection.
Enterprise Environmental Factors Information on the resource availability and skills can be obtained through enterprise environmental factors.
Organizational Process Assets Information from previous similar projects, and policies and procedures relating to staffing and equipment purchase and rental, are used from within the organizational process assets.
Tools and Techniques of Estimate Activity Resources
The tools and techniques within the Estimate Activity Resources process include the following:
Expert judgment
Alternatives analysis
Published estimating data
Bottom-up estimating
Project management software
Expert Judgment Individuals with experience and knowledge of resource planning and estimating can be tapped for information and guidance used within this process.
Alternatives Analysis Alternatives analysis helps to make decisions about the possible resource types (such as expert or novice) and methods that are available to accomplish the activities. Make-or-buy analysis can also be used for decisions regarding resources.
Published Estimating Data Estimating data might include organizational guidelines, industry rates or estimates, production rates, and so on.
Bottom-Up Estimating Bottom-up estimating is used when an activity cannot be confidently estimated. With the help of experts, the activity is broken down into smaller components of work for estimating purposes and then rolled back up to the original activity level. This is an accurate means of estimating, but it can be time-consuming and costly.
Project Management Software Within this process, project management software can help in the following ways:
Plan, organize, and estimate resource needs
Document resource availability
Create resource breakdown structures
Create resource rates
Create resource calendars
Outputs of Estimate Activity Resources
Three outputs result from carrying out the Estimate Activity Resources process:
Activity Resource Requirements Activity resource requirements describe the types of resources and the quantity needed for each activity associated with a work package. The description should include the following:
How estimates were determined
Information used to form the estimate
Assumptions made about the resources and their availability
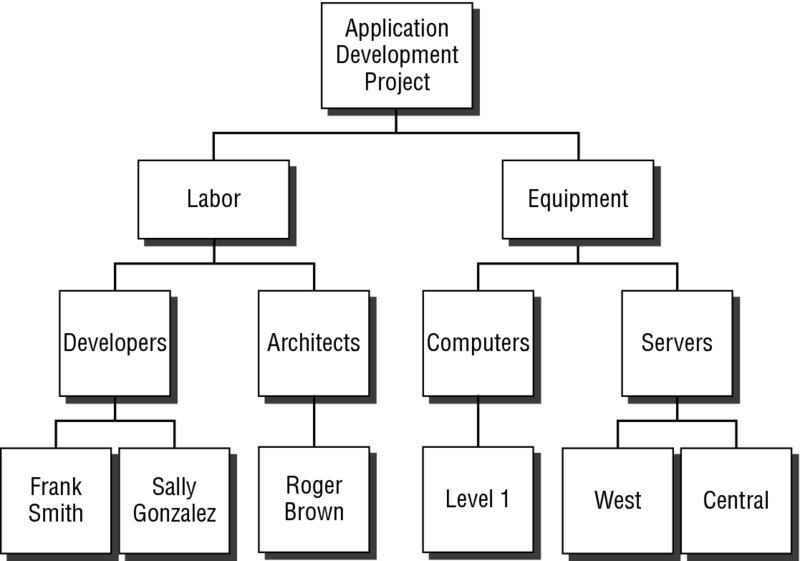
Resource Breakdown Structure The resource breakdown structure (RBS) is a hierarchical structure that lists resources by category and type. Figure 3.14 illustrates a basic example of what an RBS may look like.
Project Documents Updates Project document updates include updates to the following items:
Activity list
Activity attributes
Resource calendars
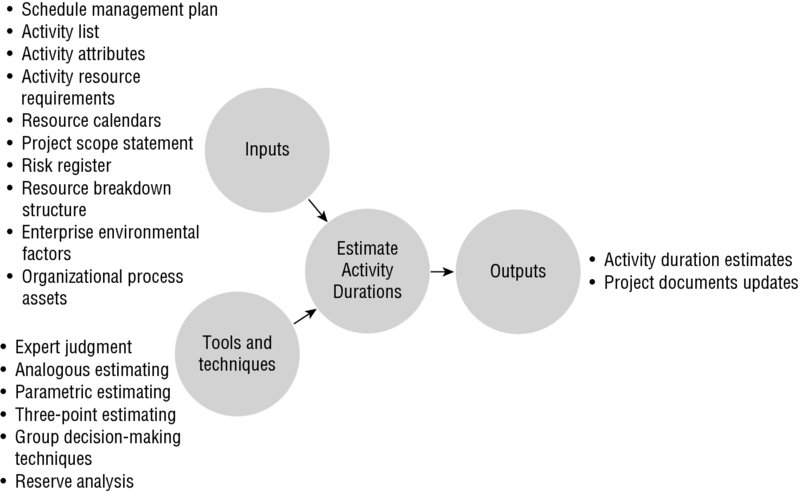
Estimate Activity Durations
The Estimate Activity Durations process attempts to estimate the work effort, resources, and number of work periods needed to complete each activity. These are quantifiable estimates expressed as the number of work periods needed to complete a schedule activity. Estimates are progressively elaborated, typically starting at a fairly high level, and as more and more details are known about the deliverables and their associated activities, the estimates become more accurate.
Figure 3.15 shows the inputs, tools and techniques, and outputs of the Estimate Activity Durations process.
You should be familiar with several inputs of the Estimate Activity Durations process:
Schedule management plan
Activity list
Activity attributes
Activity resource requirements
Resource calendars
Project scope statement
Risk register
Resource breakdown structure
Enterprise environmental factors
Organizational process assets
Schedule Management Plan The schedule management plan sets the approach used and the level of accuracy required to estimate activity durations including the project update cycle.
Activity List The list of activities is necessary to estimate the activity durations.
Activity Attributes Information included within the activity attributes will influence the activity duration estimates.
Activity Resource Requirements The availability of the assigned resources will impact the duration of the activities.
Resource Calendars Information from the resource calendars that influences this process is as follows:
Type, availability, and capability of human resources
Type, availability, capability, and quantity of equipment and material resources
Project Scope Statement Constraints and assumptions are considered when estimating activity durations.
Risk Register The list of risks is necessary, along with the results of risk analysis and risk response planning.
Resource Breakdown Structure The resource breakdown structure provides a hierarchical view of the identified resources. This then provides key information that will help estimate activity durations.
Enterprise Environmental Factors Enterprise environmental factors used include the following items:
Internal reference data for estimating durations
External reference data available commercially
Defined productivity metrics
Organizational Process Assets The following organizational process assets are used:
Historical information from previous similar projects, including duration information, project calendars, and lessons learned
Scheduling methodology
Tools and Techniques of Estimate Activity Durations
The six tools and techniques of the Estimate Activity Durations process are as follows:
Expert judgment
Analogous estimating
Parametric estimating
Three-point estimating
Group decision-making techniques
Reserve analysis
Expert Judgment Expert judgment used includes staff members who will perform the activities and is based on their experience with past similar activities. When estimating durations, experts should consider the following:
Resource levels
Resource productivity
Resource capability
Risks
Any other factors that can impact estimates
Analogous Estimating Analogous estimating is commonly used when little detail is available on the project. For a complete description of analogous estimating, see “Tools and Techniques of Estimate Costs” later in this chapter.
Parametric Estimating Parametric estimating is a quantitatively based estimating method that multiplies the quantity of work by the rate. It is considered to be a quick and low-cost estimating technique, with a good level of accuracy when used with actual historical data and current market conditions that take inflation or other factors into consideration. The best way to describe it is with an example:
Activity: install fifteen 10×10 drapes.
Average time to install one 10×10 drape, based on previous experience: 30 minutes.
Estimate: Therefore, installing 15 drapes at an average 30-minute installation time per drape results in an estimated duration of 7.5 hours.
Three-Point Estimating Three-point estimating uses the average of the following three estimates to result in a final estimate:
Most Likely (ML) The estimate assumes there are no disasters and the activity can be completed as planned.
Optimistic (O) This represents the fastest time frame in which your resource can complete the activity.
Pessimistic (P) The estimate assumes the worst happens and it takes much longer than planned to get the activity completed.
The concept of the three-point estimate comes from the Program Evaluation and Review Technique (PERT), which uses the following formula to determine the weighted average using the three duration estimates:
In the following example, the Most Likely (ML) estimate = 15, the Optimistic (O) estimate = 11, and the Pessimistic (P) estimate = 25.
Thus, the activity duration = 16.
Group Decision-Making Techniques It is helpful to have multiple alternatives for future actions when estimating activity durations, and the group decision-making technique is an assessment process that delivers those alternatives. By engaging team members, it helps to improve estimate accuracy and commitment to the emerging estimates, which has the byproduct of helping win the hearts and minds of those contributing to the project.
Reserve Analysis Reserve time—also called buffer/time reserves or contingency reserve in the PMBOK® Guide—is the portion of time added to the activity to account for schedule risk or uncertainty. To make sure the project schedule is not impacted, a reserve time of the original estimate is built in to account for the problems that may be encountered.
Original activity duration to install fifteen 10×10 drapes: 7.5 hours.
10 percent reserve time added: 45 minutes.
Estimate: Therefore, the new activity duration is adjusted to include the reserve, resulting in an estimated duration of 8.25 hours.
Outputs of Estimate Activity Durations
There are two outputs of the Estimate Activity Durations process you should know:
Activity duration estimates
Project documents updates
Activity Duration Estimates Activity duration estimates are estimates of the required work periods needed to complete the activity. This is a quantitative measure usually expressed in hours, weeks, days, or months.
Final estimates should contain a range of possible results, such as X hours ± 10 hours, or a percentage may be used to express the range.
Original activity duration to install fifteen 10×10 drapes: 7.5 hours.
Final estimate: 7.5 hours ± 1 hour. Therefore, the activity may take as little as 6.5 hours or as much as 8.5 hours.
Project Documents Updates The following information may need to be revisited and updated as a result of this process:
Activity attributes
Assumptions made regarding resource availability and skill levels
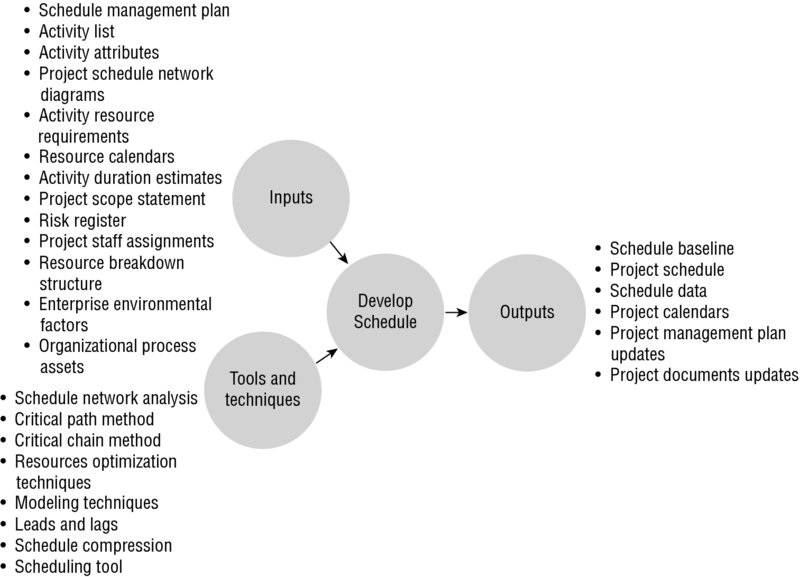
Develop Schedule
The purpose of the Develop Schedule process is to create the project schedule. Here, start and finish dates are created, activity sequences and durations are finalized, and the critical path is determined. The Develop Schedule process cannot be completed until the following processes of project planning have occurred:
Collect Requirements
Define Scope
Create WBS
Define Activities
Sequence Activities
Estimate Activity Resources
Estimate Activity Durations
Plan Human Resource Management
Figure 3.16 shows the inputs, tools and techniques, and outputs of the Develop Schedule process.
The Develop Schedule process has 13 inputs you should be familiar with:
Schedule management plan
Activity list
Activity attributes
Project schedule network diagrams
Activity resource requirements
Resource calendars
Activity duration estimates
Project scope statement
Risk register
Project staff assignments
Resource breakdown structure
Enterprise environmental factors
Organizational process assets
Schedule Management Plan The scheduling method and tool used to create the schedule, and how the schedule is formulated, is identified through the schedule management plan.
Activity List Developing the project schedule requires the project activities, which are obtained from the activity list developed in the Define Activities process.
Activity Attributes Activity attributes provide the necessary details of the project activities, which will be utilized in creating the project schedule.
Project Schedule Network Diagrams The sequence of events will be important in creating the project schedule. The activity sequence and existing dependencies can be obtained from the project schedule network diagrams. For a more complete description of the project schedule network diagrams, see “Outputs of Sequence Activities” earlier in this chapter.
Activity Resource Requirements Activity resource requirements will provide the types and quantity of resources needed for creating the project schedule.
Resource Calendars Resource calendars display availability of project team members and other resources, which will help to avoid schedule conflicts.
Activity Duration Estimates Activity duration estimates will provide the time to complete each activity that is needed to assign start and finish dates.
Project Scope Statement Constraints and assumptions are used from within the project scope statement. The following time constraints are important to this process:
Imposed dates to restrict the start or finish date of activities
Key events/major milestones to ensure the completion of specific deliverables by a specific date
Risk Register Developing the project schedule requires the details of all identified risks and their characteristics that will affect the schedule model.
Project Staff Assignments Developing the project schedule requires the project staff assignments, which specify resource assignments for each activity.
Resource Breakdown Structure Developing the project schedule requires resource analysis and the need to determine organizational reporting, which is provided by the resource breakdown structure.
Enterprise Environmental Factors Existing holidays and other external information that could impact the project schedule may be used from within the enterprise environmental factors.
Organizational Process Assets Within the organizational process assets, project calendars may exist that provide information on working days and shifts that can be used in this process.
Tools and Techniques of Develop Schedule
The Develop Schedule process has several tools and techniques you can use:
Schedule network analysis
Critical path method
Critical chain method
Resource optimization techniques
Modeling techniques
Leads and lags
Schedule compression
Scheduling tool
Schedule Network Analysis Schedule network analysis involves calculating early and late start dates and early and late finish dates for project activities to generate the project schedule. In short, it generates the schedule through the use of the following analytical techniques and methods:
Critical path method
Critical chain method
Modeling techniques
Resource optimization techniques
Critical Path Method Critical path method (CPM), a schedule network analysis technique, determines the amount of float, or schedule flexibility, for each of the network paths by calculating the earliest start date, earliest finish date, latest start date, and latest finish date for each activity. This technique relies on sequential networks and a single duration estimate for each activity. PDM can be used to perform CPM. Here is some information related to CPM that you should know:
Critical Path The critical path (CP) is generally the longest full path on the project. Any project activity with a float time that equals zero is considered a critical path task. The critical path can change under the following conditions:
When activities become tasks on the critical path as a result of having used up all their float time
When a milestone on the critical path is not met
Float There are two types of float time, also called slack time:
Total float (TF), or the amount of time you can delay the earliest start of a task without delaying the ending of the project
Free float (FF), or the amount of time you can delay the start of a task without delaying the earliest start of a successor task
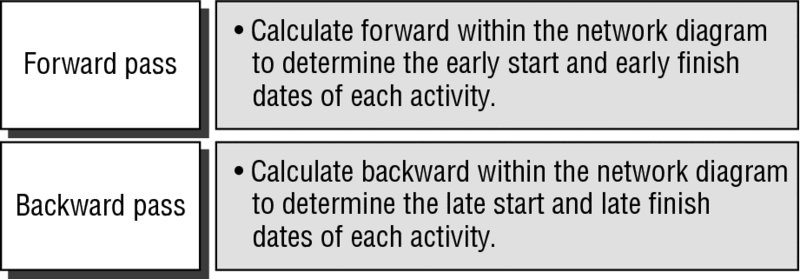
Calculating the Forward and Backward Pass A forward pass is used to calculate the early start and early finish date of each activity on a network diagram. To calculate a forward pass, follow these steps:
Begin with the first activity.
The calculation of the first activity begins with an early start date of zero. Add the duration of the activity to determine the early finish.
The early start date of the next activity is the early finish date of the previous activity. Continue calculating the early start and early finish dates forward through all the network paths while following the existing dependencies.
When an activity has two connecting predecessors, the early start date would be the early finish of the predecessor that finishes last. (For example, suppose activity A has an early finish of 4 and activity B has an early finish of 5. If activities A and B both converge at activity C, then activity C would have an early start date of 5.)
A backward pass is used to calculate the late start and late finish date of each activity on a network diagram. To calculate a backward pass, follow these steps:
Begin with the last activity. The late finish will be the same as the early finish date.
Subtract the duration of the activity from the end date to calculate late start. This becomes the late finish of its predecessors.
Continue calculating the latest start and latest finish dates moving backward through all of the network paths.
When an activity has two connecting predecessors, the late finish date would be the late start of the activity that follows. (For example, if activity C has a late start of 7 and both activity A and activity B connect to activity C, the late finish of both activity A and B would be 7.)
Figure 3.17 summarizes a forward and backward pass.
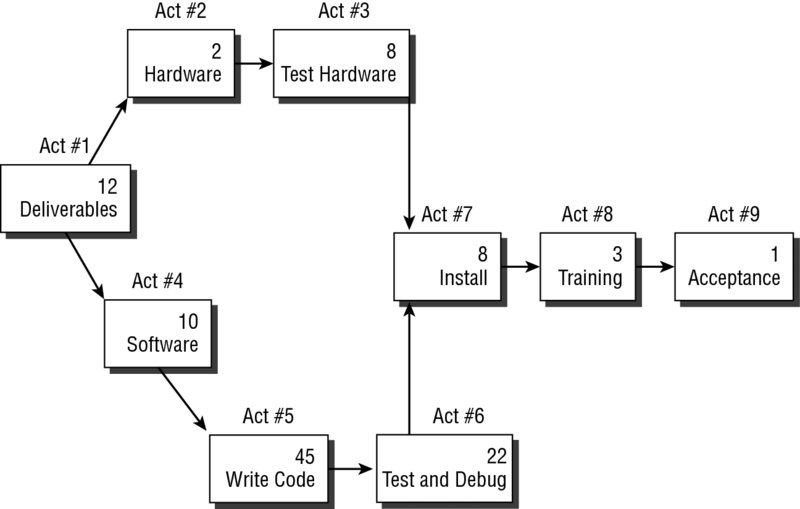
Calculating the Critical Path A critical path task is any task that cannot be changed without impacting the project end date. By definition, these are all tasks with zero float. To determine the CP duration of the project, add the duration of every activity with zero float.
Another way to determine the critical path is by determining the longest path within the network diagram. This can be done by adding the duration of all the activities within each path of the network.
Using Table 3.2, set up a network diagram using the activity number, activity description, dependency, and duration. Next, practice calculating the early start, early finish, late start, and late finish dates. Check your answers against the dates shown on the chart and by referencing Figure 3.18.
Calculating Expected Value Using PERT PERT and CPM are similar techniques: CPM uses the most likely duration to determine project duration, whereas PERT uses what’s called expected value (or the weighted average). Expected value is calculated using the three-point estimates for activity duration.
Calculating Standard Deviation The formula for standard deviation is as follows:
For data that fits a bell curve, the following is true:
Work will finish within ± 3 standard deviations 99.73 percent of the time.
Work will finish within ± 2 standard deviations 95.44 percent of the time.
Work will finish within ± 1 standard deviation 68.27 percent of the time.
Critical Chain Method The critical chain method is a schedule network analysis technique that will modify the project schedule by accounting for limited or restricted resources. The modified schedule is calculated, and it often changes the critical path as a result of adding duration buffers, which are nonworking activities added to help manage the planned activity durations. The new critical path showing the resource restrictions is called the critical chain.
Critical chain uses both deterministic (step-by-step) and probabilistic approaches. The following are steps in the critical chain process:
Construct the schedule network diagram using activity duration estimates (you’ll use nonconservative estimates in this method).
Define dependencies.
Define constraints.
Calculate the critical path.
Enter resource availability into the schedule.
Recalculate for the critical chain.
A project buffer is placed at the end of the critical chain to help keep the finish date from slipping. After the buffers are added, the planned activities are then scheduled at their latest start and finish dates.
Resource Optimization Techniques Resource optimization techniques are used when the supply and demand of resources necessitate an adjustment to the schedule model. They attempt to smooth out the peaks and valleys of total resource usage through strategic consumption of float while also addressing any overcommitment of individual resources through rescheduling or reassignment. Examples include but are not limited to the following:
Resource Leveling Resource leveling attempts to smooth out the resource assignments to get tasks completed without overloading the resources and while trying to keep the project on schedule. This typically takes the form of allocating resources to critical path tasks first.
Here are some examples of resource leveling:
Delaying the start of a task to match the availability of a key team member
Adjusting the resource assignments so that more tasks are given to team members who are underallocated
Requiring the resources to work mandatory overtime
Resource Smoothing Resource smoothing is a technique that adjusts the schedule model by arranging the activities so that the requirements for resources do exceed the constraints of the project. The key difference between resource smoothing and resource leveling is that, with resource smoothing, the critical path of the project remains unchanged. The ability to delay an activity is limited by the amount of an activity’s free and total float.
Modeling Techniques There are multiple types of modeling techniques that a project manager can use in developing the schedule. Two examples that you should be familiar with for the exam include what-if scenario analysis and simulation.
What-If Scenario Analysis What-if scenario analysis evaluates different scenarios in order to predict their positive or negative effect on project objectives. According to the PMBOK® Guide, this is an analysis of the question “What if the situation represented by scenario ‘X’ happens?” To support this effort, a schedule network analysis is performed using the schedule to calculate different scenarios, like the delay of a deliverable or a major weather event for a construction project.
Simulation Taking different sets of activity assumptions, simulation calculates multiple project duration models using probability distributions constructed from three-point estimates to account for uncertainty. Simulation techniques such as Monte Carlo analysis use a range of probable activity durations for each activity, and those ranges are then used to calculate a range of probable duration results for the project itself. Monte Carlo runs the possible activity durations and schedule projections many, many times to come up with the schedule projections and their probability, critical path duration estimates, and float time.
Leads and Lags A lead accelerates the start date of an activity by the number of days specified, whereas a lag delays the start date of an activity. Leads and lags were first used in the Sequence Activities process, discussed earlier in this chapter.
Schedule Compression Schedule compression is a form of mathematical analysis that’s used to shorten the project schedule without changing the project scope. To be effective, work compressed must be based on those activities that fall on the critical path. There are two types of schedule compression techniques:
Crashing Crashing is a compression technique that looks at cost and schedule trade-offs. This involves adding resources to critical path tasks in order to shorten the length of the tasks and therefore the length of the project. Crashing the schedule can lead to increased risk, increased costs, and a change in the critical path.
Fast Tracking Fast tracking is performing two tasks in parallel that were previously scheduled to start sequentially. Fast tracking can increase project risk and cause the project team to have to rework tasks, and it only works for activities that can be overlapped.
Scheduling Tool The scheduling tools used are typically in the form of project management software programs. They will automate the mathematical calculations and perform resource-leveling functions.
Outputs of Develop Schedule
Know the following outputs of the Develop Schedule process:
Schedule baseline
Project schedule
Schedule data
Project calendars
Project management plan updates
Project documents updates
Schedule Baseline The schedule baseline can be described as the final, approved version of the project schedule with baseline start and baseline finish dates and resource assignments. The PMBOK®Guide notes that the schedule baseline is a designated version of the project schedule that’s derived from the schedule network analysis. The approved project schedule becomes a part of the project management plan.
Project Schedule The project schedule details the start and finish dates for each project activity as well as the resource assignments. In PMBOK® Guide terms, the project schedule is considered preliminary until resources are assigned. The following are additional elements of the project schedule:
The project schedule should be approved and signed off by stakeholders and functional managers.
For functional organizations, confirmation that resources will be available as outlined in the schedule should be obtained.
The schedule cannot be finalized until approval and commitment for the resource assignments outlined in it are received.
Once approved, the schedule becomes the schedule baseline for the remainder of the project.
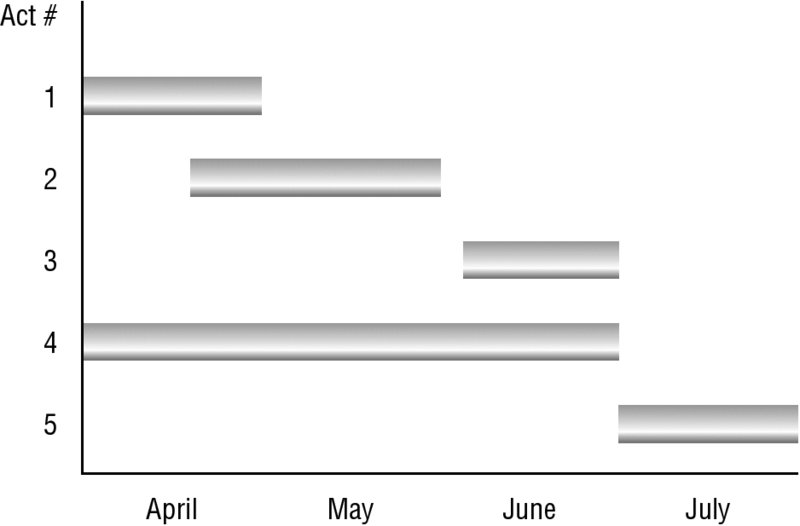
The following are various ways of displaying the project schedule:
Bar Charts Also known as Gantt charts, these tools are commonly used to display schedule activities. They may show activity sequences, activity start and end dates, resource assignments, activity dependencies, and the critical path. Figure 3.19 shows a simple example that plots various activities against time.
Project Schedule Network Diagrams Project schedule network diagrams usually show the activity dependencies and critical path. They will work as schedule diagrams when the start and finish dates are added to each activity.
Milestone Charts Milestone charts mark the completion of major deliverables or some other key events in the project. They can be displayed in a bar chart form, similar to a Gantt chart, or use a simple table format, as shown in Table 3.3. As the milestones are met, the Actual Date column within the table is filled in.
Schedule Data The schedule data refers to documenting the supporting data for the schedule. At least the following elements must be included within the schedule data:
Milestones
Schedule activities
Activity attributes
Assumptions
Constraints
Any other information that doesn’t fit into the other categories
Resource requirements by time period, often in the form of resource histograms (suggested by the PMBOK® Guide)
Project Calendars A project calendar is a template of sorts that clarifies the working days and shifts that are available for scheduling activities.
Project Management Plan Updates Updates may be made to the schedule baseline and the schedule management plan.
Project Documents Updates Updates may be made to the following project documents:
Activity resource requirements document
Activity attributes
Calendars
Risk register
Developing a Cost Management Plan
The purpose of the cost management plan is, naturally, to create, monitor, and control the project costs. This plan is based on the project scope and documents the estimating techniques that will be used as well as how the cost-related processes will be carried out.
The project budget is created by carrying out three planning processes:
Plan Cost Management, which is primarily focused on the costs of resources to complete the project
Estimate Costs, which estimates how much each activity will cost
Determine Budget, which aggregates the total cost estimates plus contingency reserves to create the project budget
The project budget is referred to as the cost baseline, which, along with the cost management plan, becomes a part of the project management plan.
Figure 3.20 shows the inputs, tools and techniques, and outputs of the Plan Cost Management process.
The cost management plan plays an important role within all of the Project Cost Management Knowledge Area processes. The cost management plan is created during the Plan Cost Management process and is a subsidiary plan of the project management plan (as all subplans are). Using the preceding components, the cost management plan will guide the project management team in carrying out the three cost-related processes.
Plan Cost Management
The cost management plan contains the following information:
Level of accuracy
Units of measure
Organizational procedures links
Control thresholds
Rules of performance measurement
Reporting formats
Process descriptions
Keep in mind that throughout the Project Cost Management Knowledge Area, the cost management plan serves as a guide for documenting and controlling the budget of the project.
Inputs of Plan Cost Management
Know the following four inputs of the Plan Cost Management process:
Project Management Plan The project management plan contains elements used to create the cost management plan focusing on, but not limited to, the following:
Scope baseline; elements like the project scope statement and WBS provide details for cost estimation and management
Schedule baseline, which helps clarify when project costs will be incurred
Other information, including cost-related scheduling, communication decisions, and risk
Project Charter The project charter has the summary budget, a key input to creating the detailed project costs.
Enterprise Environmental Factors Several enterprise environmental factors can influence the Plan Cost Management process, including but not limited to the organization’s culture and structure, marketplace conditions, currency exchange rates (if the project is multinational), published commercial information such as resource cost rate information, and the project management information system.
Organizational Process Assets Financial controls procedures; historical information, including a lessons learned knowledge base; financial databases; and existing formal and informal cost estimating and budgeting-related policies, procedures, and guidelines are a few of the organizational process assets that help shape the Plan Cost Management process.
Tools and Techniques of Plan Cost Management
The three tools and techniques that the Plan Cost Management process uses are expert judgement, analytical techniques, and meetings:
Expert Judgment Expert judgment brings invaluable perspective about prior similar projects attempted, as well as the existing environment that will affect the project. This can also be key in considering whether to combine methods of cost planning and how to best resolve differences between those methods.
Analytical Techniques You may have many strategic options to consider when developing the cost management plan. Those options include self-funding, funding with equity, or funding with debt. Financial options will be influenced by the organization’s policies and procedures, including but limited to payback period, return on investment, internal rate of return, discounted cash flow, and net present value.
Meetings In the course of developing the cost management plan, members of project teams may attend meetings to help with information exchange and decision making. Depending on the meeting, the following members might be a part of the discussion to include: the project manager, the project sponsor, selected project team members, and anyone having responsibility in this area.
Outputs of Plan Cost Management
For the exam, know that the output of the Plan Cost Management process is the cost management plan.
Cost Management Plan The cost management plan should establish the following:
Units of measure, such as quantity and time measures, and currency to be used
Level of precision, which is the degree to which activity cost estimates will be rounded up or down
Level of accuracy, which is the acceptable range used in determining contingencies and realistic activity cost estimates
Organizational procedures links, where the WBS provides the framework for the cost management plan to help foster consistency with estimates, budgets, and controls
Control thresholds, which document the identified variation that can occur before some action needs to be taken
Rules of performance measurement, like the rules for earned value management (EVM), and which techniques to use
Reporting formats defining the form and frequency of various cost reports
Process descriptions for the other cost management processes
Additional details such as explanations of strategic funding choices, how to deal with currency exchange rate fluctuations, and the procedure for project cost recording
Estimate Costs
The purpose of the Estimate Costs process is to develop cost estimates for resources, both human and material, required for all schedule activities and the overall project. This includes weighing alternative options and examining risks and trade-offs. The cost-related processes are governed by the cost management plan, which establishes the format and conditions used to plan for project costs. It also outlines how you will estimate, budget, and control project costs.
Figure 3.21 shows the inputs, tools and techniques, and outputs of the Estimate Costs process.
You should be familiar with these seven inputs of the Estimate Costs process:
Cost management plan
Human resource management plan
Scope baseline
Project schedule
Risk register
Enterprise environmental factors
Organizational process assets
Cost Management Plan The cost management plan is a key input that specifies how project costs will be managed and controlled, including the method to be used and level of accuracy targets required to estimate cost activity.
Human Resource Management Plan For the purposes of the Estimate Costs process, the following elements of the human resource management plan should be considered:
Personnel rates
Project staffing attributes
Employee recognition or rewards programs
Scope Baseline The following are included within the scope baseline and are used in creating cost estimates:
Project scope statement (key deliverables, constraints, and assumptions)
WBS, which serves as the basis for estimating costs (project deliverables, control accounts)
WBS dictionary
Project Schedule Activity resource requirements and activity duration estimates are used from within the project schedule and serve as key inputs when estimating costs.
Risk Register From within the risk register, the cost of mitigating, avoiding, or transferring risks will be used for estimating costs, particularly when the risks have negative impacts to the project.
Enterprise Environmental Factors According to the PMBOK® Guide, the following enterprise environmental factors should be considered in this process:
Market conditions, which help you to understand the materials, goods, and services available in the market and what terms and conditions exist to procure those resources.
Published commercial information, which refers to resource cost rates. These are obtained from commercial databases or published seller price lists.
Organizational Process Assets The organizational process assets include historical information and lessons learned on previous projects of similar scope and complexity. Also useful are cost-estimating worksheets from past projects as templates for the current project.
Tools and Techniques of Estimate Costs
The following list includes the tools and techniques of the Estimate Costs process:
Expert judgment
Analogous estimating
Parametric estimating
Bottom-up estimating
Three-point estimating
Reserve analysis
Cost of quality
Project management software
Vendor bid analysis
Group decision-making techniques
Expert Judgment Cost estimates from individuals who have had previous experience in the past on similar projects can be used. Information from those who have experience in performing the activities becomes valuable for calculating accurate estimates.
Analogous Estimating Analogous estimating, also called top-down estimating, is a form of expert judgment. This technique uses actual costs of a similar activity completed on a previous project to determine the cost estimate of the current activity. It can be used when the previous activities being compared are similar to the activities being estimated. Analogous estimating may also be useful when detailed information about the project is not yet available. Top-down estimating techniques are also used to estimate total project cost to look at the estimate as a whole. Although analogous estimating is considered to be a quick and low-cost estimating technique, it is low in accuracy.
Parametric Estimating Parametric estimating uses historical information and statistical data to calculate cost estimates. For a complete description of parametric estimating, see “Tools and Techniques of Estimate Activity Durations” later in this chapter.
Bottom-Up Estimating This technique estimates costs associated with every activity individually by decomposing that activity into smaller pieces of work until the cost of the work can be confidently estimated. The costs of the activity are then rolled up to the original activity level.
Three-Point Estimating Three-point estimates are used in this process when the project team is attempting to improve estimates and account for risk by estimating uncertainty.
Reserve Analysis During this process, cost reserves (or contingencies) and management reserves are added. Cost contingencies can be aggregated and assigned to a schedule activity or a WBS work package level. Contingency reserve is added to account for existing known risk, whereas management reserves are added to account for unknown risk.
Cost of Quality The cost of quality (COQ) is the total cost to produce the product or service of the project according to the quality standards. You can find additional information on cost of quality in “Tools and Techniques of Plan Quality” later in this chapter.
Project Management Software The project management software tool can help quickly determine estimates given different variables and alternatives.
Vendor Bid Analysis Vendor bid analysis involves gathering information from vendors to help establish cost estimates. This can be accomplished by requesting bids or quotes or working with some of the trusted vendor sources for estimates.
Group Decision-Making Techniques In this assessment process, an evaluation of multiple alternatives is performed to determine the results future actions might bring. Group decision-making techniques are valuable in improving estimate accuracy and commitment to the determined estimates.
Outputs of Estimate Costs
The following are three outputs that result from the Estimate Costs process:
Activity cost estimates
Basis of estimates
Project documents updates
Activity Cost Estimates Activity cost estimates are quantitative amounts that reflect the cost of the resources needed to complete the project activities. The following resources are commonly needed:
Human resources
Material
Equipment
Information technology needs
Any contingency reserve amounts and inflation factors
Basis of Estimates Basis of estimates is the supporting detail for the activity cost estimates and includes any information that describes how the estimates were developed, what assumptions were made during the Estimate Costs process, and any other details needed. According to the PMBOK® Guide, the basis of estimates should include the following as a minimum:
Description of how the estimate was developed or the basis for the estimate
Description of the assumptions made about the estimates or the method used to determine them
Description of the constraints
Range of possible results
Confidence level regarding the final estimates
Project Documents Updates Updates to project documents, as a result of determining cost estimates, commonly include the following to account for cost variances and refined estimates:
Project budget
Risk register
Determine Budget
The Determine Budget process is primarily concerned with determining the cost baseline, which represents the project budget. This process aggregates the cost estimates of activities and establishes a cost baseline for the project that is used to measure performance of the project throughout the remaining process groups. By the end of this process, the project schedule and the project budget will both have been created.
Figure 3.22 shows the inputs, tools and techniques, and outputs of the Determine Budget process.
The Determine Budget process contains nine inputs:
Cost management plan
Scope baseline
Activity cost estimates
Basis of estimates
Project schedule
Resource calendars
Risk register
Agreements
Organizational process assets
Cost Management Plan As we have seen earlier in the chapter, the cost management plan lays out how project costs will be managed and controlled.
Scope Baseline When determining the budget, the following is used within the scope baseline:
Project scope statement (describes the constraints of the project)
WBS (shows how the project deliverables are related to their components and typically provides control account information)
WBS dictionary
Activity Cost Estimates Activity cost estimates are determined for each activity within a work package and then summed to determine the total estimate for a work package.
Basis of Estimates Basis of estimates contains all the supporting detail regarding the estimates. Assumptions regarding indirect costs and whether they will be included in the project budget should be considered. Indirect costs cannot be directly linked to any one project but are allocated among several projects.
Project Schedule The schedule contains information that is helpful in developing the budget, such as start and end dates for activities, milestones, and so on. Based on the information in the schedule, budget expenditures for calendar periods can be determined.
Resource Calendars Resource calendars help determine costs in calendar periods and over the length of the project because they describe what resources are needed and available for the project.
Risk Register When determining the budget, a review of the risk register will help to compile the costs for risk response.
Agreements Agreements, such as contracts, include cost information that should be included in the overall project budget.
Organizational Process Assets The organizational process assets used include the following items:
Cost budgeting tools
Policies and procedures of the organization regarding budgeting exercises
Reporting methods
Tools and Techniques of Determine Budget
Know the following tools and techniques of the Determine Budget process for the exam:
Cost aggregation
Reserve analysis
Expert judgment
Historical relationships
Funding limit reconciliation
Cost Aggregation Cost aggregation is the process of tallying the schedule activity cost estimates at the work package level and then totaling the work package levels to higher-level WBS component levels. All costs can then be aggregated to obtain a total project cost.
Reserve Analysis In this process, reserve analysis outlines contingency reserves for unplanned project scope and unplanned project costs. Contingency reserves are included as part of the cost baseline, whereas management reserves are not.
Expert Judgment Expert judgment in calculating the project budget will include information from those with past experience in conducting similar projects.
Historical Relationships Analogous estimates and parametric estimates can be used to help determine total project costs. Actual costs from previous projects of similar size, scope, and complexity are used to estimate the costs for the current project. This is helpful when detailed information about the project is not available or it’s early in the project phases and not much information is known.
Funding Limit Reconciliation Funding limit reconciliation involves reconciling the amount of funds to be spent with the amount of funds budgeted for the project. The organization or the customer sets these limits. Reconciling the project expenses will require adjusting the schedule so that the expenses can be smoothed. This can be done by placing imposed date constraints on work packages or other WBS components in the project schedule.
Outputs of Determine Budget
There are three outputs of the Determine Budget process:
Cost Baseline The cost baseline provides the basis for measurement, over time, of the expected cash flows (or funding disbursements) against the requirements. Adding the costs of the WBS elements by time periods develops the cost baseline. This is also known as the project’s time-phased budget. Most projects span some length of time, and most organizations time the funding with the project.
Cost baselines can be displayed graphically, as shown in Figure 3.23.
The cost baseline should contain the costs for all of the expected work on the project, as well as the contingency reserves set aside to account for known risks. Large projects may have more than one cost performance baseline.
Project Funding Requirements Project funding requirements describe the need for funding over the course of the project and are derived from the cost performance baseline. Funding requirements can be expressed in monthly, quarterly, or annual increments or other increments that are appropriate for your project.
Figure 3.24 shows the cost baseline, the funding requirements, and the expected cash flows plotted on the S curve. This example shows a negative amount of management reserve. The difference between the funding requirements and the cost performance baseline at the end of a project is the management reserve. Management reserves are set aside to deal with unknown risks.
FIGURE 3.24 Cost baseline, funding requirements, and cash flow
Project Documents Updates The following project documents require updates as a result of carrying out this process:
Cost management plan
Any other project documents that include cost estimates
Developing a Quality Management Plan
Preventing the occurrence of defects and reducing the cost of quality can be critical to a project’s success. To this end, a quality management plan is created out of the Plan Quality Management process and is responsible for guiding the project management team in carrying out the three quality-related processes. This plan should be based on the project scope and requirements.
In addition to creating the quality management plan, the Plan Quality Management process is responsible for creating the process improvement plan. This plan measures the effectiveness of and improves the project management processes. Continuous improvement is a recurring theme throughout the PMBOK®Guide and is an important element of modern quality theories. The ideas, concepts, and theories from key quality theorists (such as Deming, Juran, and Crosby) played an important role in shaping the Project Quality Management Knowledge Area processes.
The Plan Quality Management process is concerned with targeting quality standards that are relevant to the project at hand and devising a plan to meet and satisfy those standards. The quality management plan is the result of the Plan Quality Management process, which describes how the quality policy will be implemented by the project management team. The result of this process also produces the process improvement plan, which documents the actions for analyzing processes to ultimately increase customer value.
Figure 3.25 shows the inputs, tools and techniques, and outputs of the Plan Quality Management process.
The Plan Quality Management process contains the following inputs:
Project management plan
Stakeholder register
Risk register
Requirements documentation
Enterprise environmental factors
Organizational process assets
Project Management Plan The following are used from within the project management plan:
Scope baseline, including the project scope statement, which defines the project deliverables, objectives, and threshold and acceptance criteria, all of which are used within the quality processes; the WBS; and the WBS dictionary
Schedule baseline
Cost baseline
Other management plans that might influence the overall project quality
Stakeholder Register A list of stakeholders is used in this process to understand the expectations of all stakeholders. Quality has been achieved when the expectations of all stakeholders have been met.
Risk Register The risk register outlines the documented information pertaining to risk, including the list of risks. Dealing with risk is tied into quality and should therefore be considered in the Plan Quality Management process.
Requirements Documentation To help ensure that stakeholder expectations are met, requirements documentation becomes a key instrument to help plan how quality control will function on the project.
Enterprise Environmental Factors The project manager should consider any standards, regulations, guidelines, quality policies, or rules that exist concerning the work of the project when writing the quality plan.
Organizational Process Assets The quality policy is included from within the organizational process assets and used in this process. The quality policy is a guideline published by executive management that describes what quality policies should be adopted for projects the company undertakes.
Tools and Techniques of Plan Quality Management
Know the following tools and techniques of the Plan Quality Management process:
Cost-benefit analysis
Cost of quality
Seven basic quality tools
Benchmarking
Design of experiments
Statistical sampling
Additional quality planning tools
Meetings
Cost-Benefit Analysis In the case of quality management, cost of quality trade-offs should be considered from within cost-benefit analysis. The benefits of meeting quality requirements are as follows:
Stakeholder satisfaction is increased.
Costs are lower.
Productivity is higher.
There is less rework.
Cost of Quality The cost of quality (COQ) is the total cost to produce the product or service of the project according to the quality standards. Costs are broken into two categories: cost of conformance, which is money spent during the project to avoid failures, and cost of nonconformance, which is money spent during and after the project because of failures. Four costs are associated with the cost of quality: prevention costs and appraisal costs (conformance) and internal and external failure costs (nonconformance).
Prevention Costs Prevention costs are the costs associated with satisfying customer requirements by producing a product without defects.
Appraisal Costs Appraisal costs are the costs expended to examine the product or process and make certain the requirements are being met.
Failure Costs Failure costs are what it costs when things don’t go according to plan. Failure costs are also known as cost of poor quality. Two types of failure costs exist:
Internal failure costs
External failure costs
There are two categories of costs within COQ, as listed in Table 3.4.
Quality theorists and quality techniques are responsible for the rise of the quality management movement and the theories behind the cost of quality. Figure 3.26 highlights four quality theorists, along with their ideas, with whom you should be very familiar with for the exam.
Philip B. Crosby Philip B. Crosby is known for devising the zero defects practice, which means to do it right the first time. If the defect is prevented from occurring in the first place, costs are lower, conformance to requirements is easily met, and the cost measurement for quality becomes the cost of nonconformance rather than the cost of rework.
Joseph M. Juran Joseph M. Juran is known for the fitness for use premise, which means the stakeholders’ and customers’ expectations are met or exceeded and reflects their views of quality. Juran proposed that there could be grades of quality.
W. Edwards Deming W. Edwards Deming suggested that as much as 85 percent of the cost of quality is management’s responsibility, which came to be known as the 85 percent rule or rule of 85. He believed that workers need to be shown what acceptable quality is and that they need to be provided with the right training so that quality and continuous improvement become natural elements of the working environment. Deming was also a major contributor to the modern quality movement and theories, which emphasize a more proactive approach to quality management (prevention over inspection). For example, he documented 14 points that summarize how management can transform their organization to one that is effective. This and his body of work have been credited for launching the Total Quality Management (TQM) movement. He also popularized the Plan-Do-Check-Act cycle, also referred to as the Deming Cycle, which focuses on continuous improvement.
Six Sigma is a measurement-based strategy that focuses on process improvement and variation reduction by applying Six Sigma methodologies to the project. There are two Six Sigma methodologies:
DMADV (define, measure, analyze, design, and verify) is used to develop new processes or products at the Six Sigma level.
DMAIC (define, measure, analyze, improve, and control) is used to improve existing processes or products.
Walter Shewhart According to some sources, Walter Shewhart is the grandfather of statistical quality control and the Plan-Do-Check-Act model, which was further popularized by Deming. Shewhart developed statistical tools to examine when a corrective action must be applied to a process. He is also known for the control chart techniques.
Kaizen Approach The Kaizen approach—kaizen means improvement in Japanese—is a technique in which all project team members and managers should be constantly watching for quality improvement opportunities. The Kaizen approach states that the quality of the people should be improved first and then the quality of the products or service.
Seven Basic Quality Tools 7QC tools, known in the industry as the seven basic quality tools, help to solve quality-related problems in the context of the Plan-Do-Check-Act model. The Seven Basic Quality tools include the following:
Cause-and-effect diagrams are also known as fishbone diagrams or Ishikawa diagrams. A more complete explanation of this tool occurs in the Identify Risks process description later in this chapter. These diagrams help to trace an issue to its root cause.
Flowcharts show the relationships between the process steps. In regard to quality planning, flowcharting helps the project team identify quality issues before they occur.
Checksheets help to get facts organized in a manner that will facilitate the effective collection of useful data about a potential quality problem. Also called tally sheets, they are useful as a checklist when gathering data.
Pareto diagrams can help reveal the key few sources that are responsible for causing most of a problem’s effects. These diagrams are normally in the special form of a vertical bar chart.
Histograms are also a special form of a bar chart that help with pattern recognition around the central tendency, dispersion, and shape of a statistical distribution. The key difference between histograms and other control charts is that a histogram is not influenced by time on the variations within a distribution.
Control charts help determine if a process is stable and whether process variances are in or out of control.
Scatter diagrams, also called correlation charts, are plot ordered pairs (X,Y) used to study the relationship between two variables.
Benchmarking Benchmarking is a process of comparing previous similar activities to the current project activities to provide a standard against which to measure performance.
Design of Experiments Design of experiments (DOE) is a statistical technique attributed to Genichi Taguchi that identifies the elements—or variables—that will have the greatest effect on overall project outcomes. DOE provides a statistical framework that allows the variables that have the greatest effect on overall project outcomes to be changed at once instead of one at a time.
Statistical Sampling Statistical sampling involves taking a sample number of parts from the whole population and inspecting them to determine whether they fall within acceptable variances.
Additional Quality Planning Tools The PMBOK® Guide lists additional tools, as described in Table 3.5.
Used to generate ideas within a large group. A brainstorming session can also use and review information obtained using the nominal group technique.
Affinity diagrams
Used to group and organize thoughts and facts; can be used in conjunction with brainstorming.
Force field analysis
A method of examining the drive and resistance of change.
Nominal group techniques
Brainstorming sessions consisting of small groups. The ideas of these sessions are later reviewed by a larger group.
Matrix diagrams
Used as a decision-making tool, particularly when several options or alternatives are available.
Prioritization matrices
Used to prioritize complex issues that have numerous criteria for decision making.
Meetings Meetings are used by the project team to assemble the quality management plan using a mixture of the tools and techniques described earlier in this section.
Outputs of Plan Quality Management
There are five outputs of the Plan Quality Management process:
Quality management plan
Process improvement plan
Quality metrics
Quality checklists
Project documents updates
Quality Management Plan The project manager in cooperation with the project staff writes the quality management plan. The plan should be based on the project scope and requirements to successfully prevent defects from occurring, therefore reducing the cost of quality.
The quality management plan includes the following elements:
Description of how the project management team will carry out the quality policy
Resources needed to carry out the quality plan
Responsibilities of the project team in implementing quality
All the processes and procedures the project team and organization should use to satisfy quality requirements, including the following items:
Quality control
Quality assurance techniques
Continuous improvement processes
Process Improvement Plan The process improvement plan focuses on finding inefficiencies in a process or activity and eliminating them. The following elements are among those included in the process improvement plan:
Process boundaries, which describe the purpose for the process and its expected start and end dates
Process configuration so that you know what processes are performed and when and how they interact
Process metrics
Any specific elements that should be targeted for improvement
Quality Metrics A quality metric, also known as operational definition, describes what is being measured and how it will be measured during the Control Quality process.
Quality Checklists Checklists provide a means to determine whether the required steps in a process have been followed. As each step is completed, it’s checked off the list.
Project Documents Updates The following project documents may need to be updated:
Stakeholder register
Responsibility assignment matrix (RAM)
WBS and WBS dictionary
Developing a Human Resource Management Plan
The project manager creates a human resource management plan by carrying out a process called Plan Human Resource Management. Through this process, roles and responsibilities of the project team members are defined and the strategies for using and managing the project team are documented. The high-level purpose of the plan itself is to create an effective project organization structure.
The Plan Human Resource Management process documents the roles and responsibilities of individuals or groups for various project elements and then documents the reporting relationships for each. Reporting relationships can be assigned to groups as well as to individuals, and the groups or individuals might be internal or external to the organization or a combination of both. This process will result in the creation of the human resource management plan, which considers factors such as the availability of resources, skill levels, training needs, and more.
Figure 3.27 shows the inputs, tools and techniques, and outputs of the Plan Human Resource Management process.
FIGURE 3.27 Plan Human Resource Management process
Inputs of Plan Human Resource Management
Inputs of the Plan Human Resource Management process you should know are as follows:
Project Management Plan The human resource management plan borrows several elements from the project management plan, including but not limited to the following:
The project life cycle and the processes that will be applied to each phase
Defining how work will be performed to meet project objectives
A change management plan that documents the monitoring and controlling of changes
A configuration management plan that documents how configuration management will be performed
The maintenance of project baselines
Needs and methods of communicating with stakeholders
Activity Resource Requirements Human resources are needed to perform and complete the activities outlined in the activity resource requirements output of the Estimate Activity Resources process. During the Plan Human Resource Management process, these resources are defined in further detail.
Enterprise Environmental Factors Enterprise environmental factors play a key role in determining human resource roles and responsibilities. The following is a list of factors that are used:
Organizational factors
Existing human resources and marketplace conditions
Personnel policies
Technical factors
Interpersonal factors
Location and logistics
Political factors
Organizational structures
Collective bargaining agreements
Economic conditions
Organizational Process Assets The following elements of the organizational process assets are used in this process:
Organizational processes and standardized role descriptions
Templates and checklists
Historical information
Escalation procedures for handling issues within the team
Tools and Techniques of Plan Human Resource Management
The following are tools and techniques of the Plan Human Resource Management process that you should be familiar with:
Organization charts and position descriptions
Networking
Organizational theory
Expert judgment
Meetings
Organization Charts and Position Descriptions
The following information is presented in organization charts and position descriptions:
Hierarchical Charts Hierarchical charts, like a WBS, are designed in a top-down format. Two types of hierarchical charts that can be used are OBS and RBS:
Organization breakdown structure (OBS), which displays departments, work units, or teams in an organization and their respective work packages
Resource breakdown structure (RBS), which breaks down the work of the project according to the types of resources needed
Matrix-Based Charts Matrix-based charts are used to show the type of resource and the responsibility that resource has in the project. You can use a couple of types of matrix-based charts:
Responsibility assignment matrix (RAM) is displayed as a chart with resource names listed in each column and project phases or WBS elements listed as the rows. Indicators in the intersections show where the resources are needed.
A RACI chart is a type of RAM. Table 3.6 shows a sample portion of an RACI chart for a software development team. In this example, the RACI chart shows the roles and expectations of each participant.
R = Responsible, A = Accountable, C = Consult, I = Inform
The letters in the acronym RACI are the designations shown in Table 3.6:
R = Responsible for performing the work
A = Accountable, the one who is responsible for producing the deliverable or work package and approves or signs off on the work
C = Consult, someone who has input to the work or decisions
I = Inform, someone who must be informed of the decisions or results
Text-Oriented Formats Text-oriented formats are used when there is a significant amount of detail to record. These are also called position descriptions or role-responsibility-authority forms. Text-oriented formats typically provide the following information:
Role
Responsibility
Authority of the resource
Other Sections of the Project Management Plan Other subsidiary plans of the project management plan might also describe roles and responsibilities.
Networking
Networking in this context means human resource networking. According to the PMBOK® Guide, several types of networking activities exist:
Proactive communication
Lunch meetings
Informal conversations
Trade conferences
Symposia
Organizational Theory
Organizational theory refers to all the theories that attempt to explain what makes people, teams, and work units behave.
Expert Judgment
Expert judgment helps inform the human resource management plan by
Listing the preliminary requirements for the required skills
Assessing the roles required for the project based on standardized role descriptions
Determining number of resources and level of effort needed to meet project objectives
Determining reporting relationships
Providing guidelines on leading time required for staffing
Identifying risks associated with staff acquisition, retention, and release plans
Using programs for complying with contracts, both with government and unions
Meetings
Meetings help in the planning of human resources and allow team members to reach consensus on the human resource management plan.
Outputs of Plan Human Resource Management
There is only one output of the Plan Human Resource Management process: the human resource management plan.
The human resource management plan documents how human resources should be defined, staffed, managed and controlled, and released from the project when their activities are complete. This plan is meant to clearly outline the roles and responsibilities of the project team and to create an effective project organization structure. As a result, guidance is provided on how resources are to be used and managed throughout the project.
This output has the following three components:
Roles and Responsibilities The roles and responsibilities component includes the list of roles and responsibilities for the project team. It can take the form of the RAM or RACI, or the roles and responsibilities can be recorded in text format. The following key elements should be included in the roles and responsibilities documentation:
Role describes which part of the project the individuals or teams are accountable for. This should also include a description of authority levels, responsibilities, and what work is not included as part of the role.
Authority describes the amount of authority the resource has to make decisions, dictate direction, and approve the work.
Responsibility describes the work required to complete the project activities.
Competency describes the skills and ability needed to perform the project activities.
Project Organizational Charts The project organizational charts display project team members and their reporting relationships in the project.
Staffing Management Plan The staffing management plan documents how and when human resources are introduced to the project and the criteria for releasing them. The staffing management plan should be updated throughout the project. The following elements should be considered and included in the staffing management plan:
Staff acquisition describes how team members are acquired, where they’re located, and the costs for specific skills and expertise.
Resource calendars describe the time frames in which the resources will be needed on the project and when the recruitment process should begin.
Staff release plan describes how project team members will be released at the end of their assignment, including reassignment procedures.
Training needs describe any training plans needed for team members who don’t have the required skills or abilities to perform project tasks.
Recognition and rewards describe the systems used to reward and reinforce desired behavior.
Compliance details regulations that must be met and any human resource policies the organization has in place that deal with compliance issues.
Safety includes safety policies and procedures that are applicable to the project or industry and should be included in the staffing management plan.
Developing a Communications Management Plan
Communications plays an important role in effectively and efficiently carrying out a project—with successful results! Like other plans, it should be as detailed as needed for the project at hand and should be based on the project organization structure and stakeholder requirements. This plan is responsible for managing the flow of project information and is created out of the Plan Communications process.
Keep in mind that, according to PMI®, a good project manager spends up to 90 percent of their time communicating. Therefore, the communications management plan should be well thought out and clearly documented.
The Plan Communications Management process involves determining the communication needs of the stakeholders by defining the types of information needed, the format for communicating the information, how often it’s distributed, and who prepares it. All of this is documented in the communications management plan, which is an output of this process. The total number of existing communication channels is also calculated in this process.
Figure 3.28 shows the inputs, tools and techniques, and outputs of the Plan Communications Management process.
FIGURE 3.28 Plan Communications Management process
Inputs of Plan Communications Management
Know the following inputs of the Plan Communications Management process:
Project management plan
Stakeholder register
Enterprise environmental factors
Organizational process assets
Project Management Plan The project management plan will provide direction on how information on the project will be executed, monitored, controlled, and closed.
Stakeholder Register The stakeholder register is a list of all the project stakeholders and contains additional information, including their potential influence on the project and their classifications.
Enterprise Environmental Factors All enterprise environmental factors can be used within the Plan Communications Management process. Special attention should be given to the organizational structure and culture as well as external stakeholder requirements. This information will be key to managing the flow of the project’s information.
Organizational Process Assets The PMBOK® Guide notes that all the elements described in the enterprise environmental factors can be used in this process. Particular consideration should be given to lessons learned and historical information.
Tools and Techniques of Plan Communications Management
The Plan Communications Management process includes the following tools and techniques:
Communication requirements analysis
Communication technology
Communication models
Communication methods
Meetings
Communication Requirements Analysis
Communication requirements analysis involves analyzing and determining the communication needs of the project stakeholders. According to the PMBOK® Guide, there are several sources of information you can examine to help determine these needs:
Company and departmental organizational charts
Stakeholder responsibility relationships
Other departments and business units involved in the project
The number of resources involved in the project and where they’re located in relation to project activities
Internal needs that the organization may need to know about the project
External needs that organizations such as the media, government, or industry groups might have that require communication updates
Stakeholder information (documented in the stakeholder register and stakeholder management strategy outputs of Identify Stakeholders)
The preceding list goes through analysis to make certain that information that is valuable to the stakeholders is being supplied. It is important to know the number of communication channels, also known as lines of communication, that exist. Figure 3.29 shows an example of a network model with six stakeholders included.
The nodes are the participants, and the lines show the connection between them all. The formula for calculating the lines of communication is as follows (where n represents total participants):
Figure 3.29 shows six participants. When you plug the total participants into the formula, the result is a total of 15 communication channels:
Communication Technology
Communication technology examines the methods (or technology) used to communicate the information to, from, and among the stakeholders. This tool and technique examines the technology elements that might affect project communications.
The following are examples of methods used when communicating:
Written
Spoken
Email
Formal status reports
Meetings
Online databases
Online schedules
Communication Models
Communication models depict how information is transmitted from the sender and how it’s received by the receiver. According to the PMBOK® Guide, the key components of a communication model are as follows:
Encode Encoding the message means to put information or thoughts into a language that the receiver will understand.
Message and Feedback Message The result or output of the encoding.
Medium The method used to communicate, such as written, oral, or email.
Noise Anything that keeps the message from being either transmitted or understood.
Decode The receiver translates the information that was sent by the sender.
The sender is responsible for encoding the message, selecting the medium, and decoding the feedback message. The receiver is responsible for decoding the original message from the sender and encoding and sending the feedback message. Figure 3.30 shows this dynamic through the basic communication model.
Communication methods refer to how the project information is shared among the stakeholders. According to the PMBOK® Guide, there are three classifications of communication methods:
Interactive Communication Interactive communication involves multidirectional communication where two or more parties must exchange thoughts or ideas. This method includes videoconferencing, phone or conference calls, and meetings.
Push Communications Push communications refers to sending information to intended receivers. It includes methods such as letters, memos, reports, emails, voicemails, and so on. This method assures that the communication was sent but is not concerned with whether it was actually received or understood by the intended receivers.
Pull Communications The likely recipients of the information access the information themselves using methods such as websites, e-learning sites, knowledge repositories, shared network drives, and so on.
Meetings
Meetings are used by the project manager to facilitate conversations with the project team on how project communications should occur throughout the life of the project. According to the PMBOK® Guide, various types of meeting types can be used, many of which help resolve issues and facilitate decisions.
Outputs of Plan Communications Management
The following two outputs result from carrying out the Plan Communications Management process:
Communications Management Plan The communications management plan documents the following:
Types of information needs the stakeholders have
When the information should be distributed
How the information will be delivered
According to the PMBOK® Guide, the communications management plan typically describes the following elements:
The communication requirements of each stakeholder or stakeholder group
Purpose for communication
Frequency of communications, including time frames for distribution
Name of the person responsible for communicating information
Format of the communication and method of transmission
Method for updating the communications management plan
Glossary of common terms
The information that will be shared with stakeholders and the distribution methods are based on the following items:
Needs of the stakeholders
Project complexity
Organizational policies
Project Documents Updates The following updates may be required as a result of performing this process:
Project schedule
Stakeholder register
Developing a Procurement Management Plan
In many cases, some resources will need to be obtained externally (meaning outside of the project’s organization). When this is the case, a procurement management plan will be needed. This plan is created out of the Plan Procurement Management process, which is also responsible for producing other key procurement documents.
The procurement management plan should be based on the project’s scope and schedule and is responsible for guiding the procurement-related processes and ensuring that the required project resources will be available when and as needed.
Plan Procurement Management is a process of identifying what goods or services will be purchased from outside the organization. This process addresses the make-or-buy decision and when acquired goods or services will be needed. By the end of this process, a procurement management plan will have been created, make-or-buy decisions will have been made, and a contract statement of work will have been drafted.
Figure 3.31 shows the inputs, tools and techniques, and outputs of the Plan Procurement Management process.
You should be familiar with these inputs to the Plan Procurement Management process:
Project management plan
Requirements documentation
Risk register
Activity resource requirements
Project schedule
Activity cost estimates
Stakeholder register
Enterprise environmental factors
Organizational process assets
Project Management Plan The Plan Procurement Management process uses the project scope statement, which is included within the scope baseline. The scope baseline is part of the project management plan.
Requirements Documentation The requirements documentation established the details of the project requirements. For a more detailed description, see “Outputs of Collect Requirements” earlier in this chapter.
Risk Register The risk register guides the project team in determining the types of services or goods needed for risk management. It also identifies which procurement decisions are driven as a result of a risk response, such as acquiring insurance or other services to transfer liability to a third party.
Activity Resource Requirements The availability of the assigned resources will impact the procurement process and will aid in the make-or-buy decision.
Project Schedule The project schedule is necessary for determining the start and finish dates of activities that will be completed through a third party.
Activity Cost Estimates Activity cost estimates are necessary for determining the budget allotted for completing project activities, which will influence make-or-buy decisions and services or goods acquired.
Stakeholder Register The stakeholder register shows details on the participants in the project and their interest in the outcomes.
Enterprise Environmental Factors Marketplace conditions are the key element of enterprise environmental factors used within this process. Other factors include products, services, and results available in the marketplace; unique local requirements; and industry-specific typical terms and conditions.
Organizational Process Assets The organization’s guidelines, policies, and procedures (including any procurement policies and guidelines) are the elements of the organizational process assets used in this process. Legal contractual relationships are another component to organizational process assets for the Plan Procurement Management process. Contracts will generally fall into two general categories: fixed-price or cost reimbursable.
A contract is a compulsory agreement between two or more parties and is used to acquire products or services from outside the organization. Contracts are enforceable by law and require an offer and an acceptance, with money typically exchanged for goods or services. As reflected in Figure 3.32, there are different types of contracts for different purposes.
The PMBOK® Guide divides contracts into three categories:
Fixed-Price, or Lump-Sum, Contracts Fixed-price contracts (also referred to as lump-sum contracts) can either set a specific, firm price for the goods or services rendered (known as a firm fixed-price contract) or can include incentives for meeting or exceeding certain contract deliverables. There are three types of fixed-price contracts:
In a firm fixed-price (FFP) contract, the buyer and seller agree on a well-defined deliverable for a set price. In this kind of contract, the biggest risk is borne by the seller. The seller assumes the risks of increasing costs, nonperformance, or other problems.
Fixed-price incentive fee (FPIF) contracts are another type of fixed-price contract. The difference is that the contract includes an incentive—or bonus—for early completion or for some other agreed-upon performance criterion that meets or exceeds contract specifications. Some of the risk is borne by the buyer as opposed to the firm fixed-price contract, where most of the risk is borne by the seller.
A fixed-price with economic price adjustment (FP-EPA) contract allows for adjustments due to changes in economic conditions, like cost increases or decreases, inflation, and so on. These contracts are typically used when the project spans many years. This type of contract protects both the buyer and the seller from economic conditions that are outside of their control.
Cost-Reimbursable, or Cost Plus, Contracts With cost-reimbursable contracts, the allowable costs associated with producing the goods or services are charged to the buyer. All the costs the seller takes on during the project are charged back to the buyer; thus, the seller is reimbursed. Cost-reimbursable contracts carry the highest risk for the buyer because the total costs are uncertain and are used most often when the project scope contains a lot of uncertainty or for projects that have large investments early in the project life. The following list includes three types of cost-reimbursable contracts:
Cost plus fixed fee (CPFF) contracts charge back all allowable project costs to the seller and include a fixed fee upon completion of the contract. The fee is always firm in this kind of contract, but the costs are variable. The seller doesn’t necessarily have a lot of motivation to control costs with this type of contract.
Cost plus incentive fee (CPIF) is the type of contract in which the buyer reimburses the seller for the seller’s allowable costs and includes an incentive for meeting or exceeding the performance criteria laid out in the contract. A possibility of shared savings between the seller and buyer exists if performance criteria are exceeded.
Cost plus award fee (CPAF) is the riskiest of the cost plus contracts for the seller. In a CPAF contract, the seller will recoup all the costs expended during the project, but the award fee portion is subject to the sole discretion of the buyer.
Time and Material (T&M) Contracts T&M contracts are a cross between fixed-price and cost-reimbursable contracts. The full amount of the material costs is not known at the time the contract is awarded. T&M contracts are most often used when human resources with specific skills are needed and when the scope of work needed for the project can be quickly defined. Time and material contracts include the following characteristics:
This type of contract resembles a cost-reimbursable contract because the costs will continue to grow during the contract’s life and are reimbursable to the contractor. The buyer bears the biggest risk in this type of contract.
This type of contract resembles fixed-price contracts when unit rates are used. Unit rates might be used to preset the rates of certain elements or portions of the project.
Tools and Techniques of Plan Procurement Management
Know these four tools and techniques of the Plan Procurement Management process:
Make-or-buy analysis
Expert judgment
Market research
Meetings
Make-or-Buy Analysis Make-or-buy analysis is concerned with whether it is more cost-effective to buy or lease the products and services or more cost-effective for the organization to produce the goods and services needed for the project. Costs should include both direct costs and indirect costs.
Other considerations in make-or-buy analysis are as follows:
Capacity issues
Skills
Availability
Trade secrets
Expert Judgment Expert judgment can be used within the Plan Procurement Management process.
Market Research With market research, an examination is conducted of industry- and vendor-specific capabilities. This effort can be conducted with information obtained at industry conferences, by evaluating online reviews, and by using a variety of sources to identify market capabilities.
Meetings As a complement to the effort of market research, meetings with potential bidders may be conducted to help augment the interchange of information. This approach can be mutually beneficial to both the purchaser and the supplier.
Outputs of Plan Procurement Management
Know the following outputs of the Plan Procurement Management process:
Procurement management plan
Procurement statement of work
Procurement documents
Source selection criteria
Make-or-buy decisions
Change requests
Project documents update
Procurement Management Plan The procurement management plan details how the procurement process will be managed. According to the PMBOK® Guide, it includes the following information:
Types of contracts to use
Authority of the project team
How the procurement process will be integrated with other project processes
Where to find standard procurement documents (provided your organization uses standard documents)
How many vendors or contractors are involved and how they’ll be managed
How the procurement process will be coordinated with other project processes, such as performance reporting and scheduling
How the constraints and assumptions might be impacted by purchasing
How multiple vendors or contractors will be managed
Coordination of purchasing lead times with the development of the project schedule
Schedule dates that are determined in each contract
Identification of prequalified sellers (if known)
Risk management issues
Procurement metrics for managing contracts and for evaluating sellers
Directions to sellers regarding the development and maintenance of the WBS
Setting of the form and format of statements of work
Selection of prequalified sellers to be used, if there are any
Identification of procurement metrics to be used to manage contracts and evaluate sellers
As with other plans, the procurement management plan can be highly detailed or broadly stated, and can be formal or informal based on the needs of the project.
Procurement Statement of Work A procurement statement of work (SOW) contains the details of the procurement item in clear, concise terms. It includes the following elements:
Project objectives
Description of the work of the project and any post-project operational support needed
Concise specifications of the product or services required
Project schedule, time period of services, and work location
The procurement SOW is prepared by the buyer and is developed from the project scope statement and the WBS and WBS dictionary. The seller uses the SOW to determine whether they are able to produce the goods or services as specified. It will undergo progressive elaboration as the procurement processes occur.
Procurement Documents Procurement documents are used to solicit vendors and suppliers to bid on procurement needs. These documents are prepared by the buyer to assure as accurate and complete a response as possible from all potential bidders. Examples of procurement documents include the following:
Request for proposal (RFP)
Request for information (RFI)
Invitation for bid (IFB)
Request for quotation (RFQ)
Procurement documents typically include the following information:
Clear description of the work requested
Contract SOW
Explanation of how sellers should format and submit their responses
Any special provisions or contractual needs
The following words are used during the procurement process:
When the decision is going to be made primarily on price, the words bid and quotation are used, as in IFB or RFQ.
When considerations other than price (such as technology or specific approaches to the project) are the deciding factor, the word proposal is used, as in RFP.
Procurement documents are posted or advertised according to the buyer’s organizational policies. This might include ads in newspapers and magazines or ads/posts on the Internet.
Source Selection Criteria The term source selection criteria refers to the method the buyer’s organization will use to choose a vendor from among the proposals received. The criteria might be subjective or objective.
Here are some examples of criteria used:
Purchase price
Scoring models
Rating models
The following list includes some of the criteria for evaluating proposals and bids:
Comprehension and understanding of the needs of the project as documented in the contract SOW
Cost
Technical ability of the vendor and their proposed team
Technical approach
Risk
Experience on projects of similar size and scope, including references
Project management approach
Management approach
Financial stability and capacity
Production capacity
Reputation, references, and past performance
Intellectual and proprietary rights
Make-or-Buy Decisions The make-or-buy decision is a document that outlines the decisions made during the process regarding which goods and/or services will be produced by the organization and which will be purchased. This can include any number of items:
Services
Products
Insurance policies
Performance
Performance bonds
Change Requests As a result of going through this process, changes to the project management plan may be required due to vendor capability, availability, cost, quality considerations, and so on. Change requests must be processed through the Perform Integrated Change Control process.
Project Documents Updates According to the PMBOK® Guide, the list of project documents that may be updated include but are not limited to
Requirements documentation
Requirements traceability matrix
Risk register
Developing a Change Management Plan
Managing changes is important to successfully managing a project overall. Scope creep is often the result of a poorly documented scope and poorly documented change control procedures. To ensure that changes are managed appropriately, a change management plan should be created. It should be noted that there isn’t a formal documented process that creates this plan.
The change management plan should document the following:
How changes will be monitored and controlled
Detailed processes for managing change to a project
How change requests are to be documented and managed
Process for approving changes
How to document and manage the final recommendation for the change requests
Developing a Risk Management Plan
The first official step in performing risk management is creating a risk management plan. This is done by carrying out the Plan Risk Management process, which is the first official process of the Project Risk Management Knowledge Area. Five of the six processes that fall in this Knowledge Area belong to the Planning process group.
The risk management plan is created to manage uncertainty throughout the project life cycle, which allows the project management team to control the outcome of the project to the extent possible. Like other plans, it plays an important role in guiding the rest of the processes that fall within its respective Knowledge Area. Without the risk management plan, a project management team cannot effectively identify and manage risks because this plan ensures that everyone is on the same page when it comes to assessing, prioritizing, responding to, and managing risks.
Aside from the Plan Risk Management process, the following risk-related processes fall within the Planning process group: Identify Risks, Perform Qualitative Risk Analysis, Perform Quantitative Risk Analysis, and Plan Risk Responses. Remember that there is one other process, Control Risks, which is a part of the Monitoring and Controlling process group that we will cover in Chapter 5.
Plan Risk Management
The Plan Risk Management process determines how the project team will conduct risk management activities. The risk management plan, which will be developed during this process, guides the project team in carrying out the risk management processes and also assures that the appropriate amount of resources and time is dedicated to risk management. By the end of this process, the project team will have developed a common understanding for evaluating risks throughout the remainder of the project.
Figure 3.33 shows the inputs, tools and techniques, and outputs of the Plan Risk Management process.
You should know the following inputs of the Plan Risk Management process:
Project management plan
Project charter
Stakeholder register
Enterprise environmental factors
Organizational process assets
Project Management Plan For the purposes of risk management planning, it is necessary to consider all other approved subsidiary management plans and baselines. The project management plan sets the baseline for all risk-affected areas, especially scope, schedule, and cost.
Project Charter From the project charter, various inputs can be gleaned, including risks, project descriptions, and requirements, all at a high level.
Stakeholder Register Using the stakeholder register will provide the details related to the project stakeholder, including an overview of their roles.
Enterprise Environmental Factors One of the key elements of the enterprise environmental factors to consider in this process is the risk tolerance levels of the organization and the stakeholders. This is important for evaluating and ranking risk.
Organizational Process Assets Organizational process assets include policies and guidelines that might already exist in the organization. The following should be considered when developing the risk management plan:
Risk categories
Risk statement formats
Risk management templates tailored to the needs of the project
Defined roles and responsibilities
Authority levels of the stakeholders and project manager
Tools and Techniques of Plan Risk Management
The Plan Risk Management process has three tools and techniques: analytical techniques, expert judgment, and meetings.
Analytical Techniques To create and communicate the overall risk management context of the project, analytical techniques are used. The risk management context combines the strategic risk exposure of a given project with the stakeholders’ attitude on risk. These assessments will inform the project team on the appropriate resource allocation and allow the team to focus on risk management activities.
Expert Judgment In the creation of a comprehensive risk management plan, the judgment and expertise should be considered from those with specialized training or knowledge in the subject area including but not limited to
Senior management
Other project managers who have performed similar work efforts
Subject matter experts in the field
Project stakeholders
Industry groups and consultants
Technical and professional associations
Meetings The purpose of the meetings is to contribute to the risk management plan. During these meetings, the fundamental plans for performing risk management activities will be discussed and determined and then documented in the risk management plan.
Outputs of Plan Risk Management
The output of the Plan Risk Management process is the risk management plan.
The risk management plan describes how you will define, monitor, and control risks throughout the project. It details how risk management processes will be implemented, managed, monitored, and controlled.
According to the PMBOK® Guide, the risk management plan should include the following elements:
Methodology Methodology is a description of how you’ll perform risk management, including elements such as methods, tools, and where you might find risk data that you can use in the later processes.
Roles and Responsibilities The risk management plan should include descriptions of the people who are responsible for managing the identified risks and their responses and the people responsible for each type of activity identified in the plan.
Budgeting The budget for risk management activities is included in the plan as well. In this section, you’ll assign resources and estimate the costs of risk management activities and its methods. These costs are then included in the cost performance baseline.
Timing Timing refers to how often and at what point in the project life cycle risk management processes will occur. You may also include protocols to establish contingency schedule reserves.
Revised Stakeholder Tolerances As the project proceeds through the risk management processes, risk tolerances will change. These are documented in the risk management plan. Risk management should be carried out according to stakeholder risk tolerances.
Reporting Formats In the reporting formats section, you’ll describe the content and format of the risk register. You should also detail how risk management information will be maintained, updated, analyzed, and reported to project participants.
Tracking This includes a description of how you’ll document the history of the risk activities for the current project and how the risk processes will be audited.
Risk Categories Risk categories are a way of systematically identifying risks and providing a foundation for understanding. Risk categories should be identified during this process and documented in the risk management plan.
There are multiple ways of displaying risk categories, such as through a simple list or by constructing a risk breakdown structure (RBS), which lists the categories and subcategories. Figure 3.34 shows a sample of an RBS.
The following list includes some examples of the categories you might consider during this process:
Technical/quality/performance risks
Project management risks
Organizational risks
External risks
Defining Probability and Impact The definitions for probability and impact are documented in the risk management plan as they relate to potential positive or negative risk events and their impacts on project objectives.
Probability describes the potential for the risk event occurring.
Impact describes the effects or consequences the project will experience if the risk event occurs.
Probability and Impact Matrix A probability and impact matrix prioritizes the combination of probability and impact scores and helps determine which risks need detailed risk response plans.
Identify Risks
The Identify Risks process describes all the risks that might impact the project and documents their characteristics in the risk register. Identify Risks is an iterative process that continually builds on itself as additional risks emerge. The risk register is created at the end of this process. The risk register documents all risk information, proposed responses, responses implemented, and status.
Figure 3.35 shows the inputs, tools and techniques, and outputs of the Identify Risks process.
You should be familiar with the following inputs of the Identify Risks process:
Risk management plan
Cost management plan
Schedule management plan
Quality management plan
Human resource management plan
Scope baseline
Activity cost estimates
Activity duration estimates
Stakeholder register
Project documents
Procurement documents
Enterprise environmental factors
Organizational process assets
Risk Management Plan In this process, the roles and responsibilities section of the risk management plan will be used, as well as the budget and schedule set aside for risk activities.
Cost Management Plan, Schedule Management Plan, Quality Management Plan, Human Resource Management Plan, Project Documents An understanding of the project management plans and project documents is necessary for identifying risks. A thorough review of these documents should be carried out to identify risks associated with them.
Scope Baseline The project scope statement, part of the scope baseline, contains a list of project assumptions, which are issues believed to be true. The assumptions about delivery times are reexamined, and it is determined if they are still valid.
Activity Cost Estimates Activity cost estimates may provide insight into the identification of risks if the estimates are found to be insufficient to complete the activity.
Activity Duration Estimates Activity duration estimates may reveal existing risks in relation to the time that has been allotted for completing an activity or the project as a whole.
Stakeholder Register Understanding stakeholder influence is essential to risk management. The stakeholder register provides a list of stakeholders and may list levels of influence.
Procurement Documents When a project requires the use of external procurement of resources, procurement documents are an influential input to the Identify Risks process.
Enterprise Environmental Factors The enterprise environmental factors include aspects from outside the project that might help determine or influence project outcomes. Industry information or academic research that might exist for your application areas regarding risk information is especially relevant.
Organizational Process Assets Historical information, such as from previous project experiences and project team knowledge, is used from within the organizational process assets. Risk register templates can also be used from past similar projects.
Tools and Techniques of Identify Risks
The Identify Risks process includes the following tools and techniques:
Documentation reviews
Information-gathering techniques
Checklist analysis
Assumptions analysis
Diagramming techniques
SWOT analysis
Expert judgment
Documentation Reviews Documentation reviews involve reviewing project plans, assumptions, and historical information from previous projects from a total project perspective as well as from an individual deliverables and activities level. This review helps the project team identify risks associated with the project objectives.
Information-Gathering Techniques The following information-gathering techniques are used to assist in compiling a comprehensive list of risks:
Brainstorming
Delphi technique
Interviewing
Root cause analysis
Checklist Analysis Checklists used during the Identify Risks process are usually developed based on historical information and previous project team experience. The lowest level of the RBS or a list of risks from previous similar projects may be used. The WBS can also be used as a checklist.
Assumptions Analysis Assumptions analysis is a matter of validating the assumptions identified and documented during the course of the project planning processes. Assumptions should be accurate, complete, and consistent. All assumptions are tested against two factors:
Strength of the assumption or the validity of the assumption
Consequences that might impact the project if the assumption turns out to be false
Diagramming Techniques Three types of diagramming techniques are used in the Identify Risks process:
Cause-and-Effect Cause-and-effect diagrams show the relationship between the effects of problems and their causes. This diagram depicts every potential cause and subcause of a problem and the effect that each proposed solution will have on the problem. This diagram is also called a fishbone diagram or Ishikawa diagram after its developer, Kaoru Ishikawa. Figure 3.36 shows a sample cause-and-effect diagram.
System of Process Flowcharts The system of process flowcharts shows the logical steps needed to accomplish an objective, how the elements of a system relate to each other, and which actions cause which responses. Figure 3.37 shows a flowchart to help determine whether risk response plans should be developed for the risk.
Influence Diagramming According to the PMBOK® Guide, influence diagramming typically shows the causal influences among project variables, the timing or time ordering of events, and the relationships among other project variables and their outcomes. Figure 3.38 shows an influence diagram for a product introduction decision.
SWOT Analysis Strengths, weaknesses, opportunities, and threats (SWOT) analysis is a technique that examines the project from each of these viewpoints and from the viewpoint of the project itself. SWOT should also be used to examine project management processes, resources, the organization, and so on to identify risks to the project, including risks that are generated internally. SWOT analysis uncovers the following:
Negative risks, which are typically associated with the organization’s weaknesses
Positive risks, which are typically associated with the organization’s strengths
SWOT analysis also determines whether any of the organization’s strengths can be used to overcome its weaknesses.
Expert Judgment Experts for risk identification purposes can include individuals with the following experience:
Experience with similar projects
Experience in the business area for which the project was undertaken
Industry-specific experience
The bias of experts regarding the project or potential risk events should be considered when using this technique.
Outputs of Identify Risks
There is only one output of the Identify Risks process: the risk register.
The risk register contains the following elements:
List of identified risks
List of potential responses
List of Identified Risks Risks are all the potential events and their subsequent consequences that could occur as identified during this process. A list provides a means of tracking risks and their occurrence and responses. The list should contain the following items:
All potential risks
Tracking number
Potential cause or event
Potential impact
Responses implemented
List of Potential Responses While you’re identifying risks, you may identify a potential response at the same time. If this is the case, these potential responses are documented.
Table 3.7 shows a sample template for a risk register.
Compress the schedule by beginning tasks in the next milestone while working on operating system upgrade.
Perform Qualitative Risk Analysis
The Perform Qualitative Risk Analysis process involves determining what impact the identified risks will have on the project objectives and the probability that they will occur. It also ranks the risks in priority order according to their effect on the project objectives. The purpose of this process is to determine risk event probability and risk impact. By the end of this process, updates will have been made to the risk register.
Figure 3.39 shows the inputs, tools and techniques, and outputs of the Perform Qualitative Risk Analysis process.
FIGURE 3.39 Perform Qualitative Risk Analysis process
Inputs of Perform Qualitative Risk Analysis
Know the following inputs of the Perform Qualitative Risk Analysis process and how they apply:
Risk management plan
Scope baseline
Risk register
Enterprise environmental factors
Organizational process assets
Risk Management Plan The risk management plan documents the following, which are used when prioritizing risks:
Roles and responsibilities of risk team members
Budget and schedule factors for risk activities
Stakeholder risk tolerances
Definitions for probability and impact
Probability and impact matrix
Scope Baseline Projects that have been attempted before will tend to have better understood risks, whereas projects that are first-of-their-kind or are highly complex will tend to be more uncertain. Through an examination of the scope baseline, these factors will become clearer.
Risk Register The list of risks from within the risk register is used in this process.
Enterprise Environmental Factors As with other processes that we have examined earlier, enterprise environmental factors will provide insight and context to the risk assessment, including studying industry projects of a similar nature and exploring risk databases that may be available from industry or proprietary sources.
Organizational Process Assets Historical information, lessons learned, and risk databases from past projects are used from within the organizational process assets as a guide for prioritizing the risks for this project.
Tools and Techniques of Perform Qualitative Risk Analysis
The following tools and techniques are used in the Perform Qualitative Risk Analysis process:
Risk probability and impact assessment
Probability and impact matrix
Risk data quality assessment
Risk categorization
Risk urgency assessment
Expert judgment
Risk Probability and Impact Assessment This tool and technique assesses the probability that the risk events identified will occur and determines the effect (or impact) they have on the project objectives:
Probability Probability is the likelihood that an event will occur.
Impact Impact is the amount of pain or gain that the risk event poses to the project. The following are two types of scales used to assign a value to risk:
The risk impact scale, also known as an ordinal scale, can be a relative scale that assigns values such as high, medium, or low.
Cardinal scale values are actual numeric values assigned to the risk impact. Cardinal scales are expressed as values from 0.0 to 1.0 and can be stated in equal (linear) or unequal (nonlinear) increments.
Table 3.8 shows a typical risk impact scale for cost, time, and quality objectives based on a high-high to low-low scale.
Significant impact requiring customer approval to proceed
Unacceptable quality
Product not usable
Assessing Probability and Impact The idea behind both probability and impact values is to develop predefined measurements that describe which value to place on a risk event. Assumptions used to arrive at these determinations should also be documented in this process.
Probability and Impact Matrix The outcome of a probability and impact matrix is an overall risk rating for each of the project’s identified risks. The following are characteristics of the probability and impact matrix:
The combination of probability and impact results in a classification usually expressed as high, medium, or low.
Values assigned to the risks determine how the Plan Risk Responses process is carried out for the risks later during the risk-planning processes.
Values for the probability and impact matrix (and the probability and impact scales) are determined prior to the start of this process.
The impact and probability matrix is documented in the risk management plan.
Risk Data Quality Assessment The risk data quality assessment involves determining the usefulness of the data gathered to evaluate risk. The data must be unbiased and accurate. Elements such as the following are used when performing this tool and technique:
Quality of the data used
Availability of data regarding the risks
How well the risk is understood
Reliability and integrity of the data
Accuracy of the data
Risk Categorization Risk categorization is used to determine the effects risk has on the project.
Risk Urgency Assessment Risk urgency assessment determines how soon the potential risks might occur and quickly determines responses for those risks that could occur in the near term. The following play a role in determining how quickly a risk response is needed:
Risk triggers
Time to develop and implement a response
Overall risk rating
Expert Judgment Expert judgment is used to determine the probability, impact, and other information derived to date from this process. Interviews and facilitated workshops are two techniques used in conjunction with expert judgment to perform this process.
Outputs of Perform Qualitative Risk Analysis
The output of the Perform Qualitative Risk Analysis process delivers project documents updates, including updates to the risk register and assumptions log.
According to the PMBOK® Guide, the risk register will receive the following updates, which are added as new entries:
Risk ranking (or priority) for the identified risks
Risks grouped by categories
Causes of risk
List of risks requiring near-term responses
List of risks that need additional analysis and response
Watch list of low-priority risks
Trends in qualitative risk analysis results
The assumptions log will receive updates as new information is made available through the qualitative risk assessment. Assumptions could be incorporated in the project scope statement or in a separate log.
Perform Quantitative Risk Analysis
The Perform Quantitative Risk Analysis process evaluates the impacts of risk prioritized during the Perform Qualitative Risk Analysis process and quantifies risk exposure for the project by assigning numeric probabilities to each risk and determining their impacts on project objectives. The purpose of this process is to perform the following:
Quantify the project’s possible outcomes and probabilities.
Determine the probability of achieving the project objectives.
Identify risks that need the most attention by quantifying their contribution to overall project risk.
Identify realistic and achievable schedule, cost, or scope targets.
Determine the best project management decisions possible when outcomes are uncertain.
Figure 3.40 shows the inputs, tools and techniques, and outputs of the Perform Quantitative Risk Analysis process.
FIGURE 3.40 Perform Quantitative Risk Analysis process
Inputs of Perform Quantitative Risk Analysis
Know the following inputs of the Perform Quantitative Risk Analysis process:
Risk management plan
Cost management plan
Schedule management plan
Risk register
Enterprise environmental factors
Organizational process assets
Risk Management Plan The risk management plan guides the project team in carrying out the risk processes. The following key elements are used from within the risk management plan:
Roles and responsibilities
Risk management activities
Guidelines for setting aside contingency reserves
RBS
Stakeholder tolerances
Cost Management Plan The cost management plan provides the necessary information to address cost-related risks so that the project can be kept within budget.
Schedule Management Plan The schedule management plan provides the necessary information to address schedule-related risks so that the project can be kept on schedule.
Risk Register The risk register contains a list of identified risks as well as any other documented information on risks to date.
Enterprise Environmental Factors Enterprise environmental factors contribute insight and context to the risk analysis. Two factors to consider are industry studies of similar projects that are conducted by risk specialists, and a review of risk databases available from the industry or through proprietary sources.
Organizational Process Assets The organizational process assets include historical information from previous projects.
Tools and Techniques of Perform Quantitative Risk Analysis
Three tools and techniques are used in the Perform Quantitative Risk Analysis process:
Data-gathering and representation techniques
Quantitative risk analysis and modeling techniques
Expert judgment
Data-Gathering and Representation Techniques Data-gathering and representative techniques are as follows:
Interviewing Project team members, stakeholders, and subject matter experts are typical interview subjects. Oftentimes, three-point estimates are gathered from the experts to quantify the probability and impact of risks on project objectives. The following interview topics are common:
Experiences on past projects
Experiences working with the types of technology or processes used during this project
Probability Distributions Continuous probability distributions (particularly beta and triangular distributions) are commonly used in Perform Quantitative Risk Analysis. According to the PMBOK ® Guide, the following probability distributions are often used:
Normal and lognormal
Triangular
Beta
Uniform distributions
Discrete distributions
Distributions are graphically displayed and represent both the probability and time or cost elements.
Quantitative Risk Analysis and Modeling Techniques One or more of the following quantitative risk analysis and modeling techniques are used:
Sensitivity Analysis Sensitivity analysis is a quantitative method of analyzing the potential impact of risk events on the project and determining which risk event (or events) has the greatest potential for impact by examining all the uncertain elements at their baseline values. Figure 3.41 shows a sample tornado diagram, which is one of the ways that sensitivity analysis data can be displayed.
Expected Monetary Value (EMV) Analysis Expected monetary value (EMV) analysis is a statistical technique that calculates the average, anticipated future impact of the decision. EMV is calculated by multiplying the probability of the risk by its impact and then adding them together:
Positive results generally indicate an opportunity within the project.
Negative results generally indicate a threat to the project.
EMV is used in conjunction with the decision tree analysis technique. Decision trees are diagrams that show the sequence of interrelated decisions and the expected results of choosing one alternative over the other. Typically, more than one choice or option is available in response to a decision. The available choices are depicted in tree form, starting at the left with the risk decision branching out to the right with possible outcomes. Decision trees are usually used for risk events associated with time or cost. Figure 3.42 shows a sample decision tree using EMV as one of its inputs.
Modeling and Simulation Modeling and simulation techniques are often used for schedule risk analysis and cost analysis. Simulation techniques compute the project model using various inputs, such as cost or schedule duration, to determine a probability distribution for the variable chosen. Modeling and simulation techniques examine the identified risks and their potential impacts to the project objectives from the perspective of the whole project.
Monte Carlo analysis is an example of a simulation technique. It is replicated many times, typically using cost or schedule variables. Every time the analysis is performed, the values for the variable are changed with the output plotted as a probability distribution. This type of information helps the risk management team determine the probability of completing the project on time and/or within budget.
Expert Judgment Experts can come from inside or outside the organization and should have experience that’s applicable to the project. When performing quantitative risk analysis, experts can also assist in validating the data and tools used.
Outputs of Perform Quantitative Risk Analysis
Like the process before it, the Perform Quantitative Risk Analysis process contains one output, project documents updates, including the risk register.
The following risk register updates occur as a result of this process:
Probabilistic analysis of the project
Probability of achieving the cost and time objectives
Prioritized list of quantified risks
Trends in Perform Quantitative Risk Analysis results
Probabilistic Analysis of the Project Probabilistic analysis of the project is the forecasted results of the project schedule and costs as determined by the outcomes of risk analysis. The following are characteristics of probabilistic analysis:
Results include projected completion dates and costs along with a confidence level associated with each.
The output is often expressed as a cumulative distribution.
Results are used along with stakeholder risk tolerances to quantify the time and cost contingency reserves.
Probability of Achieving the Cost and Time Objectives The probability of achieving the cost and time objectives of the project are documented based on the results of performing the quantitative risk analysis tools and techniques.
Prioritized List of Quantified Risks The prioritized list of risks includes the following items:
Risks with the greatest risk or threat to the project
Risk impacts
Risks that present the greatest opportunities to the project
Risks that are most likely to impact the critical path
Risks with the largest cost contingency
Trends in Perform Quantitative Risk Analysis Results Trends in Perform Quantitative Risk Analysis appear as the process is repeated. Trends are documented for further analysis and for use in developing risk response plans.
Plan Risk Responses
Plan Risk Responses is a process of deciding what actions to take to reduce threats and take advantage of the opportunities discovered during the risk analysis processes. This includes assigning resources the responsibility of carrying out risk response plans outlined in this process. By the end of this process, the risk register will be updated to include a risk response plan for all risks that require some form of action.
Figure 3.43 shows the inputs, tools and techniques, and outputs of the Plan Risk Responses process.
Avoid To avoid a risk means to evade it altogether, eliminate the cause of the risk event, or change the project plan to protect the project objectives from the risk event.
Here are some examples of avoiding risk:
Improving communications
Refining requirements
Assigning additional resources to project activities
Refining the project scope to avoid risk events
Transfer The purpose of risk transfer is to transfer a risk and its consequences to a third party. This strategy will impact the project budget.
Here are some examples of transferring risk:
Insurance
Contracting
Warranties
Guarantees
Performance bonds
Mitigate To mitigate a risk means to reduce the probability of a risk event and its impacts to an acceptable level. According to the PMBOK® Guide, the purpose of mitigation is to reduce the probability that a risk will occur and reduce the impact of the risk to an acceptable level.
Accept The acceptance strategy is used when the project team isn’t able to eliminate all the threats to the project. Acceptance of a risk event is a strategy that can be used for risks that pose either threats or opportunities to the project. There are two forms of acceptance:
Passive acceptance occurs when the project team has assessed the risk as low enough in probability and/or impact that they choose to do no additional planning for that potential event at this time.
Active acceptance includes developing contingency reserves to deal with risks should they occur.
Strategies for Positive Risks or Opportunities Strategies for positive risks or opportunities, as shown in Figure 3.45, include exploit, share, enhance, and accept.
Exploit Exploiting a risk event is to look for opportunities for positive impacts. This is the strategy of choice when positive risks have been identified and the project team wants to make certain the risk will occur within the project. An example of exploiting a risk would be reducing the amount of time to complete the project by bringing on more qualified resources.
Share The share strategy is similar to transferring because risk is assigned to a third-party owner who is best able to bring about the opportunity the risk event presents. An example of sharing a risk would be a joint venture.
Enhance The enhance strategy involves closely watching the probability or impact of the risk event to assure that the organization realizes the benefits. This entails watching for and emphasizing risk triggers and identifying the root causes of the risk to help enhance impacts or probability.
Accept This is similar to the accept strategies used for negative risks or threats.
Contingent Response Strategies Contingent response strategies, also known as contingency planning, involves planning alternatives to deal with the risks should they occur. Contingency planning recognizes that risks may occur and that plans should be in place to deal with them.
The following contingency responses are common:
Contingency reserves, which include project funds that are held in reserve to offset any unavoidable threats that might occur to project scope, schedule, cost, or quality. Also includes reserving time and resources to account for risks.
Fallback plans, which are developed for risks with high impact or for risks with identified strategies that might not be the most effective at dealing with the risk.
Expert Judgment Expert judgment is used in developing risk responses, including feedback and guidance from risk management experts and those internal to the project qualified to provide assistance in this process.
Outputs of Plan Risk Responses
Here are the two outputs of the Plan Risk Responses process:
Project management plan updates
Project documents updates
Project Management Plan Updates The following documents within the project management plan may require updates to reflect the changes in process and practice that are driven by the risk responses:
Any and all of the management plans, including the schedule management plan, cost management plan, quality management plan, procurement management plan, and human resource management plan
Any and all of the project baselines, including the scope baseline, schedule baseline, and cost baseline
Project Documents Updates There are several project document updates, with the key update occurring to the risk register. Elements to the risk register can include but are not limited to
List of identified risks, including their descriptions, what WBS element they impact (or area of the project), categories (RBS), root causes, and how the risks impact the project objectives
Risk owners and their responsibility
Outputs from the Perform Qualitative Analysis process
Agreed-upon response strategies
Actions needed to implement response plans
Risk triggers
Cost and schedule activities needed to implement risk responses
Contingency plans
Fallback plans, which are risk response plans that are executed when the initial risk response plan proves to be ineffective
Contingency reserves
Residual risk, which is a leftover risk that remains after the risk response strategy has been implemented
Secondary risks, which are risks that come about as a result of implementing a risk response
Other project documents, such as technical documentation and the assumptions documented in the project scope statement, may require an update after performing this process.
Developing a Stakeholder Management Plan
The primary reason that a project is undertaken is to satisfy the expectations of the project stakeholders. Clearly, it is important to ensure efforts are made to identify, work with, and communicate with the appropriate stakeholders. Within the Planning process group, the Plan Stakeholder Management process is the key work effort for the Project Stakeholder Management Knowledge Area.
Figure 3.46 shows the inputs, tools and techniques, and outputs of the Plan Stakeholder Management process.
Know the following inputs of the Plan Stakeholder Management process:
Project management plan
Stakeholder register
Enterprise environmental factors
Organizational process assets
Project Management Plan According to the PMBOK® Guide, to develop the stakeholder management plan you can use the following information from the project management plan:
Life cycle and processes that will be applied to each phase of the project
Explanation of how the work will be executed to accomplish project objectives
Description of the human resources needed, addressing roles and responsibilities, reporting relationships, and staffing
Change management plan illustrating how changes will be controlled
Need and techniques for communication among stakeholders
Stakeholder Register Information that is needed to plan engagement with project stakeholders is provided from the stakeholder register.
Enterprise Environmental Factors All enterprise environmental factors can be used within the Plan Stakeholder Management process. Special attention should be given to the organizational structure and culture as well as external stakeholder requirements. It will be important to adapt the management of stakeholders to the project environment.
Organizational Process Assets The PMBOK® Guide notes that all the elements described in the enterprise environmental factors can be used in this process. Particular consideration should be given to lessons learned and historical information.
Tools and Techniques of Plan Stakeholder Management
The Plan Stakeholder Management process includes the following tools and techniques:
Expert judgment
Meetings
Analytical techniques
Expert Judgment Using the project objectives as a guide, a project manager should apply expert judgment when considering the level of engagement required for each stakeholder. It may be necessary to adjust the level of engagement considering the different phases of the project. In the creation of the stakeholder management plan, a project manager can look to the following groups depending on specialized training or subject matter expertise these individuals might possess. They include
Senior management and other identified key stakeholders
Project team members
Other functional units or individuals
Project managers who have completed similar projects
Subject matter experts in the business or project areas
Industry groups and consultants
Professional and technical associations
Meetings The stakeholder management strategy defines the level of participation needed for each stakeholder.
Analytical Techniques The current engagement level of all stakeholders should be compared to the planned levels of engagement to ensure project success. This is a critical process that needs to be performed throughout the life cycle of the project to help ensure satisfied stakeholders. According to the PMBOK® Guide, the level of engagement with stakeholders can be classified as follows:
Unaware, where the stakeholder is unaware of the project and potential impacts
Resistant, where the stakeholder is aware of the project but is resistant to change
Neutral, where the stakeholder is aware but is neither supportive nor resistant
Supportive, where the stakeholder is aware of the project and is supportive of change
Leading, where the stakeholder is actively engaged in ensuring the project is a success.
Table 3.9 shows how current engagement can be documented using the Stakeholders Engagement Assessment Matrix, where C indicates the current level of engagement and D indicates the desired level of engagement.
The following two outputs result from carrying out the Plan Stakeholder Management process:
Stakeholder Management Plan This component of the project management plan identifies the management strategies necessary to effectively engage stakeholders. Adding to the information provided by the stakeholder register, the stakeholder management plan often provides
Desired and current engagement levels of key stakeholders
Scope and impact of change to stakeholders
Interrelationships and potential overlap of stakeholders
Stakeholder communication requirements
Information and the desired format to be distributed to stakeholders
Explanation for distributing information
Time frame and frequency of distributing information
Method for updating and refining this plan as the project advances
Project Documents Updates The following updates may be required as a result of performing this process:
Project schedule
Stakeholder register
Obtaining Project Management Plan Approval
With the subsidiary plans and baselines created, it’s time to bring them all together into a project management plan. The project management plan consists of a compilation of these plans and baselines and is an output of the Develop Project Management Plan process. This primary plan is presented to key stakeholders for sign-off (if required). Once it’s approved, the team can move forward to execute the plan.
Develop Project Management Plan is the first process in the Planning process group, and it’s part of the Project Integration Management Knowledge Area. This process defines, coordinates, and integrates all the various subsidiary project plans and baselines. The result is a project management plan document that describes how the project outcomes will be executed, monitored, and controlled as the project progresses and how the project will be closed out once it concludes.
Throughout the project, the project management plan will be updated to reflect approved project changes. It will be used as an input to many of the project management processes, and as a result of approved changes, it will also become an output of several processes.
Figure 3.47 shows the inputs, tools and techniques, and outputs of the Develop Project Management Plan process.
FIGURE 3.47 Develop Project Management Plan process
Inputs of Develop Project Management Plan
Know the following inputs of the Develop Project Management Plan process:
Project charter
Outputs from other processes
Enterprise environmental factors
Organizational process assets
Project Charter Based on the high-level scope outlined in the project charter, the project team can start determining which project management processes will be most beneficial for this particular project.
Outputs from Other Processes Outputs from other project management processes may be used to develop the project management plan. In particular, the following outputs from the planning processes may be helpful inputs to develop the project management plan:
Any processes used that produce a baseline
Any processes that produce a subsidiary management plan
Enterprise Environmental Factors The following key elements of the environmental factors should be considered when choosing the processes to perform for this project:
Standards and regulations (both industry and governmental)
Company culture and organizational structure
Personnel administration
Project management information system (PMIS)
The PMIS is an automated or manual system used to document the subsidiary plans and the project management plan, facilitate the feedback process, and revise the documents.
Organizational Process Assets The following key elements of the organizational process assets should be considered within this process:
Project management plan template
Change control procedures
Historical information
Configuration management knowledge database that contains the official company policies, standards, procedures, and other project documents
Tools and Techniques of Develop Project Management Plan
Expert judgment and facilitation techniques are the only tools and techniques of the Develop Project Management Plan process.
The following types of expert judgment are needed to complete this process:
Tailoring techniques
Understanding technical and management details that need to be included in the project management plan
Determining resources and assessing skill levels needed for project work
Determining and defining the amount of configuration management to apply on the project
Output of Develop Project Management Plan
The output of the Develop Project Management Plan process is the project management plan.
The project management plan includes the following elements:
Processes used to perform each phase of the project
Life cycle used for the project and for each phase of the project when applicable
Tailoring of results the project team defines
Methods for executing the work of the project to fulfill the objectives
Change management plan describing methods for monitoring and controlling change
Configuration management
Methods for determining and maintaining the validity of performance baselines
Communication needs of the stakeholders and techniques to fulfill those needs
Management reviews of content, issues, and pending decisions
The project management plan also contains multiple subsidiary plans and baselines, as described in Table 3.10. Figure 3.48 depicts a high-level view of the contents that make up the plan.
FIGURE 3.48 High-level view of project management plan contents
This plan documents how the project requirements will be managed throughout the life of the project. It also addresses how the requirements will be analyzed and documented.
Schedule management plan
This plan identifies the scheduling format, tool, and methodology that will be used for creating and managing the project schedule.
Cost management plan
This plan defines the criteria for planning, budgeting, estimating, and managing the costs of the project. It also identifies the cost-related formats and tools that will be used in the project.
Quality management plan
This plan describes how the organization’s quality policies will be implemented and addresses the following items: quality assurance, quality control, and process improvement.
Human resource management plan
This plan documents how human resources should be defined, staffed, managed and controlled, and released from the project.
Communications management plan
This plan guides the communication for the project. It defines the communication requirements of the stakeholders as well as the format, type, frequency, and methods for project reports. It also lists report recipients and anything else pertinent to project communication.
Risk management plan
This plan defines how risk management activities will be carried out. It also outlines the budget and time allotted for risk activities, risk roles and responsibilities, risk categories, and how risks will be defined and assessed.
Procurement management plan
This plan describes how procurements will be managed, from make-or-buy decisions all the way through contract closure.
Stakeholder management plan
This plan identifies the management strategies necessary to effectively engage stakeholders.
Schedule baseline
This baseline is an approved version of the project schedule that will be used to compare and measure the planned schedule against the actual schedule.
Cost baseline
This baseline contains an approved budget that is used to measure, monitor, and control the planned budget against the actual amount of funds used.
Scope baseline
This baseline provides scope boundaries for the project and consists of the project scope statement, the work breakdown structure (WBS), and the WBS dictionary.
Conducting a Kickoff Meeting
A kickoff meeting typically occurs at the end of the planning process, prior to beginning the project work. The purpose of the kickoff meeting is to ensure that everyone is aware of the project details and their role within the project and to announce that the project work is ready to begin. This is a great opportunity to review project milestones and other important information with key stakeholders.
Meeting Attendees
Those who attend a kickoff meeting include, but are not limited to, the following individuals:
Project manager
Project team members
Customer
Project sponsor
Department managers
Other key stakeholders
Meeting Topics
The topics discussed within a kickoff meeting include, but are not limited to, the following:
Introductions of attendees
Meeting agenda
Review of the project management plan
Bringing the Processes Together
This chapter covered a tremendous amount of information; the Planning process group is the largest project management process group. In addition to understanding each process individually, you’ll need to know how the processes work together. Understanding that bigger picture will help you with situational exam questions as well as using the project management processes in a real-world setting.
Now that you have a strong grasp of how the outputs from various processes become the inputs for other processes, you understand why some processes must occur before others can move forward. For example, to create the project management plan, the results of the Initiating process group are required. Figure 3.49 shows this interaction between the Initiating process group and the Planning process group, the first two stages of the project’s life cycle. The relationship between the project management plan and the rest of the planning processes is just as interactive, if not more dynamic.
The project management plan is used in Planning processes across nine of the ten Knowledge Areas. (The remaining Knowledge Area generates the project management plan.) The results of these planning processes are fed back into the project management plan as updates. The updates might, in turn, impact several of the other planning processes. For example, the project management plan contains the cost management plan. Any changes that are approved in the cost management plan become updates to the project management plan. As a result, these approved and updated changes could impact other planning processes that might also require that updates and changes be made.
By now, it should be clear that the project management plan is the heart of the project and that much of the project’s success can be based on the processes of the Planning process group. A common motto in the project management industry is, “A well-planned project makes for a successful project.” Figure 3.50 illustrates how the project management plan remains at the center of the Planning process group.
In summary, the project management plan is a compilation of several subsidiary plans and baselines:
Change management plan
Communications management plan
Configuration management plan
Cost management plan
Cost baseline
Human resource management plan
Process improvement plan
Procurement management plan
Quality management plan
Requirements management plan
Risk management plan
Stakeholder management plan
Schedule baseline
Schedule management plan
Scope baseline
Scope management plan
The change management plan, which was not previously addressed, describes how you will document and manage change requests, the process for approving changes, and how to document and manage the final recommendation for the change requests. Configuration management changes deal with the components of the product of the project, such as functional ability or physical attributes, rather than the project process itself.
Scope is also a critical element within planning because it defines the boundaries of the project and what it is that the project has set out to achieve. As shown in Figure 3.47, the project schedule and the project budget are part of the project’s foundation. These project elements play a big role in measuring and monitoring the progress of the project. The resources and purchased services and/or products complete the project’s foundation. Without the human resources, as well as the external project teams, the project could not move forward.
Guiding the project from above are communications management, quality management, and risk management—all critical elements of the project that influence and guide the project toward success. As you can see, all of these project elements are intertwined and build on one another.
With this big picture in mind, let’s go back and review what you’ve learned thus far about each of the project management Knowledge Areas. You’ll find that what goes on within each Knowledge Area is connected on a high level and is structured in a logical format.
Project Scope Management Knowledge Area Review
You may recall that the project scope defines the work to be completed during the project, providing the project with boundaries. Figure 3.51 illustrates the process and inputs used to create the work breakdown structure. (Remember that the WBS is a decomposition of the project deliverables, down to the work package level.) The WBS becomes part of the scope baseline, as is the project scope statement and the WBS dictionary. The scope baseline is necessary input for activities in the next Knowledge Area, Project Time Management.
FIGURE 3.51 Project Scope Management Knowledge Area process interaction
Project Time Management Knowledge Area Review
Figure 3.52 reflects, step by step, how the project schedule is developed. The planning process flow within the Project Time Management Knowledge Area is extremely clear. It’s important to understand the following points:
The scope baseline is central to creating the initial list of project activities; creating the list is the first step toward developing the project schedule.
The project budget can influence the number and type of resources the project can use.
Clearly defining the resources needed to carry out the project activities is key to planning human resources and procurements.
FIGURE 3.52 Project Time Management Knowledge Area process interaction
Project Cost Management Knowledge Area Review
Figure 3.53 shows the key process steps for creating the project budget. The scope baseline is necessary for determining estimates for the cost of each activity. The cost management plan comes into play and governs how the activity costs are estimated and how the project budget is created.
FIGURE 3.53 Project Cost Management Knowledge Area process interaction
Project Quality Management Knowledge Area Review
The single planning step within the Project Quality Management Knowledge Area results in several key items in the quality management processes. Figure 3.54 shows how the information resulting from scope, cost, time, and risk planning processes is necessary for carefully planning project quality. This first step in defining project quality produces the following:
Method for planning, carrying out, and controlling quality activities
Metrics used to measure project quality
Method the project management team can use to approach and then carry out a process improvement strategy
FIGURE 3.54 Project Quality Management Knowledge Area process interaction
Project Human Resource Management Knowledge Area Review
Figure 3.55 depicts the only planning process within the Project Human Resource Management Knowledge Area. Key to this first process of the Knowledge Area is developing the human resource management plan, which will guide the rest of the processes relating to human resources, including hiring, developing, and managing the project team.
FIGURE 3.55 Project Human Resource Management Knowledge Area process interaction
Project Communications Management Knowledge Area Review
As you learned in this chapter, meeting stakeholder needs, requirements, and expectations is essential to a successful project. Project communications play a big role in meeting these objectives. Figure 3.56 depicts the only planning-related step within the Project Communications Management Knowledge Area. This step determines how project communications will be managed and defines stakeholder communication requirements. The result is the communications management plan. To define the communication needs and requirements of stakeholders, you need the following result of the Initiating process group: Stakeholder register.
FIGURE 3.56 Project Communications Knowledge Area process interaction
Project Risk Management Knowledge Area Review
Risk management planning begins as early as the project begins. The first step, which creates the risk management plan, is carried through early on during the planning phase of the project. Project plans, such as the cost management plan, the schedule management plan, and the communications management plan, are used to develop the risk management plan. The project scope statement is also used.
As depicted in Figure 3.57, the steps within risk management planning are very intuitive. First, you plan how to manage, assess, and deal with risks. Then, you identify and prioritize the identified risks. Analyzing the risks comes next. As you may recall, this can include qualitative risk analysis and quantitative risk analysis.
FIGURE 3.57 Project Risk Management Knowledge Area process interaction
With the existing information at hand, you can now plan how you will respond to risks that call for action. As you can see in Figure 3.57, the risk register is a living document, updated throughout the project as risks are identified. It documents all of the information about these risks and is therefore continuously updated as the processes are carried out.
Project Procurement Management Knowledge Area Review
Figure 3.58 shows the single procurement-planning step. Here you plan how procurements will be carried out and managed within the project. This activity also determines which products or services will be procured. A total of nine inputs feed the process.
FIGURE 3.58 Project Procurement Management Knowledge Area process interaction
The results include the following items:
A plan that lays out the guidelines for carrying out procurement activities, the types of contracts that will be used, and how vendor progress and performance will be measured
Make-or-buy decisions
Several key procurement-related documents, including procurement terms, the procurement statement of work, and source selection criteria
Project Stakeholder Management Knowledge Area Review
The Project Stakeholder Management Knowledge Area is concerned with identifying all of the stakeholders associated with the project, both internal and external to the organization. These processes also assess stakeholder needs, expectations, and involvement on the project and seek to keep the lines of communication with stakeholders open and clear. The definition of a successful project is one where the stakeholders are satisfied. These processes assure that stakeholder expectations are met and that their satisfaction is a successful deliverable of the project. Figure 3.59 depicts the only planning step in the Project Stakeholder Management Knowledge Area.
FIGURE 3.59 Project Stakeholder Management Knowledge Area process interaction
As you can see, the planning processes within each Knowledge Area are highly interactive. The processes interact not just within their own respective Knowledge Areas, but among the other planning processes.
Each project carries different needs, and not all of the processes will be necessary for every project. We previously touched on the fact that some processes can be combined to tailor management for a particular project to the needs of that individual project. But, as you’ve also seen, some process outputs are critical as inputs to other processes. The project management plan, which lies at the core of the Planning process group, is one of those critical outputs.
Review Questions
All of the following are subsidiary elements of the project management plan except
Quality management plan
Risk management plan
Project scope statement
Scope baseline
Which of the following best describes a focus group?
Gathering of prequalified subject matter experts and stakeholders who provide feedback
One-on-one conversations with stakeholders
Group of subject matter experts who participate anonymously
Group of cross-functional stakeholders who can define cross-functional requirements
Sam is currently in the planning stages of a project and is working on developing the project scope statement. As part of converting the product scope description into deliverables, he has used the product breakdown and systems analysis techniques. Which of the following tools and techniques of the Define Scope process is Sam currently using?
Expert judgment
Product analysis
Alternatives generation
Facilitated workshops
The following are included within the WBS dictionary except
Code of accounts identifiers
Cost estimates
Description of the work of the component
Activity list
While sequencing activities, a project manager decides to use the precedence diagramming method to show existing dependencies between activities. Which of the logical relationships is the project manager most likely to use?
Finish-to-start
Start-to-finish
Finish-to-finish
Start-to-start
Rodrigo is in the Plan Communications Management process of a new systems component project. He has determined that there are 32 stakeholders in the project. How many communication channels exist?
496
512
32
31
What is the purpose of the Perform Qualitative Risk Analysis process?
To determine how the project team will plan for risks
To identify and gather all potential risks within the project
To determine the impact and probability of identified risks and prioritize them
To evaluate the impact of risks prioritized and determine the risk exposure
Which type of contract carries the highest risk for the buyer?
Fixed-price contracts
Lump-sum contracts
Cost-reimbursable contracts
Time and material contracts
Which of the following quality theorists devised the zero defects practice?
Walter Shewhart
Philip B. Crosby
W. Edwards Deming
Joseph Juran
All of the following are tools and techniques of the Plan Quality Management process except
Statistical sampling
Flowcharts
Force field analysis
Operational definition
The scope management plan should contain the following information except
The process used to prepare the project scope statement
The definition of how deliverables will be checked for accuracy and the process for accepting deliverables
The list of all the requirements to be included in the scope
The process used to create the WBS
Which of the following is the purpose of collecting requirements?
Creating a clear billing structure for project reimbursement
Documenting stakeholder expectations for meeting the project objective
Establishing the order in which activities should be conducted
Determining the total budget that will be needed for the project
What is the correct definition of a project constraint?
Project constraints limit the options of the project team.
Project constraints are conditions presumed to be true.
Project constraints do not affect project outcomes.
Project constraints never change during the project.
What is the correct definition of a critical path task?
A critical path task must be done before all other project activities.
A critical path task does not affect the project schedule.
A critical path task is a project activity with schedule flexibility.
A critical path task is a project activity with zero float.
What is the cost baseline?
The total budget allocated to the project
The authorized, time-phased cost of the project
The source of all project funding
The barrier to entry to attempt the project
Which definition of the cost of quality (COQ) is correct?
COQ is cost associated with parts from a high-quality supplier.
COQ is a project forecast that is displayed on an S-curve.
COQ is the total cost to produce the product meeting the quality standards.
COQ increases the overall budget of the project.
All of the following are benefits of meeting quality requirements except
Increased stakeholder satisfaction
Higher productivity
Increased costs for the project
Reduction in rework
All of the following are determined by the Plan Human Resources Management process except
Project communication needs for stakeholders
Project roles and responsibilities
Reporting relationships for the project
Staffing management plan
All of the following are outputs of the Plan Procurement Management process except
Procurement statement of work
Make-or-buy analysis
Procurement documents
Source selection criteria
All of the following define the purpose of the Identify Risks process except

 Planning is the second of five project management process groups and includes the largest number of processes. Throughout the planning processes, the objectives are defined and refined, and a course of action is mapped out to successfully complete the project objectives as outlined by the project scope.